Story 11: Processing the data
Introduction
Completed Census forms provide raw data from the public. In order to turn the Census form responses into statistics to inform critical decision making across Australia, the data needs to be processed – cleared, edited and coded. This work takes several months, significant resources and technical expertise by ABS staff. We received just over 10 million forms, just under 80% being via the online system and the remainder mailed to us through Australia Post.
Data capture
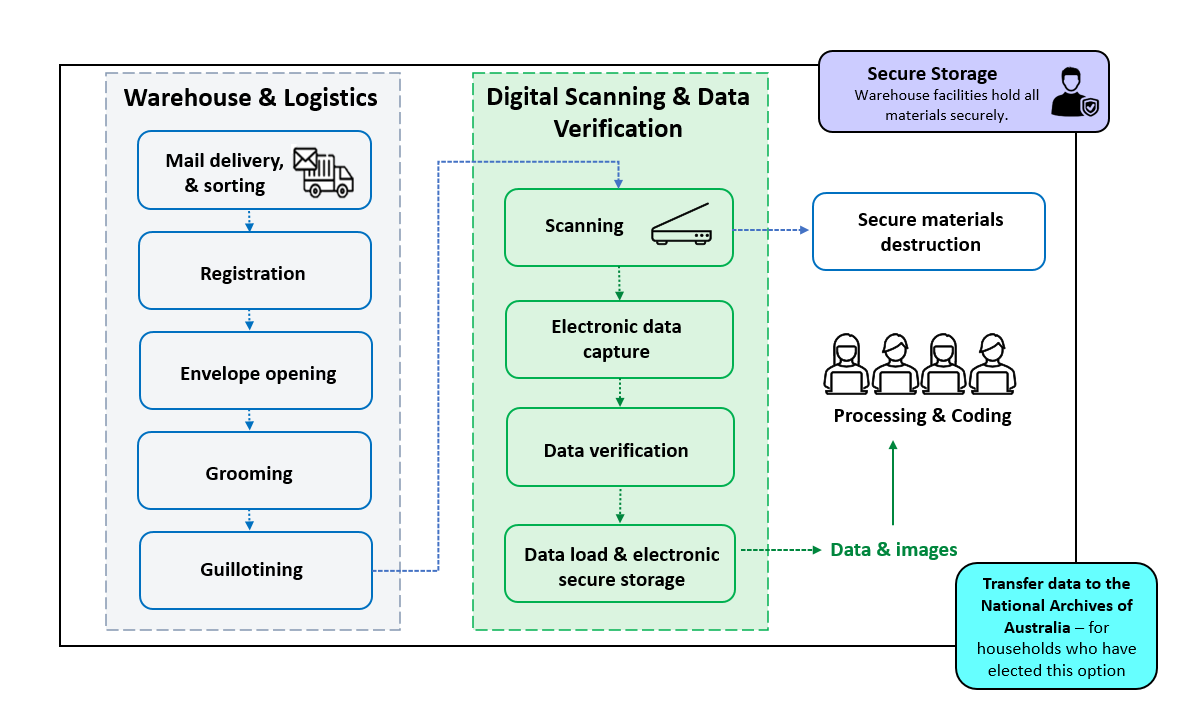
The first step in processing is Data Capture. The Census Data Capture Centre was a temporary facility established in Dandenong, Victoria to receive and process the paper forms. We ‘registered’ mail as soon as possible after it was received so that field staff ceased following up households that had already mailed back a form.
The paper forms were then prepared, guillotined and fed into industrial scanners to turn them into electronic images. These images were then converted into digital data using Intelligent Character Recognition (ICR) software, and any issues were addressed through human intervention (such as where the ICR software couldn’t interpret a handwritten response).
During this process, names and addresses were separated from the responses to Census questions and other personal or household information.
Image
Description
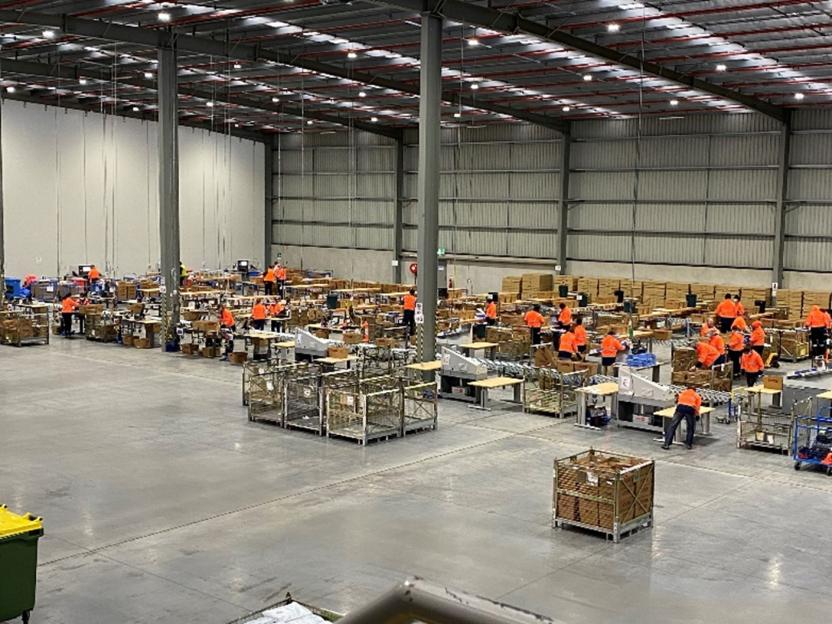
The 2021 Census Data Capture Centre in Dandenong
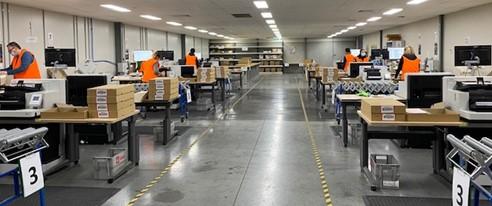
Scanning at the Census Data Capture Centre in Dandenong
Making sense of the data
With the responses to all questions in our databases we need to turn the answers to 64 Census questions into the 500 variables that are released as statistics.
An important aspect of this is to classify or code all answers to a standard list so that counts can be published in a recognisable and consistent way. As an example, one person might report their country of birth as ‘Stockholm’, while another writes ‘Sweden’. Both of these responses would be coded to ‘Sweden’ and eventually output as part of the count for Sweden in the Country of Birth topic. This coding activity occurs for all topics against all returned forms.
We have examined previous Census responses and other ABS surveys to develop an index of the most common ways people describe their job, the industry they work in, the qualification they have received, the address they live/work at and other specific demographic type questions. The Statistical Standards and Infrastructure section of the ABS then assign each of these entries in the index to the corresponding classification number in the relevant classification.
Automation
With over 1 billion Census questions responded to, we rely heavily on automation to undertake this coding. With every Census we find more efficient ways of doing this, while maintaining the expected data quality.
We have also added some 'smarts' to the online form to assist us in automation and to help respondents answer our questions. An example is targeted supplementary questions for Occupation and Industry. If you entered that you were a 'Nurse' into the online Census form, this would trigger a list of further options to choose from, for example, Nurse Practitioner, Midwife, Registered Nurse etc. These are assigned to the correct classification automatically without further clerical intervention.
Our systems also correct spelling mistakes, find relevant suburbs within given geographic areas and accurately match most responses to our indexes.
As good as these automated processes are, we still need to manually code responses that are too vague or unclear for our systems to recognise. This could be due to poor handwriting on paper forms or where the situation requires human intervention to resolve. Our coding staff are trained to apply their judgement in these situations. Other examples include where we receive duplicate forms for a dwelling, we may delete one of the forms or need to merge them if there are different people. We may also need to take some action if the form has a different address from where we sent information about Census participation.
While most responses are resolved through automation, even a small percentage of responses on the Census leads to a large volume of manual work. For the 2021 Census, this manual activity in processing required up to 550 staff over nearly seven months.
Image
Description
Filling in the gaps
The 2021 Census achieved a very high response rate of 96.1%. However, this means we did not receive forms for a small number of occupied dwellings on Census Day. For these dwellings we apply a statistical process called imputation that scientifically 'fills in the blanks' with people counts along with some of their basic demographics such as age and sex.
The ‘hot-deck’ imputation method is used when a Census form is not received from the household in an occupied dwelling. This method replaces the missing data with values from a similar responding household, called a ‘donor’. In the 2021 Census, administrative data was used in hot-decking imputation to improve the selection of donors for non-responding households.
Also, where respondents have started but not fully completed their form, we also impute the important variables of age, sex and marital status to all people in the dwelling with incomplete data. This process utilises other responses on their form and other carefully considered statistical methods reflecting these data items in the responding population, to best guess their situation.
Data Validation and Quality Assurance
We have a strong commitment to maintaining quality throughout the entire process in order to disseminate a rich and accurate data set for the country. While a 96% is a very strong response rate, we need to do our best to ensure that no small community or population grouping is insufficiently counted. This is particularly important for disadvantaged parts of the country.
It is also very important to not introduce any error during our processing such as coding an address to a wrong area.
One method of checking for error is to compare counts between this and the previous Census for all topics for all geographic areas and key population subgroups. Any variations detected are carefully checked to reassure us that they are valid, such as being the result of known population movements. We also use other data sources from government and non-government entities to assess the accuracy of all Census topics and special populations. This includes data for such things as homelessness, defence bases and mining areas.
We use data visualisation tools during this quality assurance to highlight areas, population groups and/or topics with results outside of expectations.
Image