¹ Departures from these assumptions are discussed separately: introduction of new providers is discussed in the Price index theory section , the treatment of new products is described in the Quality change and new products section, imputation for missing prices is discussed in this section and changes to the types of products in the marketplace are discussed in the Maintaining relevance section.
Latest release
Chapter 4 General Compilation Methodology
Producer and International Trade Price Indexes: Concepts, Sources and Methods
Reference period
2022
Released
29/04/2022
This section of the publication provides users with a summary of the current compilation methods and processes of the Producer and International Trade Price Indexes and detailed information for the current price indexes producer by the ABS for the Producer Price Indexes, Australia and International Trade Price Indexes, Australia releases.
Calculating the PPIs and ITPIs in Practice
This section of the publication explains the practical application of the methodology explained above in the technical methodology section of this release for the quarterly compilation of the Producer and International Trade Price Indexes.
Defining elementary aggregates
The first stage of the compilation process is to estimate the elementary aggregate values from a sample of prices. The elementary aggregate values take the form of a price index, and they are then averaged to obtain higher level indexes using the relative values of the value aggregates for the elementary aggregates as weights.
Elementary aggregates are constructed by grouping homogeneous individual products and transactions.
Groups may be formed from products in various regions of the country or from the country as a whole.
Likewise, elementary aggregates may be formed from different types of providers or from various sub-groups of products. The key points in constructing an elementary aggregate are:
- Elementary aggregates consist of groups of products that are as similar as possible in terms of price determining characteristics (i.e. the group of products is homogeneous).
- They consist of products that may be expected to have similar price movements. The objective should be to try to minimise the dispersion of price movements within the aggregate.
Each elementary aggregate, whether relating to the whole country, a region, or a group of providers, will typically contain a large number of individual products. In practise, only a small number of products can be selected for pricing. When selecting the products from period to period, the following considerations are taken into account:
- The transactions selected are ones whose price movements are believed to be representative of all the products represented by the elementary aggregate.
- The number of transactions within each elementary aggregate for which prices are collected should be large enough for the estimated price index to be statistically reliable and representative of the product sampled. The minimum number required will vary between elementary aggregates depending on the nature of the products and their price behaviour.
- The objective is to try to track the price of the same product over time for as long as possible, or as long as the product continues to be representative. Therefore, the products selected are ones that are expected to remain on the market for some time so that like can be compared with like.
The aggregation structure
The development of the aggregation structures for Producer and International Trade Price Indexes follow the technical methodology for weighting explored above.
Using different classifications of products and industries, the Producer and International Trade Price Indexes can be divided into broad divisions, sub-divisions, and groups, and then further refined into smaller sub-groups/classes depending on the classification structure adopted for the indexes (see below for further information on the classifications used for each Producer and Trade Price Index). At the bottom of the standard classification structure, further disaggregation is made to reflect different products and different price behaviours.
Each component in the price index, from the root level (or top level or all products) of the aggregation structure down to each individual elementary aggregate, is associated with two distinct characteristics that allow future compilation of aggregate price index measures, as defined in the Index Review methodology section above. These defining characteristics are:
- The link period value aggregate: The value aggregate defined at the period when the index weighting structures commence; this measure effectively determines the underlying quantity weights of the price index
- The link period P-index: The price index number at the period when the index weighting structures commence; it measures the price change for the component that occurred between the link period and the price index reference period; in the case where the link period and the index reference period are the same, the link period P-index takes a value of 100.0.
In addition to these characteristics, the elementary aggregates have one additional feature in that they are the only components within the index structure to have price samples. From these price samples, it is possible to directly construct price indexes. A price index for an elementary aggregate should measure price change and correctly account for changes in quality and both new and disappearing products.
The construct of an elementary aggregate index is also known as an elementary aggregate C-index.
Beginning with these two defining characteristics and the aggregation structure, price indexes are created by working upwards from the elementary aggregate C-indexes. All indexes above the elementary aggregate level are higher level indexes that can be calculated from the elementary price indexes using the elementary value aggregates as weights. The aggregation structure is consistent so that the weight (link period value aggregate) at each level above the elementary aggregate is always equal to the sum of its components.
The price index at each higher level of aggregation can be calculated on the bases of the weights and price indexes for its components, i.e. the lower level or elementary indexes. The individual elementary price indexes are not necessarily sufficiently reliable to be published individually, but they remain the basic building blocks of all higher-level indexes.
The compilation of elementary price indexes
Within the Australian PPIs and ITPIs, the elementary aggregate C-indexes are calculated using either the Laspeyres price index formula, the Lowe price index formula, or the Jevons (geometric mean) price index formula.
The Lowe price index is common across most index calculations due the price reference period and the weight reference period being at different times. The Laspeyres price index is illustrated by means of a numerical example in Table 4.1.
In the example, we have assumed that the following conditions apply:
- prices are collected for four representative products within an elementary aggregate
- the quality of each product remains unchanged over time so that the period-to-period changes compare like with like
- a set of weights is available for use in the Laspeyres index formula
- prices are collected for all four products in every period covered so that there is a complete set of prices
- there are no disappearing products, no missing prices and no replacement products.
This example has quite strong assumptions, because many of the problems encountered in practise are attributable to breaks in the continuity of the price series for the individual transactions for one reason or another¹.
The calculation of the elementary aggregate C- index begins through calculation of a weight for each price observation. For elementary aggregates that use the Jevons index formula, the weights are equal.
The majority of elementary aggregates in the Producer and International Trade Price Indexes use the Laspeyres index formula, which is applied through the price relative form. In this form, price relatives are combined using weights that represent the value share in the reference period. These weights represent not only the value of the particular transactions included for pricing in the elementary aggregates each period but also the other transactions which these observations represent. The reference period value share is determined once for each observation and is only modified if the products in the elementary aggregate are changed; in which case the elementary aggregate undergoes sample maintenance, which is described in more detail in the Maintaining relevance section below.
| Reference period | Period 1 | Period 2 | ||||||||
|---|---|---|---|---|---|---|---|---|---|---|
| Reference period value share | Price ($) | Price Relative | Weight x relative | Price ($) | Price Relative | Weight x relative | Price ($) | Price Relative | Weight x relative | |
| Product A | 30 | 5 | 1.000 | 30.000 | 6 | 1.200 | 36.000 | 7 | 1.400 | 42.000 |
| Product B | 20 | 7 | 1.000 | 20.000 | 7 | 1.000 | 20.000 | 6 | 0.857 | 17.143 |
| Product C | 10 | 2 | 1.000 | 10.000 | 3 | 1.500 | 15.000 | 4 | 2.000 | 20.000 |
| Product D | 40 | 5 | 1.000 | 40.000 | 5 | 1.000 | 40.000 | 5 | 1.000 | 40.000 |
| Laspeyres price index | 100.0 | 111.0 | 119.1 | |||||||
| Percentage change from previous period | 11.0% | 7.3% | ||||||||
This example shows a price index of 111.0 in period 1, and 119.1 in period 2. The prices in the elementary aggregate have moved 11.0% in the first period, 7.3% in the second period and 19.1% since the reference period.
Footnotes
Compiling the Primary Price indexes
Once a price movement for the elementary aggregate is determined, the resulting C-index price movement is used to price update the value aggregate associated with the elementary aggregate. The resulting measure is known as the price updated value aggregate (or current period value aggregate).
For a given elementary aggregate:
\(VA^t_{EA}=\frac{I^t_C}{I^{t-1}_C}\times VA^{t-1}_{EA}\)
where \(VA^t_{EA}\) is the current period value aggregate for the elementary aggregate in period \(t\), \(VA{_{EA}}^{t-1}\) is the previous period value aggregate, and \(I^t_C\) and \(I_C^{t-1}\)are respectively the current and previous period C-indexes for the elementary aggregate.
The price updated value aggregate is then used to determine the current period P-index for the elementary aggregate.
\(I^t_{P,EA}=\frac{VA^t_{EA}}{VA^{LINK}_{EA}}\times I^{LINK}_{P,EA}\)
where \(I^t{_p}\) is the current period P-index for the elementary aggregate in period \(t\), \(VA_{EA}{^{LINK}}\)is the link period value aggregate for the elementary aggregate and \(I^{LINK}{_{P,EA}}\) is the link period P-index for the elementary aggregate.
Once the current period value aggregates for all elementary aggregates are determined, the current period value aggregates for all higher level components of the index structure are calculated by summing the price updated value aggregates of their components.
Current period price indexes for any component in the aggregation structure are then calculated by price updating the link period P-index for the component. That is, for any component, the current period P-index is given by:
\(I^t_p=\frac{VA^t}{VA^{LINK}}\times I^{LINK}_{P}\)
where \(I^t{_P}\) is the current period P-index in period \(t\), \(VA^t\) is the current period value aggregate for the component, \(VA^{LINK}\) is the link period value aggregate for the component and \(I_P{^{LINK}}\) is the link period P-index for the component of the index (or aggregation) structure.
Calculating points contribution and points change
Points contributions are also calculated using the value aggregates. In any period, the points contribution of a component to the top level is calculated by multiplying the root index number for the period by the value aggregate for the component in that period and dividing by the root value aggregate for that period. This can be stated algebraically as:
\(PC^t_i=I^t{_{P,ROOT}} \times \frac{VA^t_i}{VA^t_{ROOT}}\)
where \(PC^t{_i}\) is the points contribution for component \(i\) in period \(t\), \(I^t{_{P,ROOT}}\) is the P-index for the root in period \(t,VA^t{_i}\) is the value aggregate for component \(i\) in period \(t\) and \(VA^t{_{ROOT}}\) is the value aggregate for the root of the index in period \(t.\)
Changes in points contribution for a component of a price index give an assessment of the component’s contribution to net price change. However, such a comparison is limited to periods between linking of price indexes. Comparisons of a component’s contribution to the index that cross a link period are comparing contributions on different weighting bases and therefore do not measure the contribution to net price change; any attempt at such comparison will confound change of weight with change of price.
Calculation of upper level price indexes is illustrated in Table 4.2. This table shows an input price index where products are classified by source (domestic and imported) and then by type of product. In Part 1 the P-index for period 1 is calculated. Part 2 shows the calculation of the percentage movement in the elementary aggregate C-index from period 1 to period 2. Part 3 shows how the current period value aggregates for period 2 are then derived and used to calculate the P-index for period 2.
| Value aggregates | P-Index | Elementary Aggregate C-Index | Price Updated Value aggregate(Period 2) | P-Index(period 2) | |||||
|---|---|---|---|---|---|---|---|---|---|
| Link Period | Period 1 | Link Period | Period 1 | Period 1 | Period 2 | % movement | |||
| Total inputs | 105,479 | 133,610 | 105.6 | 133.7 | 152625 | 152.7 | |||
| Imports | 41,198 | 44,909 | 110.0 | 119.9 | 47989 | 128.1 | |||
| Textile, clothing, footwear | 5,682 | 5,750 | 109.3 | 110.6 | 110.6 | 109.7 | -0.8% | 5704 | 109.7 |
| Wood and paper products | 4,654 | 4,753 | 100.3 | 102.4 | 102.4 | 106.3 | 3.8% | 4934 | 106.3 |
| Chemicals, plastic, rubber | 11,127 | 10,742 | 97.1 | 93.7 | 93.7 | 96.2 | 2.7% | 11029 | 96.2 |
| Fabricated products | 16,099 | 17,885 | 107.8 | 119.7 | 119.7 | 120.7 | 0.8% | 18035 | 120.7 |
| Agricultural products | 562 | 548 | 119.9 | 116.9 | 116.9 | 121.8 | 4.2% | 571 | 121.8 |
| Mining products | 3,074 | 5,230 | 103.2 | 175.6 | 175.6 | 259.1 | 47.6% | 7717 | 259.1 |
| Domestic | 64,281 | 88,701 | 104.7 | 144.5 | 104635 | 170.5 | |||
| Agricultural products | 28,036 | 38,530 | 107.9 | 148.3 | 148.3 | 148.1 | -0.1% | 38478 | 148.1 |
| Electricity and gas | 11,169 | 12,289 | 110.0 | 121.0 | 121.0 | 125.6 | 3.8% | 12756 | 125.6 |
| Forestry and logging | 1,472 | 1,738 | 113.0 | 133.4 | 133.4 | 142.4 | 6.7% | 1856 | 142.4 |
| Mining products | 23,604 | 36,144 | 102.6 | 157.0 | 157.0 | 223.9 | 42.6% | 51546 | 224.0 |
Compiling price indexes
Compiling primary price indexes
Generally, there are three kinds of product price indexes for a given industry. Firstly, primary indexes that show changes in prices received by producers in the industry for products made primarily, but not necessarily exclusively, by that industry. The industry within which a producer is classified is determined by those products that account for the largest share of the company's total value of shipments. Secondly, many industries have secondary product indexes that show changes in prices received by producers in the industry for products made chiefly in some other industry. Finally, some industries may have miscellaneous product indexes to show price changes in other sources of revenue received by producers within the industry.
Compiling secondary price indexes
A key philosophy of price index design for the Producer and International Trade Price Indexes is to re-use components to maximise the utility of collected data. One mechanism that helps achieve this aim is through the construction of secondary indexes. The preceding sections have described how elementary aggregate price indexes can be combined to produce higher level indexes. The particular combination of elementary aggregates is determined by the underlying classification of the price index.
However, a given elementary aggregate may be classified in multiple ways. Reclassifying elementary aggregates according to a different aggregation structure results in a secondary index. The relationship between the original primary source index and the secondary index is marked by two important features. First, the elementary aggregates for the secondary index are the same as those in the primary source index, having the same P-indexes and value aggregate data.
Second, the primary source index and the secondary index are identical at the root or top level of the index. The indexes only differ at the intermediate levels (between the root and the elementary aggregates), since a secondary index is defined through the different aggregation structure.
Frequent use of secondary indexes occurs within the International Trade Price Indexes, with classification by both Standard International Trade Classification and Broad Economic Categories.
An example of a secondary index is provided in Table 4.3. This example uses a reclassification of the elementary aggregates presented in Table 4.2, with emphasis on type of product rather than the domestic or imported split.
| Value aggregates | P-Index | |||
|---|---|---|---|---|
| Link Period | Period 2 | Link Period | Period 2 | |
| Materials used | 105,479 | 152,625 | 105.6 | 152.7 |
| Agricultural products | 28,597 | 39,048 | 108.1 | 147.6 |
| Domestic | 28,036 | 38,478 | 107.9 | 148.1 |
| Imported | 562 | 571 | 119.9 | 121.8 |
| Chemicals, plastic, rubber | 11,127 | 11,029 | 97.1 | 96.2 |
| Imported | 11,127 | 11,029 | 97.1 | 96.2 |
| Electricity and gas | 11,169 | 12,756 | 110.0 | 125.6 |
| Domestic | 11,169 | 12,756 | 110.0 | 125.6 |
| Fabricated products | 16,099 | 18,035 | 107.8 | 120.7 |
| Imported | 16,099 | 18,035 | 107.8 | 120.7 |
| Forestry and logging | 1,472 | 1,856 | 113.0 | 142.4 |
| Domestic | 1,472 | 1,856 | 113.0 | 142.4 |
| Mining Products | 26,679 | 59,263 | 102.6 | 228.0 |
| Domestic | 23,604 | 51,546 | 102.6 | 224.0 |
| Imported | 3,074 | 7,717 | 103.2 | 259.1 |
| Textile, clothing, footwear | 5,682 | 5,704 | 109.3 | 109.7 |
| Imported | 5,682 | 5,704 | 109.3 | 109.7 |
| Wood and paper products | 4,654 | 4,934 | 100.3 | 106.3 |
| Imported | 4,654 | 4,934 | 100.3 | 106.3 |
The key feature of secondary indexes is that they rearrange the existing basic building blocks of the price index along a different compilation structure, and in doing so retain both the price movements and underlying value aggregates of the elementary aggregates.
Compiling Tertiary price indexes
It is also possible to construct tertiary indexes, where price movements are retained but an entirely new weighting pattern is applied. In this case the resulting tertiary index has consistent price movements at the elementary aggregate level, but results in a different price movement at the top or root of the index. This device is a powerful analytical tool that allows further re-use of price samples.
Price Indexes and the Value Aggregate
A price index is only meaningful in relation to the basket to which it refers. The value aggregate is a measure that expresses the reference period quantities in terms of current period prices. For an input price index, a value aggregate is a measure of expenditure, and for an output price index it is a measure of revenue. A value aggregate, with prices from period t and quantities from period 0 is defined as:
\(V^{0,t} = {\displaystyle\sum_{i=1}^{N} P^t_iq^0i}\)
The value aggregate includes the specification of a group of included products (which items to include), the economic agents engaging in transactions involving those products (which transactions to include), as well as the valuation and time of recording principles motivating the behaviour of the economic agents undertaking the transactions (determination of prices). The included elementary items, their valuation (the \(p^t_i\)), the eligibility of the transactions and the item weights (the \(p^0_i\)) are all included in the definition of the value aggregate.
General weighting information of the Producer and International Trade Price Indexes
For detailed information about the current weights for the Producer Price Indexes, please refer to Producer Price Indexes, March 2022.
For detailed information about the current weights of the Childcare Services Cost Index please refer to Introducing a new Childcare Services Cost Index.
For detailed information about the current weights for the International Trade Price Indexes, please refer to the September quarter release of International Trade Price Indexes, which is re-weighted and update annually.
Summary of the Current Suite of Producer and International Trade Price Indexes
Details of the key Australian Producer and International Trade Price Indexes published by the ABS are outlined by industry below.
For each price index group, information relating to the scope, classification, weights, and practical difficulties and issues for each index.
Further information on historical development and changes for each index can be found in Chapter 5.
| Type of index | Output price indexes (transaction flow). Note: a more detailed description of the Final PPIs can be found in Chapter 5 Historical background. |
| Purpose | The Final Demand price index is a broad economy-wide supply-side price index that is derived from the former Stage of Product Framework of the Producer Price Indexes. It provides a headline summary analytical series for the Producer Price Indexes. |
| Major uses | A general indicator of price change across the Australian economy at the final stage of demand. |
| Pricing basis | basic prices |
| Classification system | Products are classified according to their industry of origin (or competing industry of origin for imports) according to Australian and New Zealand Standard Industrial Classification (ANZSIC) 2006 Imported products are classified to their equivalent Australian industry of origin |
| Weight reference period | 2018-19 |
| Link period | December quarter 2021 |
| Index reference period | 2011-12=100.0 |
| Type of index | Input price index |
| Purpose | This price index measures changes in the prices paid for input to the coal mining industry. |
| Major uses | The major use of this price index is for contract adjustment. |
| Pricing basis | Purchasers’ prices, in this case actual transaction prices (including any discounts etc.) paid by coal mines to suppliers for inputs delivered to mine sites). The prices used include all relevant charges and freight costs, net of any discounts and rebates. The Goods and Services Tax (GST) is excluded from the prices because, in the main, it is deductible on business-to-business transactions. Prices include delivery to a mine site, or to the primary storage site for a group of mines. |
| Classification system | The Input to the Coal mining industry index is classified in accordance with the Australian and New Zealand Standard Industrial Classification (ANZSIC) 2006. |
| Weight reference period | 2018-19 |
| Link period | March quarter 2023 |
| Index reference period | 2011-12 = 100.0 |
| Type of index | Output price index (gross division) |
| Purpose | Measures changes in the prices in output of the manufacturing industry as a whole, and by the fifteen subdivisions within the manufacturing division. |
| Major uses | Volume measures in the Australian National Accounts; general economic analysis; contract adjustment. The components of these indexes are also inputs to the Final Demand indexes. |
| Pricing basis | Basic prices, the manufacturers' selling prices, exclusive of excise taxes and GST. As far as possible, actual transaction prices are collected from businesses, representative of discounts offered or other differences from list prices. The index aims to measure prices ex-factory, although costs such as transport and handling are included if they are an indistinguishable part of the price. |
| Classification system | Products are classified according to the Input-Output Product Classification (IOPC). Published indexes are classified according to Australian and New Zealand Standard Industrial Classification (ANZSIC) 2006 |
| Composition and weighting | Indexes are published for total manufacturing (ANZSIC 2006 Division C), and for selected industry groupings based on ANZSIC 2006 down to four digit levels. The total division index is compiled on a gross division basis, i.e. prices relate to all products produced by manufacturers, including those sold overseas and used by the manufacturers. Upper level weights are derived from Input-Output tables. |
| Weight reference period | 2018-19 |
| Link period | December quarter 2021 |
| Index reference period | 2011-12 = 100.0 |
| Type of index | Input price index |
| Purpose | Measures changes in the prices of goods and services used by the manufacturing industry as a whole, and by the fifteen Australian and New Zealand Standard Industrial Classification (ANZSIC) 2006 subdivisions within the manufacturing division. Series are also provided for goods and services classified according to whether they are domestically produced or imported. |
| Major uses | Volume measures in the Australian National Accounts; general economic analysis; contract adjustment. |
| Pricing basis | Manufacturers' purchase prices, generally on a delivered into store basis. This equates to purchasers’ prices. As far as possible, actual prices are collected from manufacturers, with some exceptions when it is more efficient to collect from suppliers (for example, electricity prices). |
| Classification system | Products are classified according to IOPC. Published indexes describe industry of use and products classified by industry of origin, with industries classified in accordance with ANZSIC 2006. |
| Composition and weighting | Indexes are published for total manufacturing (ANZSIC 2006 Division C), and for selected industry groupings based on ANZSIC 2006 down to four digit levels. The total division index is compiled on a gross division basis, i.e. prices relate to all products purchased by manufacturers, including those purchased from overseas. Similarly, independent gross division indexes are also compiled at the subdivision and group (two and three digit) levels. Upper level weights are derived from Input-Output tables. |
| Weight reference period | 2018-19 |
| Link period | December quarter 2021 |
| Index reference period | 2011-12 = 100.0 |
| Type of index | Output price index (gross division) |
| Purpose | These price indexes measure changes in the prices received for the output of selected components of the construction industries. |
| Major uses | Volume measures in the Australian National Accounts, general economic analysis; contract adjustment. The components of these indexes are also inputs to the Final Demand indexes. |
| Pricing basis | Basic prices. The general approach is model pricing, where the components of a 'typical' construction project are repriced over time to provide measures of price change. The price indexes generally use prices for work undertaken in each capital city, as construction activity in the city is taken to represent the whole state or territory. For Queensland, however, Other Residential Building Construction and Non-Residential Building Construction also use prices obtained for North Queensland. |
| Classification system | The Output of the Construction Industries indexes are classified in accordance with Australian and New Zealand Standard Industrial Classification (ANZSIC) 2006. |
| Composition and weighting | ANZSIC 2006 class indexes at the State and Territory level are aggregated to the national level using proportions based on the value of work done by State and Territory and by type of construction as measured by the Building Approvals, Australia (cat. no. 8731.0). Class level weights for ANZSIC 06 Division 30 – Building construction are derived using Building Activity, Australia (cat. no. 8752.0). ANZSIC 06 Division 31 - Heavy and Civil Engineering Construction weights are based on Engineering Construction Activity, Australia (cat. no. 8762.0). |
| Weight reference period | 2020-22 |
| Link period | June quarter 2022 |
| Index reference period | 2011-12 = 100.0 |
| Type of index | Input price index |
| Purpose | Measures changes in the prices of selected inputs used in the construction of detached houses in each of the six state capital cities. |
| Major uses | Volume measures in the Australian National Accounts, general economic analysis; contract adjustment. |
| Pricing basis | Purchasers’ prices, in this case actual prices (including any discounts etc.) paid by building contractors or subcontractors for inputs delivered to the building sites. Deductible indirect taxes such as GST are excluded from prices. Prices are collected directly from manufacturers and wholesalers of building materials rather than from builders themselves, although such prices include delivery to building site where appropriate. |
| Classification system | The Input to the House Construction industry index is classified in accordance with Australian and New Zealand Standard Industrial Classification (ANZSIC) 2006, Class 3011 - House Construction. |
| Composition and weighting | The weighting pattern is calculated using bill of quantities data for 2019 -20 obtained from quantity surveyors. These quantities are price updated to June 2020 and then benchmarked to the Building Approvals, Australia (cat. no. 8731.0) total value work done for houses, by capital city. The weighting pattern for each capital city index reflects variations in prices for the cities as applied to an Australian average basket of house building inputs, with some allowance for city specific building practises, for example the differential use of steel and timber materials in Perth and Adelaide compared with the other capital cities. |
| Weight reference period | 2018-20 |
| Link period | June quarter 2020 |
| Index reference period | 2011-12=100.0 |
| Current services industries indexes |
|
| Type of index | Output price index (gross division) |
| Purpose | Measure changes in the prices of services from selected divisions of Australian and New Zealand Standard Industrial Classification (ANZSIC) 2006. Note that some ANZSIC 2006 industries do not yet have established indexes, and thus are not represented within these tables. |
| Major uses | Volume measures in the Australian National Accounts; general economic analysis; contract adjustment. The components of these indexes are also inputs to the Final Demand index. |
| Pricing basis | Prices relate to amounts received by service providers, exclusive of any taxes on products and transport and trade margins. Where possible, actual prices, including the effects of any discounts offered are used in the indexes. Samples are regularly updated, and pricing methodologies are reviewed over time. The complexities involved in measuring services output prices mean that there is no single method of pricing. The most appropriate pricing strategy for any individual business provider is determined by way of industry consultation. |
| Classification system | Services are classified according to their ANZSIC 2006 industry of origin (4-digit class level). Indexes are available at the 4 digit ANZSIC 2006 level for most services, with aggregate indexes published for significant groups, subdivisions and divisions. |
| Composition and weighting | ANZSIC 2006 class indexes are aggregated to the relevant group, subdivision and division using weights derived from the Australian National Accounts: Input-Output Tables - Electronic Publication, 2018-19 Final (cat. no. 5209.0.55.001). |
| Weight reference period | 2018-19 |
| Link period | December quarter 2021 |
| Index reference period | 2011-12=100.0 |
| Type of index | Input index |
| Purpose | Measures changes in prices paid by childcare providers for the goods, services and labour, they purchase to provide childcare services to households. These costs are measured from the perspective of businesses providing childcare services |
| Major uses | The results of the CSCI are used as a guide for determining the annual fee growth limit under the Early Childhood Education and Care Worker Retention Payment program. Under this program, over two years, the Government will fund wage increases for the Early Childhood Education and Care (ECEC) workforce of 15% above the modern award rates. Providers who opt-in to this program must meet a range of conditions, as specified in the Grant Guidelines, including a fee constraint condition limiting annual fee increases |
| Pricing basis | Included are consumables such as food, nappies and educational materials, purchased services such as cleaning, accounting and financial services. Costs for labour, superannuation, payroll tax, rent, lease, and hiring are also included. The prices are obtained from a variety of internal and external sources. |
| Classification system | Childcare service providers represented in this index are businesses classified to the Australian and New Zealand Standard Industrial Classification (ANZSIC) class 8710, Child Care Services. This class consists of businesses mainly engaged in providing day care of infants or children, including childcare services, before and/or after school services and childminding services |
| Weight reference period | 2018-2019 |
| Link period | June quarter 2019 |
| Index reference period | 2019-06=100.0 |
| Type of index | Output price index |
| Purpose | The Export Price Index (EPI) measures changes in the prices received for exports of merchandise from Australia, including re-exports (goods which are imported into Australia then exported at a later date without physical transformation). The index numbers for each quarter relate to prices received for exports actually shipped during that quarter. |
| Major uses | To support the compilation of the Australian National Accounts and the Balance of Payments. More specifically to deflate merchandise trade values when calculating chain volume measures (CVM’s) and the calculation of CVM’s of exports on a Balance of Payments basis. Form part of the suite of producer price Indexes (PPI’s), used in contractual agreements and an indicator of our terms of trade. |
| Pricing basis | In general, prices are obtained from major exporters of the selected products included in the index. The prices used in the index are free on board (f.o.b.) at Australian ports of export, i.e: the price at which the products physically leave Australia. Prices used in the index are expressed in Australian currency. As a result, changes in the relative value of the Australian dollar against overseas currencies (in particular the major trading currencies such as the US dollar, Japanese yen, Pound sterling and Euro) can have a direct and significant impact on the price movements of the many products that are sold in currencies other than Australian dollars. Forward exchange cover is excluded from the prices used in the index. |
| Classification system | Products in the EPI are primarily classified according to the Australian Harmonised Export Commodity Classification (AHECC). Secondary Index numbers are produced and published according to other classifications; (i) The Standard International Trade Classification (SITC), Revision 4; (ii) ANZSIC (industry of origin basis); and (iii) the Balance of Payments Broad Economic Category Classification (BoPBEC). |
| Composition and weighting | The EPI is a Laspeyres type index that is annually chain linked. Products are selected based on their value of exports in the preceding two years. Their weights are derived from the same value of exports sourced from International Merchandise Trade. For example, data from the years 2019/20 and 2020/21 are combined to inform the selection of products and to derive their weights for the index in 2021/22. |
| Weight reference period | The weight reference period spans the preceding two years. For example, the 2021/22 financial year indexes have a weight reference period that spans the 2019/20 and 2020/21 financial years. |
| Link period | June quarter each year |
| Index reference period | 2011-12=100.0 |
| Type of index | Input price index |
| Purpose | The Import Price Index (IPI) measures changes in prices paid for imports of merchandise into Australia. The index numbers for each quarter relate to prices paid for imports landed in Australia during the quarter. |
| Major uses | To support the compilation of the Australian National Accounts and the Balance of Payments. More specifically to deflate merchandise trade values when calculating chain volume measures (CVM’s) and the calculation of CVM’s of imports on a Balance of Payments basis. Form part of the suite of producer price Indexes (PPI’s), used in contractual agreements and an indicator of our terms of trade. |
| Pricing basis | Prices of individual shipments are obtained from major importers of the selected items. Imports are priced on a f.o.b. country of origin basis. Freight and insurance charges involved in shipping the products from foreign countries to Australian ports are excluded from the prices used in the index, as are Australian import duties. All prices used in the IPI are expressed in Australian currency. |
| Classification system | As a result, changes in the relative value of the Australian dollar against overseas currencies (in particular the major trading currencies such as the US dollar, Japanese yen, Pound sterling and Euro) can have a direct and significant impact on the price movements of the many products that are sold in currencies other than Australian dollars. Forward exchange cover is excluded from the prices used in the index. |
| Composition and weighting | The Standard International Trade Classification (SITC), Revision 4 is the primary classification system for the IPI. |
| Weight reference period | As a result, there has been no material impact on the indexes, which remain comparable across the changes in classification. Secondary Index numbers are produced and published according to other classifications; (i) ANZSIC (industry of origin basis); (ii) the Balance of Payments Broad Economic Category Classification (BoPBEC); and (iii) the international Harmonised System (HS). |
| The IPI is an annually reweighted chained Laspeyres index. Products are selected based on their value of exports in the preceding year. Their weights are derived from the same value of import sourced from International Merchandise Trade. For example, data from the year 2020/21 inform the selection of products and to derive their weights for the index in 2021/22. | |
| The IPI is reweighted each year, linked through the June quarter, based on the average values of imported merchandise trade for the immediately preceding financial year. | |
| Link period | June quarter each year |
| Index reference period | 2011-12=100.0 |
Use of Price Indexes
This section of the publication provides users with a detailed breakdown of the key users and use of the Producer and International Trade Price Indexes.
National Accounts and Balance of Payments – Deflation Principle
The Producer and International Trade Price Indexes are used to deflate values of a number of components in the Australian National Accounts, including industry inputs and outputs, sales, capital expenditure and inventory data to produce chain volume measures. The deflation process is integral to the compilation of Gross Domestic Product and its components. In addition, International Trade Price Indexes are used in the compilation of Balance of Payments Chain Volume Measures.
Price deflation is achieved by dividing the current price value for a period (quarter or year) by a measure of the price component (usually in the form of a price index) for the same period. This technique re-values the current price value in the prices of a base period (in the Australian volume measures this is generally the previous year)¹.
Revaluation of the current period values using earlier period prices is defined in the following format:
\(\frac{V^t}{\big(\frac{P^t}{P^{t-1}}\big)}=P^{t-1}Q^t\)
\(\Delta Q=\frac{P^{t-1}Q^t}{P^{t-1}Q^{t-1}}\)
Where \(V\) refers to value, \(P\) refers to price, \(Q\) refers to quantity (or in National Accounts terminology, volume), and the superscripts \(t \space t-1\) refer to current and previous periods respectively.
More information on the use of price indexes in the production of the Australian National Accounts can be found through the following sources:
Footnotes
National Accounts and Balance of Payments – Derived Measures
The following is a list of derived statistical measures produced by the Australian National Accounts branch using the Producer and International Trade Price Indexes as inputs.
Chain Price Indexes and Implicit Price Deflators
Chain Price Indexes published quarterly in the Australian National Accounts are annually re-weighted. Chain Price Indexes are obtained by first weighting together elemental price indexes from the previous financial year to the current financial year to produce annual indexes, or to quarters in the current financial year to produce quarterly indexes, where the weights are calculated using expenditure shares of the previous financial year. Second, the resulting aggregate year-to-year or year-to-quarter price indexes are linked (compounded) together to form a time series. Third, the time series is referenced to 100.0 in the reference year. All quarterly indexes are benchmarked to annual indexes.
In addition to the Chain Price Indexes published for the major Australian National Accounts aggregates, the ABS publishes a range of Implicit Price Deflators.
An Implicit Price Deflators is obtained by dividing a current price value by its real counterpart (the Chain Price Indexes). When calculated from the major national accounting aggregates, such as Gross Domestic Product, Implicit Price Deflators relate to a broader range of goods and services in the economy than that represented by any of the individual price indexes published by the ABS. Movements in an Implicit Price Deflator both changes in price and changes in the composition of the aggregate for which the deflator is calculated.
Implicit Price Deflators do not compare the price of a constant basket of products (goods and services) between any two periods. Implicit Price Deflators calculated from quarterly aggregates are more likely to be affected by changes in the physical composition of those aggregates. As much of the period-to-period change in the physical composition is of a seasonal nature, Implicit Price Deflators derived from seasonally adjusted data are normally more reliable measures of price change than those calculated from unadjusted data.
However, seasonally adjusting the series may not completely eliminate the impact of seasonal changes on the derived Implicit Price Deflators.
Implicit Price Deflators are weighted using current period weights and are conceptually a Paasche price index.
Implicit Price Deflators and Chain Price Indexes are published for expenditure components of Gross Domestic Product.
Chain Price Indexes and Implicit Price Deflators are published quarterly as part of Australian National Accounts: National Income, Expenditure and Product, and Balance of Payments and International Investment Position, Australia .
Period-to-period movements in fixed-weight price indexes are generally consistent with those for Chain Price Indexes for indexes with similar coverage. The Chain Price Indexes are considered the most suitable indexes for measuring actual price change, as the effects of compositional change are excluded from these indexes whereas Implicit Price Deflators are affected by compositional change. Both Chain Price Indexes and Implicit Price Deflators are subject to ongoing revisions, in line with revisions to underlying Gross Domestic Product weights.
Commercial indexation
The use of ABS price indexes for commercial indexation is often taken due to the intendent nature of the ABS which allows business and government to view the Producer and International Trade Price Indexes as ‘independent indicators’. The use of price indexes for indexation is common in long-term contracts across industry and government.
While the ABS recognises that the price indexes it produces are used for commercial purposes, the ABS neither endorses nor discourages such use. The ABS does not advise, comment, or assist in preparing or writing contracts.
For further information on the ABS policy concerning the use of price indexes for contract indexation purposes please refer to – Inflation and Price Indexes – Use of Price Indexes in Contracts.
Economic Monitoring – Domestic
The Producer and International Trade Price Indexes, as well as the supplementary Childcare Services Cost Index, are used by Australian Commonwealth, State and Territory governments, industry, and academics for economic monitoring, reporting and modelling purposes. As broad economy based and industry level price indicators, the Producer and International Trade Price Indexes are an important source of information for inflation monitoring for the Australian economy and are regularly used to inform government and industry policy and investment decisions.
Economic Monitoring – International
The ABS provides the Australian Producer and International Trade Price Indexes to a range of international agencies, including the International Monetary Fund and the Organisation for Economic Co-operation and Development to enable economic monitoring and international comparisons.
The provision of the Producer and International Trade Price Indexes to the International Monetary Fund also fulfils Australia’s obligations as part of the International Monetary Fund’s Dissemination Standards Bulletin Board. The IMF Dissemination Standards Bulletin Board set out criteria concerning the statistics to be produced, their periodicity, release procedures etc. A brief overview of these standards can be found on the IMF Dissemination Standards Bulletin Board.
The International Monetary Fund - Special Data Dissemination Standard contains the main economic and financial statistics produced by the ABS and other agencies, such as the Reserve Bank of Australia.
The Organisation for Economic Co-operation and Development publishes an array of economic and financial statistics produced by the ABS in comparison to the member countries of the organisation, and also the Purchasing Power Parity statistics, which the Producer and International Trade Price Indexes are incorporated within.
Biases in Price Indexes
A price index may be described as biased if it produces estimates that depart consistently from the 'true' measure as a ‘pure price index’. There are several methodological and practical issues that may give rise to a biased price index and these forms of bias are outlined below, together with the review and maintenance strategy employed in such situations.
Elementary Index Bias
Elementary index bias (or within elementary aggregate (EA) bias) results when the formulae used to compile index numbers at the elementary aggregate level does not allow index movements to appropriately reflect substitution behaviour.
For example, consider an illustrative model for the an output price index, where producers have fixed inputs. Under this model, it is assumed producers aim to sell more high-priced products as opposed to lower-priced products. This behaviour is revenue maximising (and for fixed inputs revenue maximising is profit maximising, an expected behaviour of producers). A fixed basket price index measuring price changes for this economic model would exhibit bias. This bias arises because the quantities in the basket are fixed, but the behaviour exhibited in the marketplace has producers selling more of the relatively more expensive products - that is, quantities change. The failure of the price index to account for this shift is the extent to which the index is biased.
For an input price index example, consider an illustrative model where producers have fixed outputs. Under this model, it is assumed producers aim to purchase more low-priced intermediate inputs as opposed to higher-priced products. This behaviour is cost minimising (and for fixed outputs, cost minimising is profit maximising, an expected behaviour of producers). A fixed basket price index measuring price changes for this economic model would exhibit bias. This bias arises because the quantities in the basket are fixed, but the behaviour exhibited in the marketplace has producers purchasing more of the relatively more of the cheaper products - that is, quantities change. The failure of the price index to account for this shift is the extent to which the index is biased.
There are two strategies that can be adopted to further protect these price indexes from elementary aggregate bias. The first of these strategies is to frequently update the weights in the basket (assuming we are using the Lowe price index, with differentially weighted specifications). This can be achieved through regular sample maintenance.
The second strategy that can be employed is to adopt a different price index formula that better reflects such behaviour. The Jevons, or geometric mean, price index is a formula that is unbiased if the price behaviour is¹, a condition which is not universally applicable for every product.
"Between Component" substitution bias
Substitution bias arises from using formulae at levels above the elementary aggregates which do not allow for substitution in response to changes in relative prices. Substitution may occur outside elementary aggregates in response to price changes or changes in taste. For example, producers may substitute between natural and synthetic fibres, between steel and ceramic parts for machinery, between wooden and aluminium window frames and so forth. This substitution again results in a quantity shift, and the failure of a fixed basket price index to account for this shift is again the extent to which the index is biased.
The sample and index review processes described above result in new components and updated weights and are the key mechanism by which the ABS mitigates between component substitution bias. Industry reports, media and other information sources collected by index managers provides an annual picture of change across all products in the Producer and International Trade Price Indexes, and an assessment of this change allows resources to be targeted to those areas that are most susceptible to this type of bias.
Outlet/Customer biases
Outlet/Customer biases occur because the transactions in the elementary aggregates are generally fixed to specific suppliers and/or specific customers. In an input price index, bias occurs when the price index does not detect when purchasers shift from higher cost suppliers to lower cost suppliers for the same product. In an output price index, bias arises when the index does not detect when producers practise price discrimination and shift the sales from customers with lower prices to customers who pay higher prices for the same product.
The bias that arises due to change in supplier or customer is mitigated in several ways in the Producer and International Trade Price Indexes. For the Input to the Manufacturing Industries Producer Price Index, prices are generally observed by surveying the purchaser. If the purchaser changes supplier (and pays a lower price) then this is detected in the quarterly Survey of Producer Prices and, after being adjusted for any appropriate quality changes, appears as a movement in the price index. Similarly, for the output price indexes, prices are generally observed by surveying the producer, and any price rises resulting from changes to new customers will similarly appear in the price indexes. Much but not all of the risk of bias is mitigated by this approach to sample selection.
There are two situations where potential biases can arise.
The first is in the Input to House Construction Producer Price Index. This input price index measures prices paid by builders by surveying the businesses supplying the products rather than the builders themselves. This practise is far more practical and efficient than attempting to survey a sample of individual builders. However, one drawback to this approach is that this price index becomes susceptible to outlet (supplier) substitution bias. For example, if builders begin purchasing from a chain wholesaler outside the sample that offers materials at substantial discount, the price index would exhibit an upward bias.
The second case where biases arise is where counterpart pricing is utilised. Counterpart pricing is a term used to reflect using a transaction price observed on a pricing basis that differs from the conceptual base of the price index. For example, within the manufacturing price indexes, some suppliers provide the prices they receive for their products and these are included in the input price index. Aside from the appropriateness of the underlying assumptions regarding distributive trade margins, this practise also has the potential to introduce outlet substitution bias, since it does not always detect when purchasers change their point of supply (at lower prices). A similar issue arises when purchasers provide prices for incorporation into an output index (although in this case the bias is more suitably termed ‘customer substitution’).
Regardless of where such practises occur, the potential for bias is mitigated through index reviews and sample maintenance reviews. As detailed above, such reviews measure expenditure and revenue for different products and involve consultation, both with industry bodies and producers themselves. Regular activity of this kind detects changes in sales or purchasing markets and allows price indexes to be updated to reflect the shift in the quantities and revenue/expenditure.
Quality adjustment bias
Failure to adequately adjust prices to account for changes to quality results in volume changes being inappropriately measured as price changes, with a resulting bias in the price index. Pricing to constant quality, and the mechanisms by which quality adjustments are made, are described in detail in the Quality change section.
With a set of tools to enable quality adjustments to be made, the remaining risk for quality adjustment bias occurs through failing to detect changes in products or conditions of sale. This risk is mitigated through forms design of the Survey of Producer Prices, and through the initial enrolment process for selected providers. As described above, a key feature of the enrolment process is to convince selected providers of the importance of pricing to constant quality. Capturing the detailed specification of products together with their condition of sale is also protection against quality change since it allows providers to inform the ABS directly of variations in characteristics.
New product bias
The issues surrounding new products were discussed in the Quality change section, which noted that the bias arising from the introduction of new products is exacerbated through delays in introducing such products into the price basket. Sample reviews and index reviews provide opportunities to incorporate new products into the price baskets. If such reviews are carried out regularly, the risk from the emergence of new products is substantially mitigated. Sample reviews and index reviews provide further protection against new product bias in that they allow an assessment of market trends and conditions.
Footnotes
Maintaining Relevance
It is not possible to construct an index which includes every transaction of every product and so the ABS selects representative products and transactions and determines their relative importance in calculating overall price movements. The Producer and International Trade Price Index product selections and their weights are fixed over time; however, they cannot remain fixed indefinitely. Periodic updates to both the sample and weights are required to maintain relevance of the Producer and International Trade Price Indexes, especially given the nature of producers to change their products, inputs, customers and condition of sale, or disappear (or enter) the marketplace. Maintenance and review programs are required to ensure that price indexes continue to be representative.
Maintenance is an on-going activity which targets the price sample within each elementary aggregate and is undertaken in response to changes identified through regular analysis and interactions with providers. Periodic reviews look beyond individual price samples to a wide ranging assessment of structure, weights and methods and are initiated by the ABS to reflect new or emerging challenges across the economy.
Review strategies are described in relation to the structure of the index, as illustrated in Figure 4.13. Index reviews target the levels of the index at and above the published (or regimen) level. These are undertaken during an update to the weight reference period. Sample reviews assess the components below the regimen level and sample maintenance is concerned with the price sample within each elementary aggregate.
FIGURE 4.13 AGGREGATION STRUCTURE AND REVIEW STRATEGIES
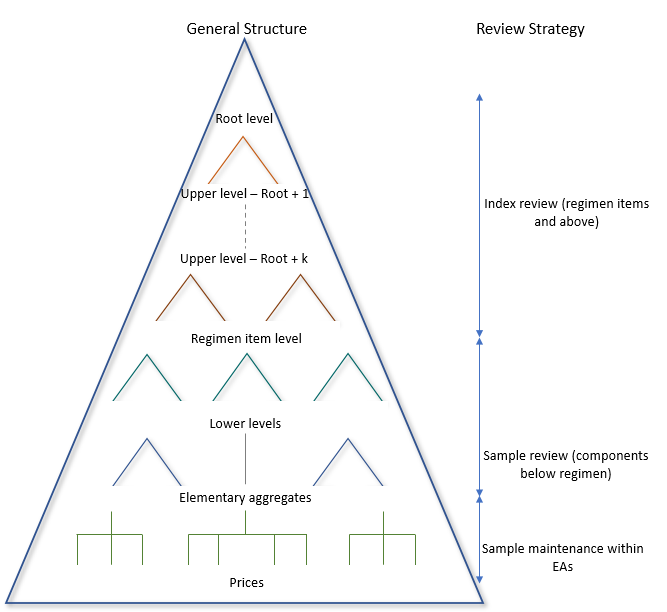
Review strategies are described in relation to the structure of the index, illustrated in Figure 4.13. Index reviews target the levels of the index at and above the published (or regimen) level. These are undertaken during an update to the weight reference period. Sample reviews assess the components below the regimen level and sample maintenance is concerned with the price sample within each elementary aggregate.
Index Reviews
The division of the price index according to the regimen level is at the centre of the ABS strategy for reviewing and maintaining price samples. The structure and weighting data remain fixed for the price index at the regimen level and above, until such time as a process known as an index review is undertaken.
The outcome of an index review is a change to the representative industries and products, their relative importance as reflected by their value aggregates, and the way the industries and products relate to each other through classifications and the aggregation structure. Such a review is undertaken as required, since it can be a costly and complex exercise. Index reviews are typically undertaken when new weighting data become available, and when such data indicate significant shifts in patterns of revenue or expenditure. Changes to standard classifications can also trigger the need for a review, although such a review still depends upon the availability of value data categorised under the new classification.
An index review enables the assessment of the scope and coverage of the index. Index reviews also allow the evaluation and implementation of major changes in concept, and the adoption of methodological advances or changes to international best practice.
Although index reviews are the only activity that changes the weight or structure of an index down to regimen level, they are frequently undertaken simultaneously with sample reviews.
The last major index review of the Producer and International Trade Price Indexes occurred in 2011-12, and detailed information on the review and its implementation can be sourced through the following links:
Sample Reviews
A sample review examines a single index structure below the regimen level. Such a review can introduce new components, change index structures, split or combine price samples, and incorporate new weights for lower level components. Any new value aggregate data introduced must still sum to the value aggregate at the regimen level.
The key benefit of the sample review strategy is that it can be carried out in isolation from other parts of the price indexes. Classification, value data and market behaviour need to be determined for only the
branch of the index being reviewed.
For example, a review of the structure of Australian and New Zealand Standard Industry Classification (ANZSIC) Class 1132 Ice cream manufacturing, a regimen level index, can be undertaken without simultaneously reviewing other ANZSIC Class level indexes or other components of the Output of the Manufacturing Industries Producer Price Index. This means that sample reviews can be done selectively and more often, for more products across more price indexes, when compared to the scale and frequency of an index review.
The sample review strategy allows reviewing resources to be targeted at those industries of the economy that are undergoing rapid transformation, in terms of what is being produced, how it is being produced, and how it is being sold. This allows indexes to be updated to adequately represent new products, shifts in market share, changes in production function, product substitution, and changes in both customer types and suppliers.
Sample reviews also allow periodic reassessment of industry pricing mechanisms - the manner in which producers charge for their products - so that the pricing methods detailed in product specifications adequately capture the behaviour in the marketplace. Sample reviews also allow assessment of different pricing methods to reflect emerging international best practise, or to adopt consistently new techniques to price to constant quality.
The sample review process involves:
- an assessment and evaluation of issues effecting a price index
- gathering of information such as international best practice and feedback from users
- consultation with regulators, industry bodies and providers
- identification of sources for weight and price data
- evaluation of potential approaches to price measurement, index and sample design.
Sample reviews are prioritised by taking into consideration available resources, the relevance of the index and the importance of the index both in terms of its weight within Producer and International Trade Price Index structures and their use as a deflator within the Australian National Accounts and Balance of Payments.
Sample reviews make a broad level assessment of specifications in a sample, however the sample review activity itself does not change specifications within an elementary aggregate - this will done in the process of sample maintenance, an activity which is often undertaken simultaneously with sample review.
Sample Maintenance
Updating specifications, adding different products, removing transactions that are no longer representative, changing providers or changing the micro-index weights are all part of the within-elementary aggregate activity known as sample maintenance.
Regular updating of micro-index weights is necessary, for example, to reflect changing market share or capture substitution behaviour (producers selling more of their relatively more expensive products). Specifications need to change due to a change in the conditions of sale or the product description (such changes also necessitate a quality adjustment).
Sample maintenance is undertaken in conjunction with a sample review, however it is usually an activity that is undertaken on a continuous basis, mostly as data are received from providers selected in the Survey of Producer Prices. Such activity changes the contents of the smallest price baskets that contribute to the Producer and International Trade Price Indexes. Although sample maintenance can change the weights of specifications within an elementary aggregate, it does not change the value aggregate associated with an elementary aggregate.
Maintaining Relevance in the International Trade Price Indexes
For the ITPIs, new products are identified through the analysis of data from International Merchandise Trade Statistics. These data are particularly useful since they not only highlight the emergence of new products but also the value of sales and purchases, indicating the importance of any new product
Product selections and their weights are revised annually based on trade data sourced from International Trade in Goods and Services, Australia (cat. no. 5368.0). Merchandise trade statistics on an international merchandise trade basis are compiled from information submitted by exporters and importers or their agents to the Department of Home Affairs.
Publication Release
Core Release Information
The Producer Price Indexes, and International Trade Price Indexes statistics are published via the ABS website. The website provides the following information free of charge:
the main findings from the statistical releases
- all publication tables in the publications, downloadable in Microsoft Excel format
- a range of additional tables containing all available PPIs and ITPIs downloadable in Microsoft Excel format.
The Producer and International Trade Price Indexes are released on a quarterly basis to coincide with the compilation of Australian National Accounts and the Balance of Payments.
The publication quarters are:
- Three months ending March (January, February and March)
- Three months ending June (April, May and June)
- Three months ending September (July, August and September)
- Three months ending December (October, November and December)
The publication is released no later than 33 days after the end of the reference quarter with the International Trade Price Indexes, Australia is released on a Thursday and Producer Price Indexes, Australia is released on a Friday.
Interpreting the Release
This section of the publication provides users with detailed information on how they can interpret the published data outputs within the Producer Price Indexes, and International Trade Price Indexes releases.
Determining Index Numbers and Percentage Change
Movements in indexes from one period to any other period can be expressed either as changes in index points or as percentage changes. The following example illustrates these calculations for an index series between Period 1 (P1) and Period 2 (P2). The same procedure is applicable for any two periods.
| Index numbers | |
|---|---|
| P2 | 101.1 |
| less P1 | 94.7 |
| equals change in index points | 6.4 |
| Percentage change = 6.4 / 94.7 x 100 | 6.8% |
For most applications, movements in price indexes are best calculated and presented in terms of percentage change. Percentage change allows comparisons in movements that are independent of the level of the index. For example, a change of 2 index points when the index number is 120 is equivalent to a change of 1.7%, but if the index number were 80 a change of 2 index points would be equivalent to a change of 2.5% - a significantly different rate of price change. Only when evaluating change from the reference period of the index will the points change be numerically identical to the percentage change.
The percentage change between any two periods must be calculated, as in the example above, by direct reference to the index numbers for the two periods. Adding the individual quarterly percentage changes will not result in the correct measure of longer-term percentage change. That is, the percentage change between, for example, the June quarter one year and the June quarter of the following year will not necessarily equal the sum of the four quarterly percentage changes. The error becomes more noticeable the longer the period covered and the greater the rate of change in the index. This can readily be verified by starting with an index of 100 and increasing it by 10% (multiplying by 1.1) each period. After four periods, the index will equal 146.4 delivering an annual percentage change of 46.4%, not the 40% obtained by adding the four quarterly changes of 10%.
Although the Producer and International Trade Price Indexes are compiled and published as a series of quarterly index numbers, their use is not restricted to the measurement of price change between particular quarters. A quarterly index number can be interpreted as representing the weighted average price during the quarter (relative to the reference period), index numbers for periods spanning more than one quarter can be calculated as the simple (arithmetic) average of the relevant quarterly indexes. For example, an index number for the year 1998 would be calculated as the arithmetic average of the index numbers for the March, June, September and December quarters of 2021.
This characteristic of index numbers is particularly useful. It allows for comparison of average prices in one year (calendar or financial) with those in any other year. It also enables prices in, say, the current quarter to be compared with the average prevailing in some prior year.
Determining Index numbers and points contribution
The quarterly change in a price index represents the weighted average price change of all the product groups included in that index. Publication of index numbers and percentage changes for components of the broad price indexes are useful in their own right. However, these data are often not sufficient to enable important contributors to overall price change to be reliably identified. What is required is some measure that encapsulates both a product group’s price change and its relative importance in the index.
If a broad level index number is thought of as being derived as the weighted average of the indexes for all its component product groups, then the index number for a component multiplied by its weight to the broad level index results in what is called its ‘points contribution’. It follows that the change in a component item’s points contribution from one period to the next provides a direct measure of the contribution to the change in the broad level price index resulting from the change in that component’s price. This relationship only applies if all components have the same reference period and the same link period. Calculation of points contribution is covered in more detail above, whilst reference period and link periods are discussed in the linking and re-referencing section above.
Information on points contribution and points contribution change is of immense value when analysing sources of price change and for answering ‘what if’ type questions. Consider the following data from the Export Price Index publication (see Table 4.15):
| Index numbers | Percent change | Points contribution | Points change | |||
|---|---|---|---|---|---|---|
| Sep qtr | Dec qtr | Sep qtr | Dec qtr | |||
| Total exports | 90.5 | 88.3 | -2.4 | 90.5 | 88.3 | -2.2 |
| Mineral fuels | 91.0 | 84.2 | -7.5 | 25.68 | 23.76 | -1.92 |
Using only the index numbers themselves, the most that can be said is that between the September and December quarters, the price of mineral fuels exports fell by more than the overall Export Price Index (by 7.5% compared with a rise in total exports of 2.4%). The additional information on points contribution and points change can be used to:
- Calculate the effective weight for mineral fuels in the September and December quarters (given by the points contribution for mineral fuels divided by the total exports index). For September, the weight is calculated as 25.68/90.5 x 100 = 28.38% and for December as 23.76/88.3 x 100 = 26.91%. Although the underlying quantities are held fixed, the effective weight in export revenue terms has fallen due to the prices of mineral fuels increasing by less than the prices of all other products in the Export Price Index basket (on average)
- Calculate the percentage change that would have been observed in the Export Price Index if all prices other than those for mineral fuels had remained unchanged (given by the points change for mineral fuels divided by the total exports index number in the previous period). For December quarter this is calculated as 1.92/90.5 x 100 = 2.12%. In other words, a 7.5% fall in mineral fuels export prices in December quarter would have resulted in a fall in the overall Export Price Index of 2.12%
- Calculate the average percentage change in all other items excluding mineral fuels (given by subtracting the points contribution for mineral fuels from the total exports index in both quarters and then calculating the percentage change between the resulting numbers - which represents the points contribution of the ‘other’ products). For the above example, the numbers for total exports excluding mineral fuels are: September, 90.5 - 25.68 = 64.82; December, 88.3 - 23.76 = 64.54; and the percentage change, (64.54 - 64.82)/ 64.82 x100 = -0.43%. In other words, prices of all exports other than mineral fuels fell by 0.43% on average between the September and December quarters.
- Estimate the effect on the Total Exports of a forecast change in the prices of one of the products (given by applying the forecast percentage change to the products points contribution and expressing the result as a percentage of the total exports index number). For example, if prices of mineral fuels were forecast to rise by 25% in March quarter 2022, then the points change for mineral fuels would be 23.76 x 0.25 = 5.94, which would deliver a rise in the total exports index of 5.94/88.3 x 100 = 6.7%. In other words, a 25% rise in mineral fuels prices in March quarter 2021 would have the effect of increasing the EPI by 6.7%. Another way commonly used to express this impact is “a 25% rise in the price of mineral fuels would contribute 6.7 percentage points to the change in the total exports EPI”.
Points contribution, re-weighting and link periods
The use of points contribution as an analytical tool is limited to comparison of those index numbers on the same weighting reference period. If a price index is rebased (and its weighting basis changed), it will not be possible to compare points contribution data on the old weighting basis with data from the new weighting basis. This means it is not possible to undertake points contribution analyses across a link period. Linking of price indexes is discussed in detail in the linking and re-referencing section above.
This limitation has particular impact on the International Trade Price Indexes, since these price indexes are re-weighted every year (with June quarter as the link period). This means that points contribution analyses cannot be undertaken, for example, in comparing price indexes from September quarter with price indexes from March quarter of the same calendar year. Such an analysis would bridge the June quarter link period and is therefore not possible.
Quarterly and annual data
Price index figures are published on a quarterly, annually and a financial year basis. The index number for a financial year is the simple arithmetic average (mean) of the index numbers for the 4 quarters of that year. Index numbers for calendar years are not calculated by the ABS but can be derived by calculating the simple arithmetic average of the quarterly index numbers for the year concerned.
Precision and rounding
To ensure consistency in the application of data produced from the price indexes, it is necessary for the ABS to adopt a set of consistent rounding conventions or rules for the calculation and presentation of data. These conventions strike a balance between maximising the usefulness of the data for analytical purposes and retaining a sense of the underlying precision of the estimates. These conventions need to be considered when using price index data for analytical or other special purposes.
Index numbers are always published to a reference of 100.0. Index numbers and percentage changes are always published to one decimal place, with the percentage changes being calculated from the rounded index numbers. Points contributions are published to two decimal places, with points contributions change being calculated from the rounded points contributions. Index numbers for periods longer than a single quarter (e.g. for financial years) are calculated as the simple arithmetic average of the relevant rounded quarterly index numbers. Percentage changes between these periods are calculated from the rounded average index numbers.
The suite of price indexes
The Producer and International Trade Price Indexes are part of a broader system of price statistics produced by the ABS that apply to different aspects of the economy.
The suite of price indexes currently released by the ABS are:
Below is a summary of the other suite of price statistics compiled by the ABS. They provide an integrated and consistent view of price developments pertaining to production, consumption, and international transactions of products within the Australian economy.
Consumer Price Index
The Consumer Price Index measures quarterly changes in the price of a 'basket' of goods and services which account for a high proportion of expenditure by the Consumer Price Index population group (i.e. metropolitan households). This 'basket' covers a wide range of goods and services, arranged in the following eleven groups:
- Food and non-alcoholic beverages
- Alcohol and tobacco
- Clothing and footwear
- Housing
- Furnishings, household equipment and services
- Health
- Transport
- Communication
- Recreation and culture
- Education
- Insurance and financial services.
Capital city indexes used by the Consumer Price Indexes are based on the 2011 Australian Statistical Geography Standard Greater Capital City Statistical Areas. The capital city indexes measure price movements over time in each city individually. They do not measure differences in retail price levels between cities.
The Consumer Price Index is published quarterly in the Consumer Price Indexes, Australia release.
Selected Living Cost Indexes
The Consumer Price Index is deconstructed into various secondary and tertiary indexes known the Selected Living Cost Indexes.
The Selected Living Cost Indexes provides indexes for four individual population subgroups:
- Employee households;
- Age pensioner households;
- Other government transfer recipient households; and
- Self-funded retiree households.
Also included are the:
- Pensioner and Beneficiary Living Cost Index which provides an index for age pensioner and other government transfer recipient households whose principal source of income is government benefits; and
- Analytical Living Cost Indexes which provide the impact of price change across different groups of households in the Australian population
The Selected Living Cost Indexes are published quarterly in the Selected Living Cost Indexes, Australia release.
Wage Price Index
The Wage Price Index contains indexes measuring changes in the price of wages and salaries in the Australian labour market.
Individual indexes are compiled for various combinations of state/territory, sector (private/public) and industry division. Industry is classified according to the Australian and New Zealand Standard Industrial Classification. Four Wage Price Indexes are constructed and published quarterly and cover:
- ordinary time hourly rates of pay excluding bonuses index
- ordinary time hourly rates of pay including bonuses index
- total hourly rates of pay excluding bonuses index
- total hourly rates of pay including bonuses index.
The Wage Price Index is published quarterly in Wage Price Index, Australia.
Equity of access
The Producer and International Trade Price Indexes statistics are made available simultaneously to everyone via the ABS website. This approach supports the principle of equity of access.
All statistics are subject to an embargo until 11.30 a.m. (Canberra time) on the day of release. No information about the price indexes is publicly available prior to the lifting of the embargo.
Revisions
Revisions are only applied if the effect of the amended or revised data is significant. In the event of a revision the affected data will be highlighted in the publication, with a reason for revision provided in the commentary.
Post-release update
02 February 2024
- References to the Residential Property Price Index, last released in March quarter 2022, have been removed.
- A link to the Monthly Consumer Price Index Indicator added.