Key tourism events in Australia, 2024-25
- Tourism growth was driven by increases in short-term international visitors.
- Domestic tourism growth slowed, with fewer overnight trips, offset by a higher number of day trips.
- Food and beverages, and takeaway and restaurant meals were the products with the highest growth due to the increase in day trips and increasing prices.
- The Accommodation industry drove the increase in jobs. A number of new large-scale hotels opened during 2024-25.
- Domestic airline closures impacted transport jobs.
| 2023-24 ($m) | 2024-25 ($m) | Change (%) | ||
|---|---|---|---|---|
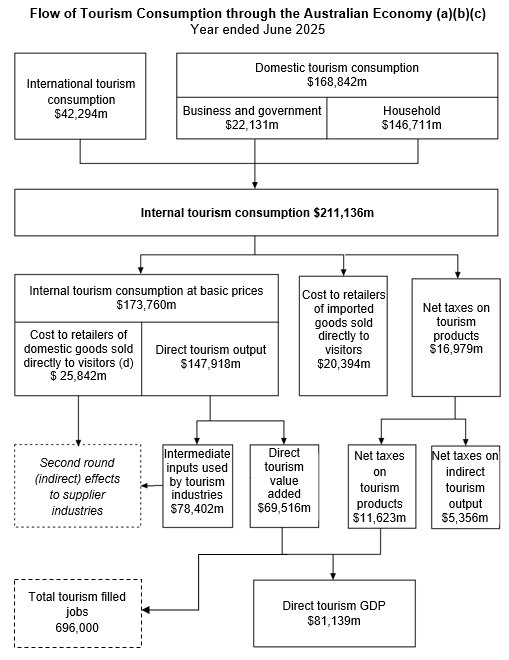
| Gross Domestic Product (GDP) | Current prices | 78,179 | 81,139 | 3.8 |
| Chain volume measures | 78,179 | 78,742 | 0.7 | |
| Gross Value Added (GVA) | Current prices | 66,957 | 69,516 | 3.8 |
| Chain volume measures | 66,957 | 67,468 | 0.8 | |
| Domestic consumption in purchasers' prices | Current prices | 165,693 | 168,842 | 1.9 |
| Chain volume measures | 165,693 | 166,922 | 0.7 | |
| International consumption in purchasers' prices | Current prices | 38,412 | 42,294 | 10.1 |
| Chain volume measures | 38,412 | 41,005 | 6.8 | |
| Filled jobs '000 | 682 | 696 | 2.0 |
(a) As the reference period for chain volume measures is 2023-24, chain volume measures and current prices are identical in 2023-24.