Supermarket spending, October 2020 - Supplementary COVID-19 analysis

Additional data analysis of supermarket and grocery stores spending

Released
4/12/2020

Introduction

To enhance the understanding of the economic impacts of COVID-19, scanner data was used to conduct analysis on supermarkets and grocery stores spending.

The data presented is in original terms, and may differ from the data presented in the Retail publication. This is because scanner data is only collected from large providers and, to enhance this analysis, certain product types sold by supermarkets are excluded. 

Spending by product group

For the purpose of this analysis, supermarket products were split into three categories. Perishable goods contain fresh food items such as fruit, vegetables, meat and dairy. Non-perishable goods contain food items with a long shelf life such as flour, sugar, canned fruit, canned vegetables, canned and dry mix soups, confectionary and long-life milk products. All other products contain non-food items such as cleaning products, medicinal products, toiletries and toilet paper.

Turnover rose for Perishable goods (4.7%), Non-perishable goods (3.3%), and All other products (2.7%) in October 2020 compared to September 2020, in original terms.

Retail turnover for all three categories continue to remain at higher levels when compared to October 2019. Annually, Perishable goods rose 10.3%, Non-perishable goods 10.1%, and All other products 9.3%. The higher levels of revenue reflect a continuation of more food being prepared at home during the pandemic.

Spending by selected product categories

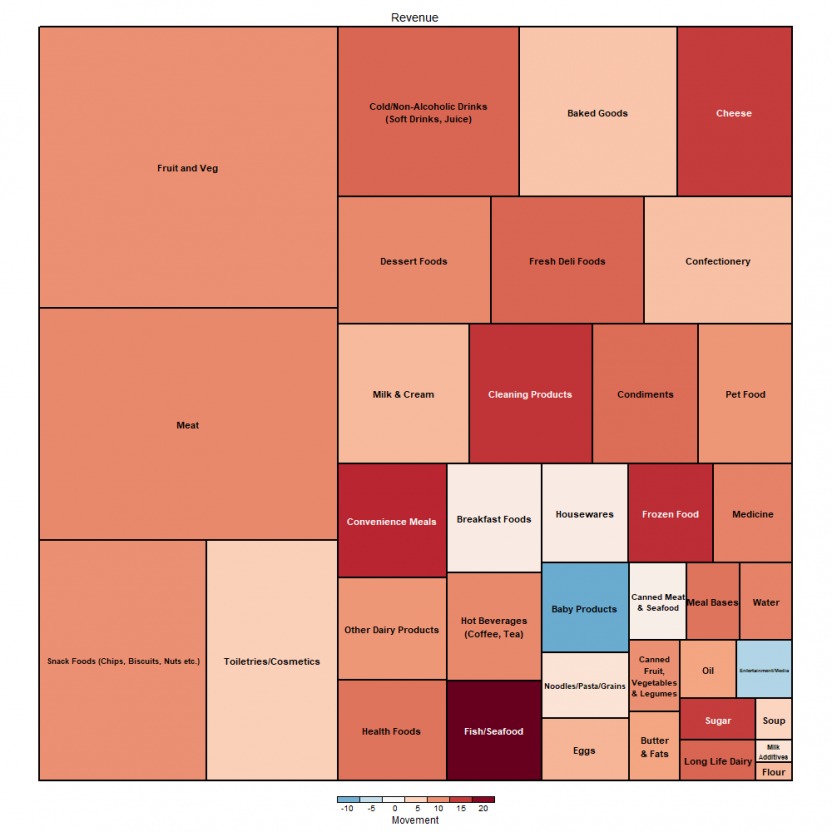
The below tree map describes the annual revenue movements as well as the contribution to total revenue for each product. The colour of each tile denotes the annual revenue percentage movement for October 2020 compared to October 2019, whereas the size denotes the contribution to total revenue in October 2020.

Tree map for annual revenue movement for selected product categories. Data for the map can be found in the following table.

Annual revenue movements and contributions to revenue data

CategoryMovement (%)Contribution to Revenue (%)
Meat10.412.2
Flour7.10.1
Cleaning Products15.73
Fish/Seafood21.41.7
Fresh Deli Foods12.83.4
Hot Beverages (Coffee, Tea)10.31.8
Convenience Meals16.52.2
Frozen Food161.5
Canned Fruit, Vegetables & Legumes100.6
Oil8.80.6
Cheese15.13.5
Long Life Dairy12.80.5
Condiments12.32.6
Meal Bases11.70.7
Dessert Foods10.33.4
Fruit and Veg9.914.8
Butter & Fats8.60.6
Eggs7.71
Medicine11.11.4
Noodles/Pasta/Grains3.41
Health Foods11.91.9
Housewares1.81.5
Cold/Non-Alcoholic Drinks (Soft Drinks, Juice)12.85.4
Other Dairy Products9.52
Sugar15.30.5
Snack Foods (Chips, Biscuits, Nuts etc.)107.1
Milk Additives3.30.1
Water10.90.7
Toiletries/Cosmetics5.55.5
Milk & Cream6.93.2
Pet Food9.62.3
Canned Meat & Seafood1.40.8
Confectionery6.73.3
Breakfast Foods1.91.8
Baked Goods6.34.7
Soup4.80.3
Entertainment/Media-6.20.6
Baby Products-10.41.4

Annual rises were observed for a number of food categories in October 2020. The largest rises included Fresh Fish/Seafood (21.4%), Convenience Meals (16.5%), and Frozen Food (16.0%).

Spending by city, and state and territory

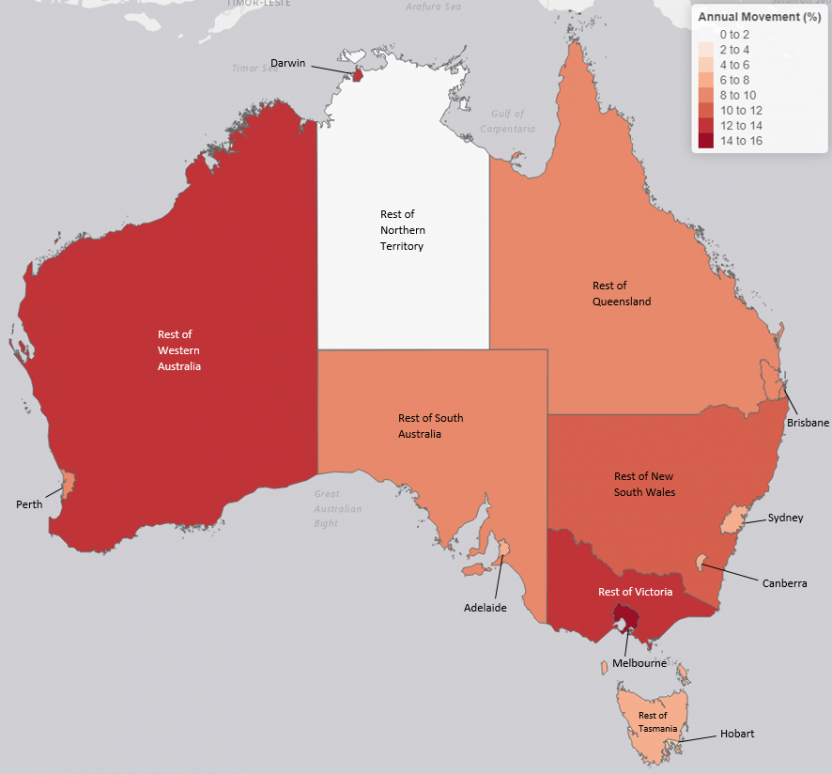
The heat map below denotes the annual revenue movements for each capital city, state and territory, at the Greater Capital City Statistical Area (GCCSA) level, where the colour of each region denotes the annual revenue percentage movement for October 2020 compared to October 2019.

The heat map below denotes the annual revenue movements for each capital city, state and territory, at the Greater Capital City Statistical Area (GCCSA) level.

Annual revenue percentage movements at the capital city, state and territory level are showing increases across Australia. Of the capital cities, Melbourne (15.2%) and Darwin (12.2%) recorded the largest annual rises. For the rest of state/territory areas, Rest of Victoria (12.3%) and Rest of Western Australia (12.3%) recorded the largest annual rises. In Victoria, stronger levels of supermarket spending were recorded in the earlier weeks of the month, and lower levels at the end of the month. Physical distancing restrictions were eased in Victoria from late October, with restaurants and cafes reopening and stay-at-home regulations relaxed. 

Back to top of the page