- Areas with the highest growth in new houses were predominantly located in the outer suburbs of Melbourne and Sydney, such as Cranbourne East in Victoria (8,377 houses completed from the March 2016 quarter to the December 2019 quarter) and Riverstone - Marsden Park in New South Wales (8,034 houses completed).
- Areas with the highest growth in new townhouses were predominantly located in middle suburbs 10-20kms outside of Melbourne and Brisbane, such as Glenroy (987 townhouses completed) and Pascoe Vale (979 townhouses completed) in Victoria.
- Areas with the highest growth in new apartments were predominantly located in the inner suburbs of Melbourne and Sydney, such as Melbourne (8,533 apartments completed) and Waterloo - Beaconsfield (5,950 apartments completed) in New South Wales.
Small Area Dwelling Completions
Experimental estimates of houses, townhouses and apartments completed by Statistical Area Level 2
Key statistics
Highest growth areas - Australia
New houses
The areas with the largest number of new houses were predominantly located in the outer suburbs of Melbourne and Sydney. Exceptions to this were Pimpama on the Gold Coast in Queensland, and Ellenbrook in the outer suburbs of Perth in Western Australia. Five of the top ten SA2s with the highest growth in houses were located in Victoria, three in New South Wales, and one each in Queensland and Western Australia.
The highest number of house completions were recorded in Cranbourne East in Victoria, with 8,377 new houses.
| State | SA2 Code | SA2 Name | Houses completed | Townhouses completed | Apartments completed | Total dwellings completed |
|---|---|---|---|---|---|---|
| VIC | 212,031,301 | Cranbourne East | 8,377 | 643 | 35 | 9,054 |
| NSW | 116,021,312 | Riverstone - Marsden Park | 8,034 | 520 | 706 | 9,261 |
| NSW | 127,011,506 | Cobbitty - Leppington | 7,263 | 669 | 14 | 7,946 |
| NSW | 115,041,302 | Rouse Hill - Beaumont Hills | 4,171 | 264 | 1,129 | 5,564 |
| VIC | 210,051,445 | Mickleham - Yuroke | 4,082 | 16 | 0 | 4,098 |
| QLD | 309,071,257 | Pimpama | 3,937 | 723 | 0 | 4,661 |
| VIC | 213,051,365 | Tarneit | 3,921 | 286 | 12 | 4,219 |
| VIC | 213,051,366 | Truganina | 3,220 | 122 | 41 | 3,384 |
| WA | 504,031,059 | Ellenbrook | 3,162 | 139 | 50 | 3,350 |
| VIC | 212,011,287 | Beaconsfield - Officer | 3,100 | 381 | 0 | 3,481 |
The sum of the components may not equal the total as the totals have been calculated using un-rounded figures.
New townhouses
The areas with the largest number of new townhouses were predominantly located in middle suburbs 10-20kms outside of Australia's capital cities. Four of the top ten SA2s with the highest growth in townhouses were located in Victoria. A further four were located in Queensland, one in New South Wales, and one in the Australian Capital Territory.
The highest number of townhouse completions were recorded in Glenroy, an inner suburb of Melbourne, with 987 new townhouses.
| State | SA2 Code | SA2 Name | Houses completed | Townhouses completed | Apartments completed | Total dwellings completed |
|---|---|---|---|---|---|---|
| VIC | 210,031,438 | Glenroy | 326 | 987 | 106 | 1,419 |
| VIC | 210,031,239 | Pascoe Vale | 309 | 979 | 150 | 1,439 |
| ACT | 801,011,018 | Lawson | 167 | 824 | 48 | 1,039 |
| VIC | 213,031,347 | Braybrook | 199 | 775 | 8 | 982 |
| QLD | 310,011,274 | Inala - Richlands | 147 | 759 | 12 | 918 |
| QLD | 309,071,257 | Pimpama | 3,937 | 723 | 0 | 4,661 |
| QLD | 310,011,273 | Forest Lake - Doolandella | 359 | 716 | 0 | 1,075 |
| VIC | 209,021,207 | Reservoir - East | 282 | 687 | 95 | 1,064 |
| QLD | 314,021,390 | North Lakes - Mango Hill | 1,664 | 671 | 258 | 2,594 |
| NSW | 127,011,506 | Cobbitty - Leppington | 7,263 | 669 | 14 | 7,946 |
The sum of the components may not equal the total as the totals have been calculated using un-rounded figures.
New apartments
The areas with the largest number of new apartments were located in inner city suburbs of Melbourne, Sydney, and Brisbane. Of the top ten SA2s with the highest growth in apartments, four were located in Victoria, four in New South Wales, and two in Queensland.
The highest number of new apartment completions were recorded in Melbourne, with 8,533 new apartments.
| State | SA2 Code | SA2 Name | Houses completed | Townhouses completed | Apartments completed | Total dwellings completed |
|---|---|---|---|---|---|---|
| VIC | 206,041,122 | Melbourne | 2 | 0 | 8,533 | 8,535 |
| NSW | 117,031,338 | Waterloo - Beaconsfield | 27 | 81 | 5,950 | 6,058 |
| QLD | 305,031,128 | Newstead - Bowen Hills | 17 | 14 | 5,109 | 5,140 |
| NSW | 125,011,473 | Homebush Bay - Silverwater | 3 | 10 | 5,035 | 5,048 |
| QLD | 305,011,110 | South Brisbane | 2 | 0 | 4,337 | 4,339 |
| NSW | 117,011,322 | Mascot - Eastlakes | 92 | 25 | 4,278 | 4,395 |
| VIC | 206,041,123 | North Melbourne | 22 | 61 | 3,690 | 3,773 |
| VIC | 206,041,118 | Docklands | 8 | 0 | 3,451 | 3,459 |
| NSW | 119,041,375 | Arncliffe - Bardwell Valley | 63 | 26 | 3,278 | 3,367 |
| VIC | 206,041,126 | Southbank | 1 | 12 | 3,068 | 3,081 |
The sum of the components may not equal the total as the totals have been calculated using un-rounded figures.
Highest growth areas - states and territories
New South Wales
The three SA2s with the highest levels of growth in houses and townhouses are were all located in the outer suburbs of Sydney. Cobbitty - Leppington is represented in the three highest-growth SA2s for both houses and townhouses. In contrast, the top three SA2s with the highest growth in apartments were inner-city suburbs of Sydney.
| SA2 Code | SA2 Name | Houses completed | Townhouses completed | Apartments completed | Total dwellings completed |
|---|---|---|---|---|---|
| Highest number of houses | |||||
| 116021312 | Riverstone - Marsden Park | 8,034 | 520 | 706 | 9,261 |
| 127011506 | Cobbitty - Leppington | 7,263 | 669 | 14 | 7,946 |
| 115041302 | Rouse Hill - Beaumont Hills | 4,171 | 264 | 1,129 | 5,564 |
| Highest number of townhouses | |||||
| 127011506 | Cobbitty - Leppington | 7,263 | 669 | 14 | 7,946 |
| 119011359 | Panania - Milperra - Picnic Point | 221 | 612 | 61 | 894 |
| 123021440 | Ingleburn - Denham Court | 2,178 | 560 | 55 | 2,793 |
| Highest number of apartments | |||||
| 117031338 | Waterloo - Beaconsfield | 27 | 81 | 5,950 | 6,058 |
| 125011473 | Homebush Bay - Silverwater | 3 | 10 | 5,035 | 5,048 |
| 117011322 | Mascot - Eastlakes | 92 | 25 | 4,278 | 4,395 |
The sum of the components may not equal the total as the totals have been calculated using un-rounded figures. | |||||
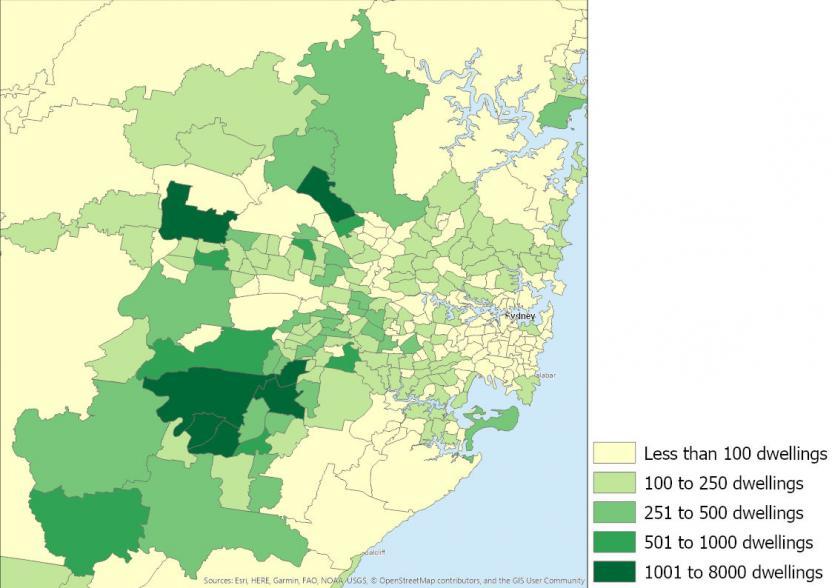
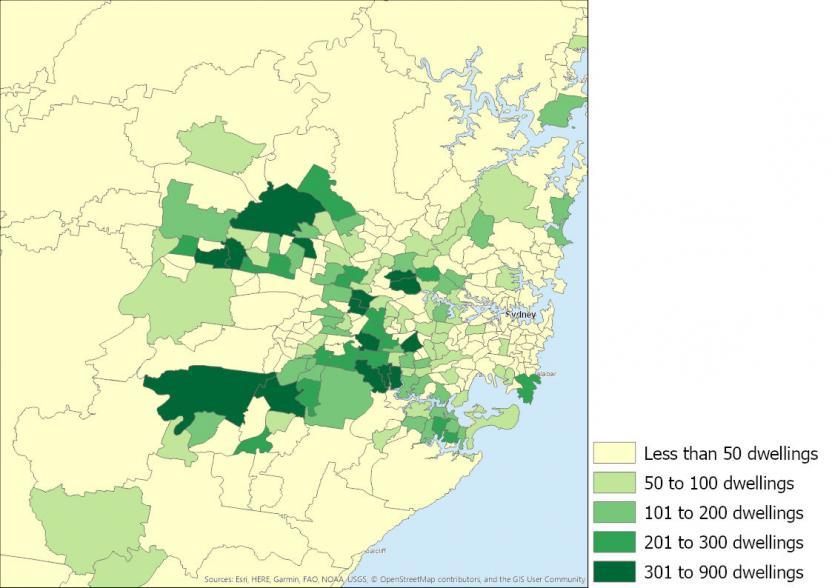
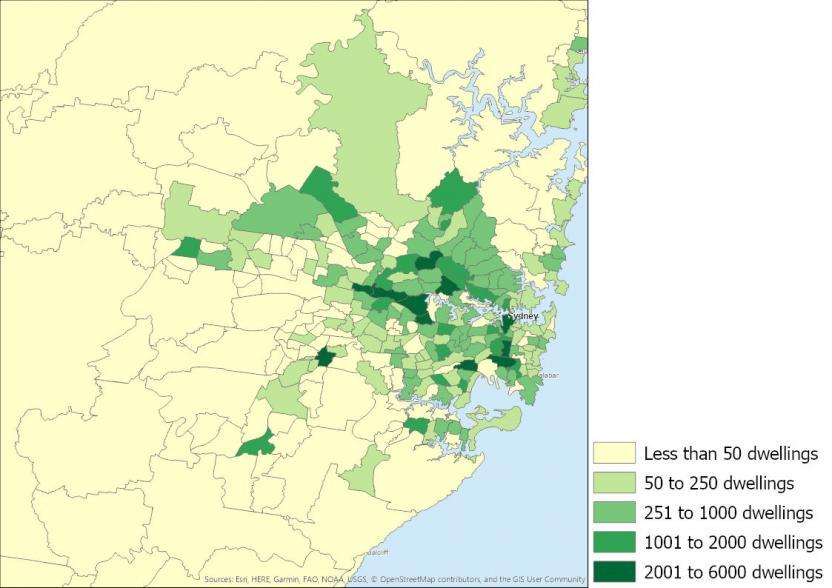
Figures 1-3 demonstrate the distribution of houses, townhouses and apartments completed around Sydney.
Figure 1: Number of houses completed, New South Wales SA2s, 2016 to 2019
Image
Description
Figure 2: Number of townhouses completed, New South Wales SA2s, 2016 to 2019
Image
Description
Figure 3: Number of apartments completed, New South Wales SA2s, 2016 to 2019
Image
Description
Victoria
The top three SA2s with the highest growth in houses were located in the inner and outer suburbs of Melbourne, whilst the highest-growth SA2s for townhouses were all located in the inner suburbs of Melbourne. The three highest-growth SA2s for apartments were all inner city suburbs of Melbourne.
| SA2 Code | SA2 Name | Houses completed | Townhouses completed | Apartments completed | Total dwellings completed |
|---|---|---|---|---|---|
| Highest number of houses | |||||
| 212031301 | Cranbourne East | 8,377 | 643 | 35 | 9,054 |
| 210051445 | Mickleham - Yuroke | 4,082 | 16 | 0 | 4,098 |
| 213051365 | Tarneit | 3,921 | 286 | 12 | 4,219 |
| Highest number of townhouses | |||||
| 210031438 | Glenroy | 326 | 987 | 106 | 1,419 |
| 210031239 | Pascoe Vale | 309 | 979 | 150 | 1,439 |
| 213031347 | Braybrook | 199 | 775 | 8 | 982 |
| Highest number of apartments | |||||
| 206041122 | Melbourne | 2 | 0 | 8,533 | 8,535 |
| 206041123 | North Melbourne | 22 | 61 | 3,690 | 3,773 |
| 206041118 | Docklands | 8 | 0 | 3,451 | 3,459 |
| The sum of the components may not equal the total as the totals have been calculated using un-rounded figures. | |||||
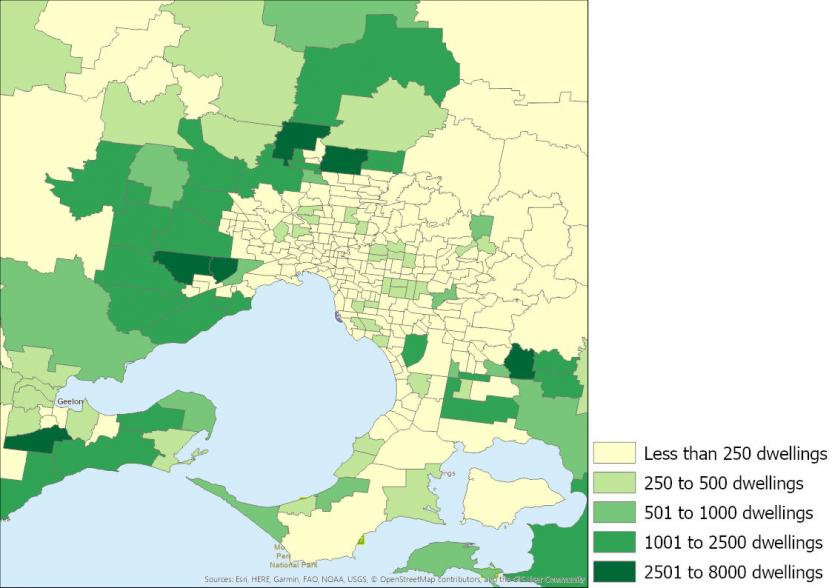
Figures 4-6 demonstrate the distribution of houses, townhouses and apartments completed around Melbourne.
Figure 4: Number of houses completed, Victoria SA2s, 2016 to 2019
Image
Description
Figure 5: Number of townhouses completed, Victoria SA2s, 2016 to 2019
Image
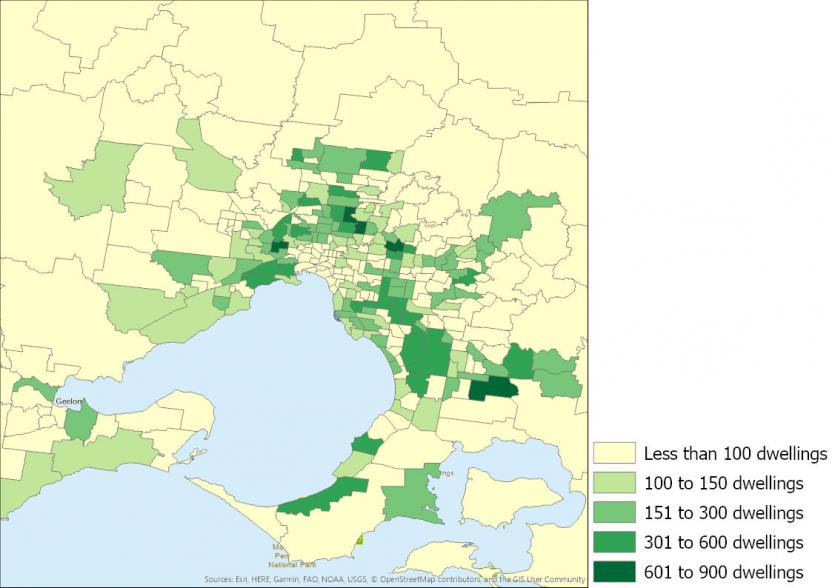
Description
Figure 6: Number of apartments completed, Victoria SA2s, 2016 to 2019
Image
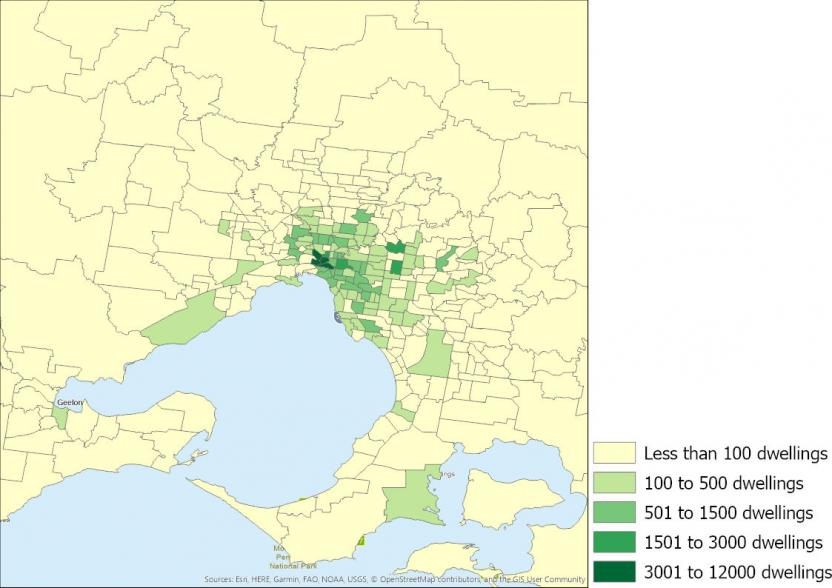
Description
Queensland
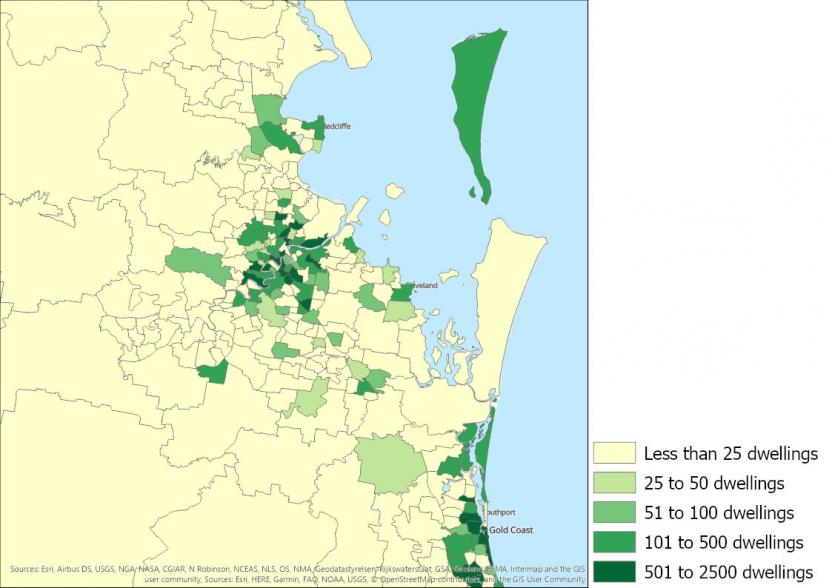
Pimpama on the Gold Coast was the SA2 with the largest growth in houses, whilst the largest growth in townhouses was recorded in Inala-Richlands. The remainder of the top three highest-growth SA2s for houses and townhouses were located in outer suburbs both within and outside of Greater Brisbane. All of the top three highest-growth SA2s for apartments were located in the inner-city suburbs of Brisbane.
| SA2 Code | SA2 Name | Houses completed | Townhouses completed | Apartments completed | Total dwellings completed |
|---|---|---|---|---|---|
| Highest number of houses | |||||
| 309071257 | Pimpama | 3,937 | 723 | 0 | 4,661 |
| 311041321 | Jimboomba | 2,506 | 132 | 3 | 2,641 |
| 316021420 | Caloundra - West | 2,491 | 387 | 1 | 2,880 |
| Highest number of townhouses | |||||
| 310011274 | Inala - Richlands | 147 | 759 | 12 | 918 |
| 309071257 | Pimpama | 3,937 | 723 | 0 | 4,661 |
| 310011273 | Forest Lake - Doolandella | 359 | 716 | 0 | 1,075 |
| Highest number of apartments | |||||
| 305031128 | Newstead - Bowen Hills | 17 | 14 | 5,109 | 5,140 |
| 305011110 | South Brisbane | 2 | 0 | 4,337 | 4,339 |
| 305011112 | West End | 26 | 96 | 2,224 | 2,346 |
| The sum of the components may not equal the total as the totals have been calculated using un-rounded figures. | |||||
Figures 7-9 demonstrate the distribution of houses, townhouses and apartments completed around Brisbane.
Figure 7: Number of houses completed, Queensland SA2s, 2016 to 2019
Image
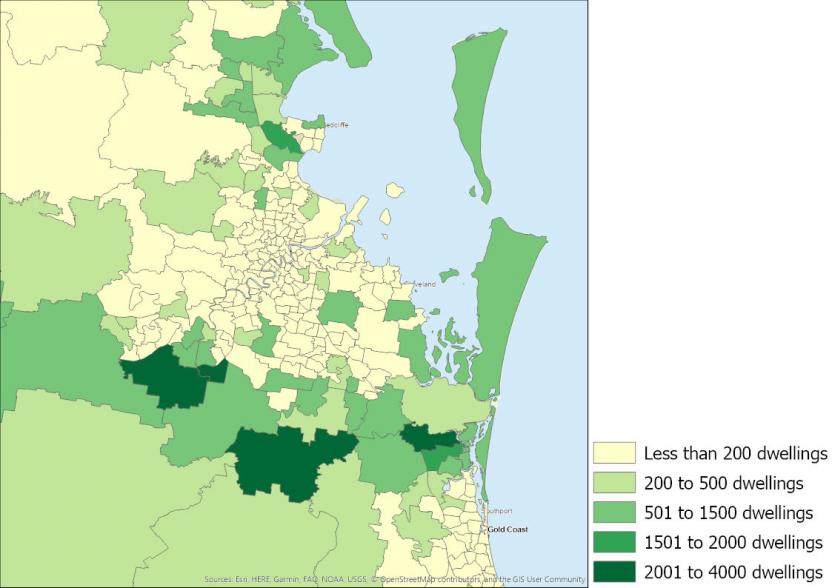
Description
Figure 8: Number of townhouses completed, Queensland SA2s, 2016 to 2019
Image
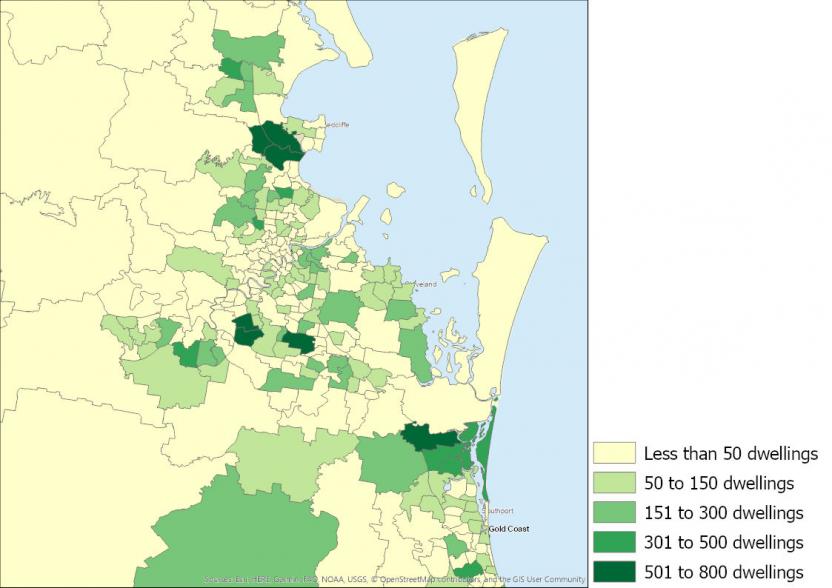
Description
Figure 9: Number of apartments completed, Queensland SA2s, 2016 to 2019
Image
Description
South Australia
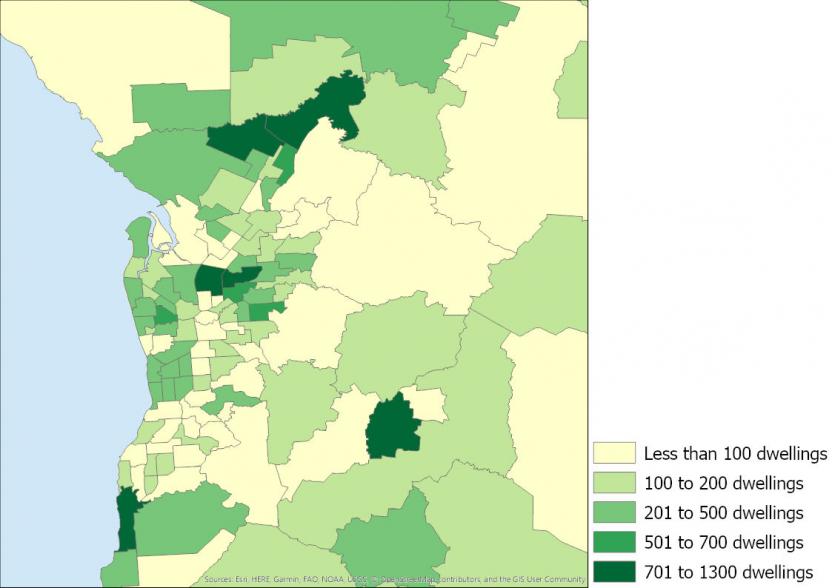
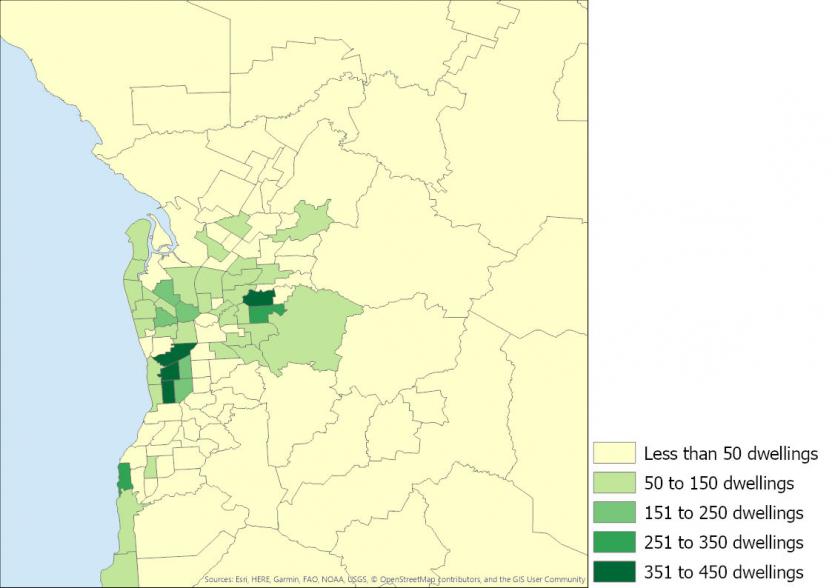
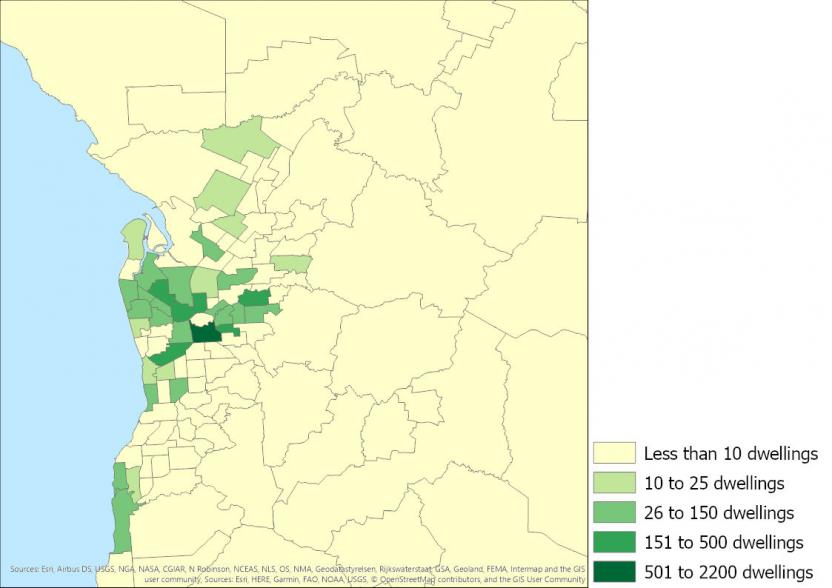
The top three highest-growth SA2s for houses and townhouses were located in the outer and middle ring suburbs of Adelaide. In contrast, the top three highest-growth SA2s for apartments were all inner-city suburbs of Adelaide.
| SA2 Code | SA2 Name | Houses completed | Townhouses completed | Apartments completed | Total dwellings completed |
|---|---|---|---|---|---|
| Highest number of houses | |||||
| 401021007 | Mount Barker | 1,290 | 35 | 4 | 1,328 |
| 402031037 | Northgate - Oakden - Gilles Plains | 1,110 | 143 | 130 | 1,383 |
| 402021032 | Munno Para West - Angle Vale | 941 | 23 | 15 | 979 |
| Highest number of townhouses | |||||
| 401041015 | Paradise - Newton | 428 | 428 | 162 | 1,018 |
| 403021064 | Warradale | 406 | 386 | 7 | 799 |
| 403021062 | Morphettville | 491 | 382 | 14 | 888 |
| Highest number of apartments | |||||
| 401011001 | Adelaide | 8 | 43 | 2,168 | 2,219 |
| 404011093 | Hindmarsh - Brompton | 110 | 151 | 473 | 734 |
| 401051017 | Norwood (SA) | 76 | 31 | 305 | 412 |
| The sum of the components may not equal the total as the totals have been calculated using un-rounded figures. | |||||
Figures 10-12 demonstrate the distribution of houses, townhouses and apartments completed around Adelaide.
Figure 10: Number of houses completed, South Australia SA2s, 2016 to 2019
Image
Description
Figure 11: Number of townhouses completed, South Australia SA2s, 2016 to 2019
Image
Description
Figure 12: Number of apartments completed, South Australia SA2s, 2016 to 2019
Image
Description
Western Australia
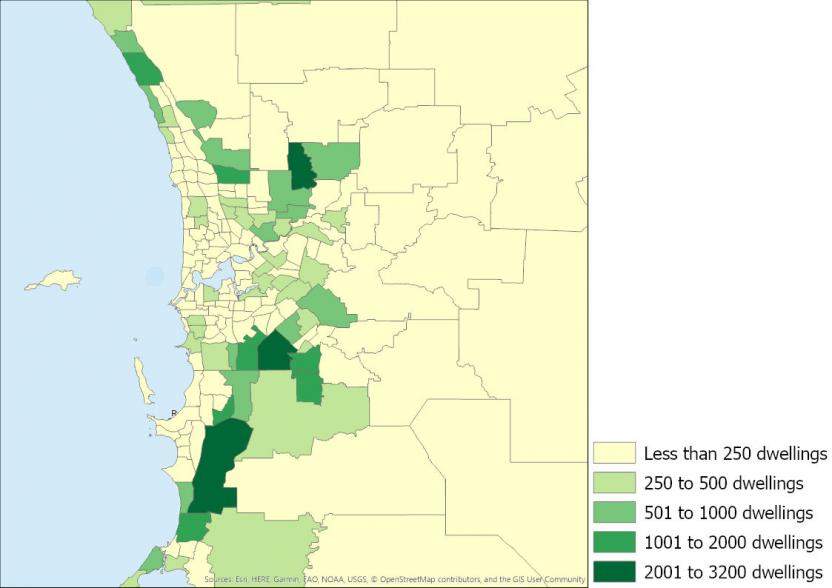
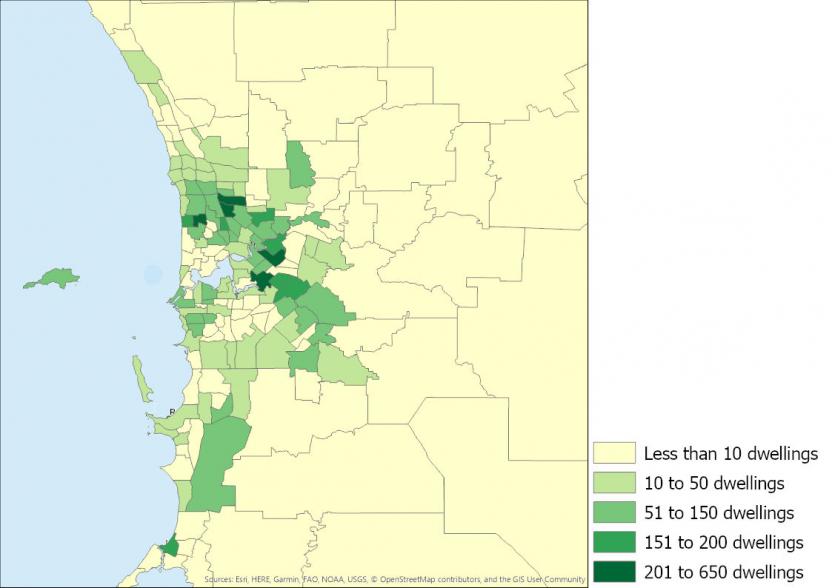
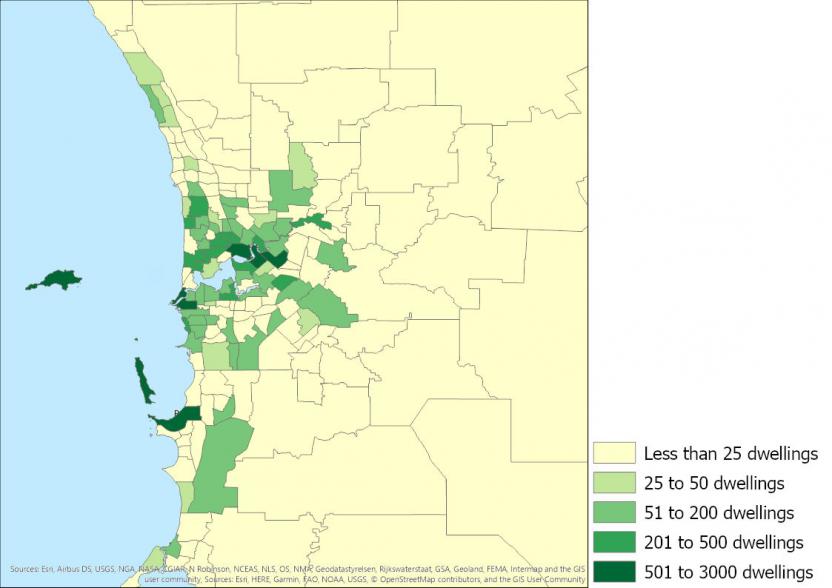
The top three highest-growth SA2s for houses were all located in the outer suburbs of Perth. The highest-growth SA2s for both townhouses and apartments were all located in the inner-city suburbs of Perth. Some overlap can be identified between high-growth SA2s for townhouses and apartments with Rivervale - Kewdale - Cloverdale represented in the top three ranking high-growth SA2s for both dwelling types.
| SA2 Code | SA2 Name | Houses completed | Townhouses completed | Apartments completed | Total dwellings completed |
|---|---|---|---|---|---|
| Highest number of houses | |||||
| 504031059 | Ellenbrook | 3,162 | 139 | 50 | 3,350 |
| 507051185 | Baldivis | 2,386 | 56 | 115 | 2,558 |
| 506011113 | Forrestdale - Harrisdale - Piara Waters | 2,158 | 17 | 9 | 2,184 |
| Highest number of townhouses | |||||
| 505021090 | Nollamara - Westminster | 300 | 600 | 67 | 967 |
| 506021122 | Rivervale - Kewdale - Cloverdale | 334 | 523 | 764 | 1,622 |
| 505021088 | Innaloo - Doubleview | 319 | 360 | 113 | 792 |
| Highest number of apartments | |||||
| 503021041 | Perth City | 54 | 31 | 2,828 | 2,914 |
| 506021122 | Rivervale - Kewdale - Cloverdale | 334 | 523 | 764 | 1,622 |
| 506021123 | Victoria Park - Lathlain - Burswood | 176 | 70 | 631 | 877 |
| The sum of the components may not equal the total as the totals have been calculated using un-rounded figures. | |||||
Figures 13-15 demonstrate the distribution of houses, townhouses and apartments completed around Perth.
Figure 13: Number of houses completed, Western Australia SA2s, 2016 to 2019
Image
Description
Figure 14: Number of townhouses completed, Western Australia SA2s, 2016 to 2019
Image
Description
Figure 15: Number of apartments completed, Western Australia SA2s, 2016 to 2019
Image
Description
Tasmania
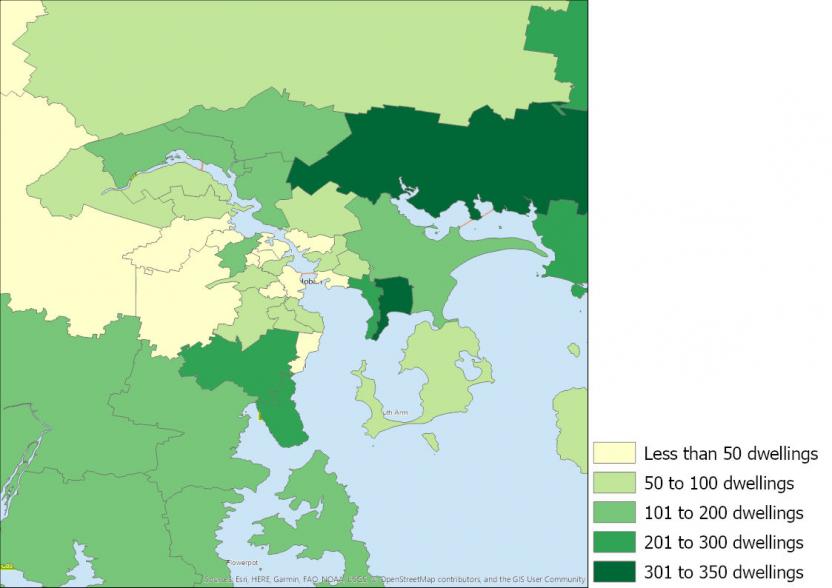
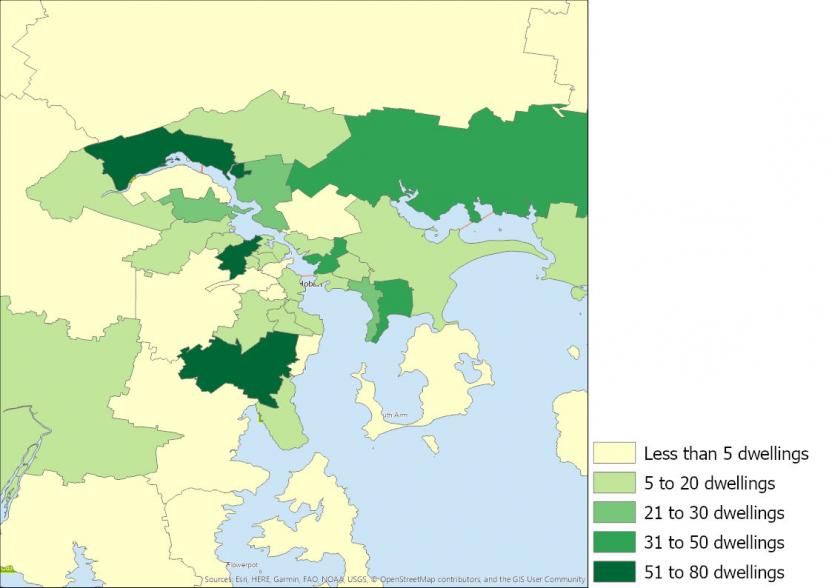
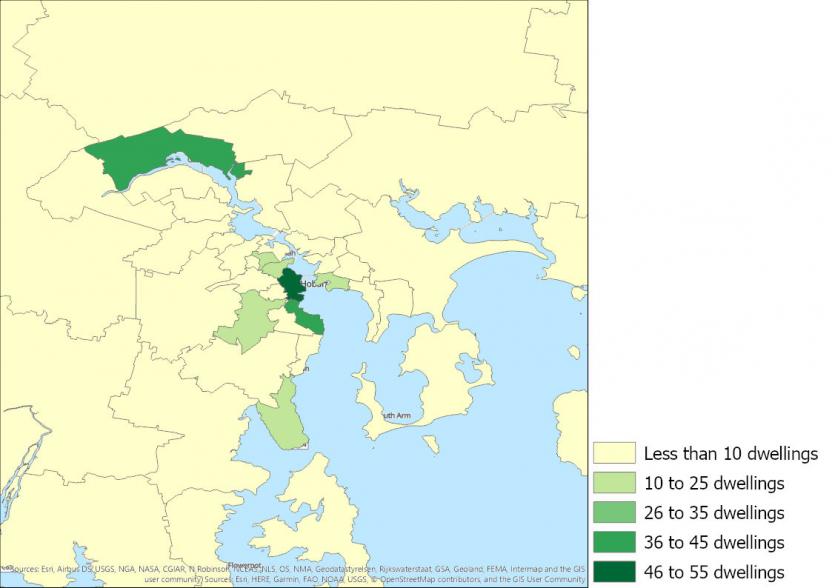
The highest-growth SA2s for both houses and townhouses were located within the outer suburbs of Hobart. Some overlap can be seen between houses and townhouses with Kingston - Huntingfield represented in the top three highest-growth SA2s for both dwelling types. The two highest-growth areas for apartments were located in the inner-city suburbs of Hobart, whilst the third-highest growth area was Bridgewater, an outer suburb which is also represented in the highest-growth SA2s for townhouses.
| SA2 Code | SA2 Name | Houses completed | Townhouses completed | Apartments completed | Total dwellings completed |
|---|---|---|---|---|---|
| Highest number of houses | |||||
| 601061035 | Sorell - Richmond | 340 | 50 | 6 | 395 |
| 601021011 | Rokeby | 316 | 44 | 0 | 360 |
| 601041022 | Kingston - Huntingfield | 136 | 71 | 6 | 372 |
| Highest number of townhouses | |||||
| 601031017 | Glenorchy | 128 | 76 | 0 | 204 |
| 601041022 | Kingston - Huntingfield | 295 | 71 | 6 | 372 |
| 601011001 | Bridgewater - Gagebrook | 136 | 56 | 45 | 237 |
| Highest number of apartments | |||||
| 601051027 | Hobart | 36 | 7 | 52 | 96 |
| 601011001 | Bridgewater - Gagebrook | 136 | 56 | 45 | 237 |
| 601051031 | Sandy Bay | 64 | 11 | 41 | 116 |
| The sum of the components may not equal the total as the totals have been calculated using un-rounded figures. | |||||
Figures 16-18 demonstrate the distribution of houses, townhouses and apartments completed around Hobart.
Figure 16: Number of houses completed, Tasmania SA2s, 2016 to 2019
Image
Description
Figure 17: Number of townhouses completed, Tasmania SA2s, 2016 to 2019
Image
Description
Figure 18: Number of apartments completed, Tasmania SA2s, 2016 to 2019
Image
Description
Northern Territory
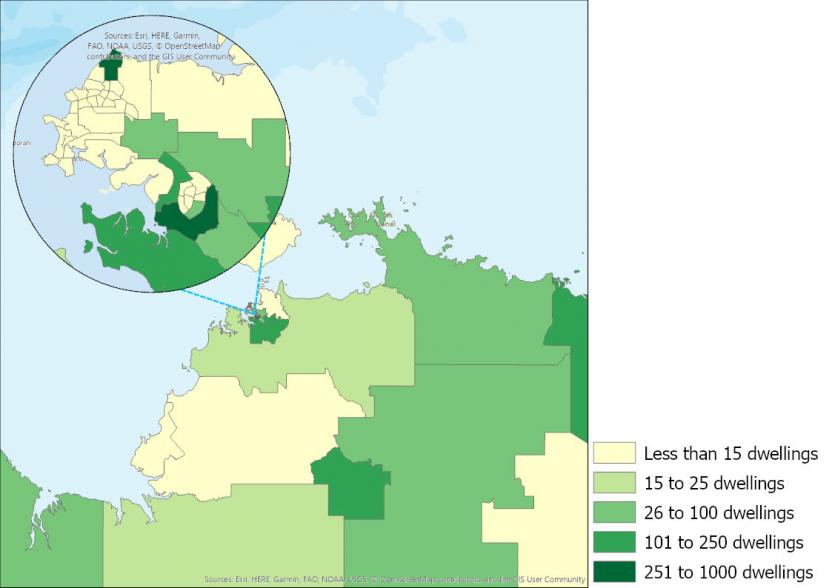
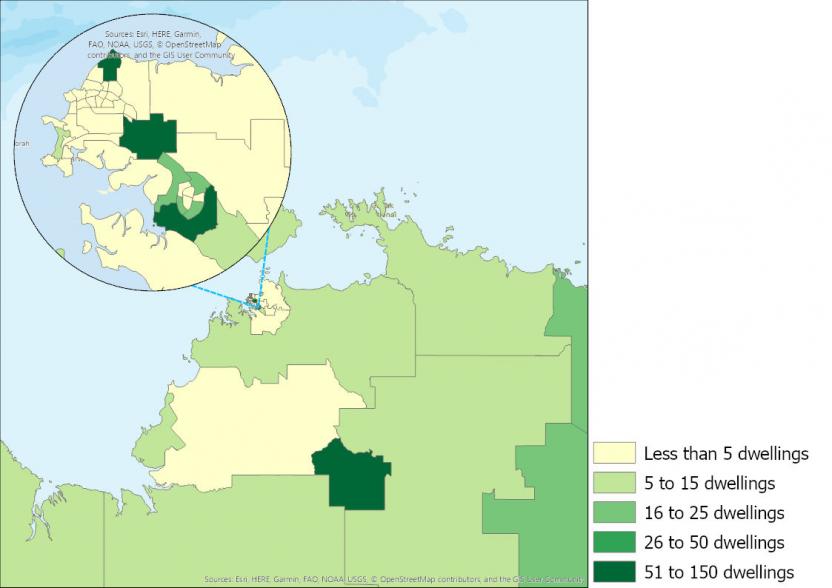
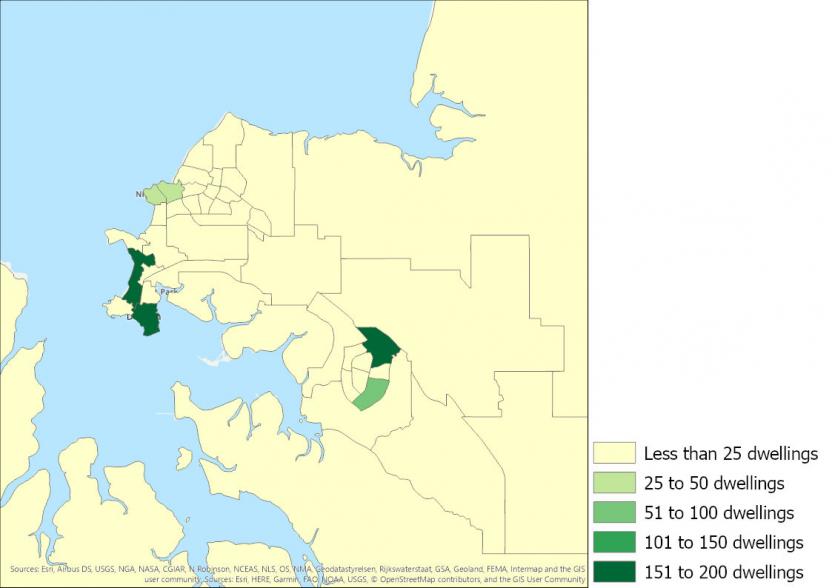
Palmerston-South is the SA2 which recorded the highest number of both house and townhouse completions. The highest-growth SA2 for apartments was Palmerston - North. These SA2s are both located in the inner suburbs of Darwin. One high-growth SA2 shared by houses and townhouses is Katherine in rural Northern Territory. The remainder of highest growth areas for houses, townhouses, and apartments were all located in the inner-city suburbs of Darwin.
| SA2 Code | SA2 Name | Houses completed | Townhouses completed | Apartments completed | Total dwellings completed |
|---|---|---|---|---|---|
| Highest number of houses | |||||
| 701041042 | Palmerston - South | 985 | 139 | 24 | 1,148 |
| 701021021 | Lyons (NT) | 348 | 73 | 2 | 422 |
| 702051067 | Katherine | 153 | 76 | 0 | 229 |
| Highest number of townhouses | |||||
| 701041042 | Palmerston - South | 985 | 139 | 24 | 1,148 |
| 702051067 | Katherine | 153 | 76 | 0 | 229 |
| 701021021 | Lyons (NT) | 348 | 73 | 2 | 422 |
| Highest number of apartments | |||||
| 701041041 | Palmerston - North | 5 | 24 | 187 | 216 |
| 701011004 | Fannie Bay - The Gardens | 5 | 8 | 160 | 173 |
| 701011002 | Darwin City | 0 | 3 | 159 | 162 |
| The sum of the components may not equal the total as the totals have been calculated using un-rounded figures. | |||||
Figures 19-21 demonstrate the distribution of houses, townhouses and apartments completed around Darwin.
Figure 19: Number of houses completed, Northern Territory SA2s, 2016 to 2019
Image
Description
Figure 20: Number of townhouses completed, Northern Territory SA2s, 2016 to 2019
Image
Description
Figure 21: Number of apartments completed, Northern Territory SA2s, 2016 to 2019
Image
Description
Australian Capital Territory
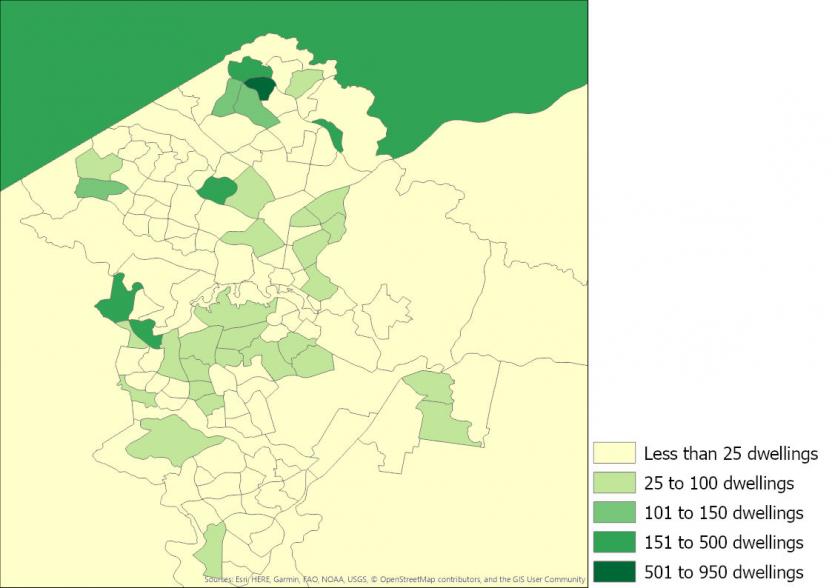
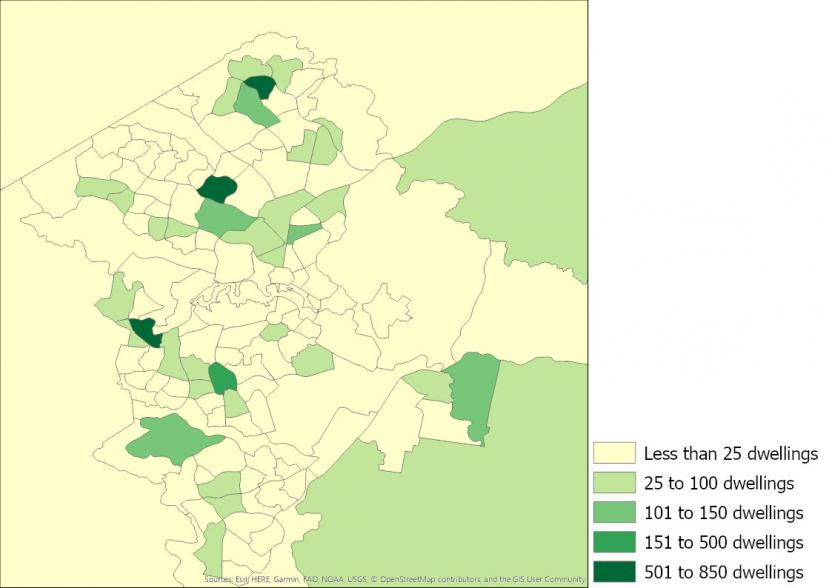
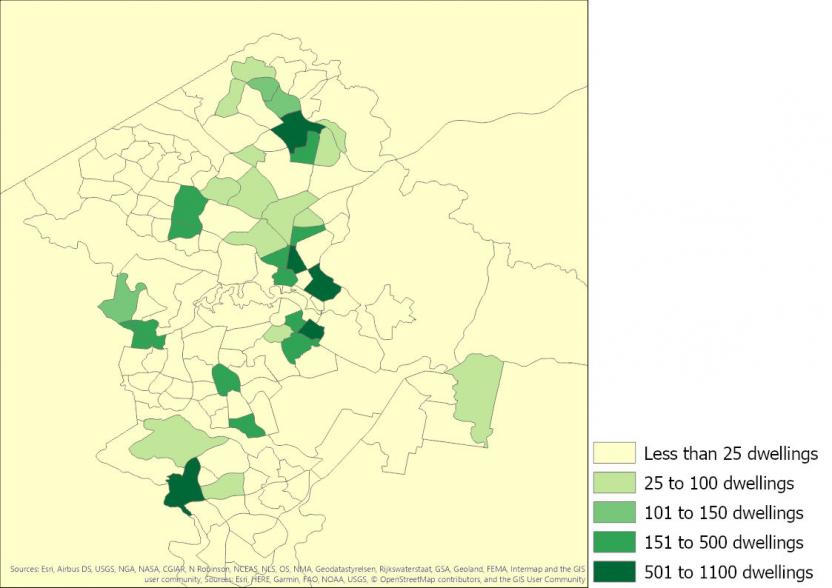
The highest-growth SA2s for houses, townhouses, and apartments in the Australian Capital Territory were all located in the inner suburbs.
| SA2 Code | SA2 Name | Houses completed | Townhouses completed | Apartments completed | Total dwellings completed |
|---|---|---|---|---|---|
| Highest number of houses | |||||
| 801041120 | Moncrieff | 950 | 558 | 125 | 1,633 |
| 801041122 | Throsby | 450 | 77 | 25 | 552 |
| 801101136 | Denman Prospect | 366 | 29 | 128 | 523 |
| Highest number of townhouses | |||||
| 801011018 | Lawson | 167 | 824 | 48 | 1,039 |
| 801101135 | Coombs | 221 | 599 | 343 | 1,163 |
| 801041120 | Moncrieff | 950 | 558 | 125 | 1,633 |
| Highest number of apartments | |||||
| 801051051 | Braddon | 2 | 21 | 1,051 | 1,074 |
| 801041040 | Gungahlin | 8 | 12 | 940 | 960 |
| 801071080 | Greenway | 0 | 21 | 886 | 907 |
| The sum of the components may not equal the total as the totals have been calculated using un-rounded figures. | |||||
Figures 22-24 demonstrate the distribution of houses, townhouses and apartments completed around Canberra.
Figure 22: Number of houses completed, Australian Capital Territory SA2s, 2016 to 2019
Image
Description
Figure 23: Number of townhouses completed, Australian Capital Territory SA2s, 2016 to 2019
Image
Description
Figure 24: Number of apartments completed, Australian Capital Territory SA2s, 2016 to 2019
Image
Description
Methodology
About this release
The Australian Bureau of Statistics (ABS) is working towards the development of quarterly estimates of small area dwelling stock, completions and demolitions for release in 2022. Dwelling stock statistics (the total number of dwellings in a given area at a point in time) are currently available from the Census of Population and Housing every five years. More frequent estimates of dwelling stock are valuable for economic and housing policy development and evaluation, and informing planning and service provision decisions. The newly developed statistics will contain quarterly estimates of demolitions, completions and stock at Local Government Area (LGA) and Statistical Area 2 (SA2) level between June 2016 and June 2021.
Quarterly additions to stock (dwelling completions) are currently available at state level in the ABS publication Building Activity, Australia. To improve the small area information available, this release presents experimental estimates of dwellings completed by SA2 from the March 2016 quarter to the December 2019 quarter.
Removals from stock are currently a key data gap. To reduce this gap, ABS has released preliminary data on the number of dwellings approved for demolition (please see Small Area Demolition Approvals).
The ABS is interested in receiving feedback from users on the suitability of this experimental data and the potential for producing ongoing quarterly estimates beyond 2022. If you have any feedback, please email construction@abs.gov.au.
Scope and coverage
Dwelling approvals have been sourced from the Building Approvals (BAPS) collection. BAPS is a monthly administrative collection that compiles statistics of building work approved from:
- permits issued by local government authorities and other certifying authorities;
- contracts and work authorised by commonwealth, state and local government authorities; and
- major building approvals in areas not subject to normal administrative approval, such as building on remote mine sites.
The scope of the BAPS collection includes residential building work valued at $10,000 or more and all non-residential building work valued at $50,000 or more. The statistics compiled from this collection are published monthly in Building Approvals, Australia and are classified to the Australian Statistical Geography Standard (ASGS), 2016 Edition. For further information on the scope and coverage of this collection, see the BAPS methodology.
Dwelling completions have been sourced from the quarterly Building Activity Survey (BACS). BACS is a quarterly sample survey which uses the building approvals collected in BAPS as the selection frame. For building approvals selected in the BACS sample, data is collected quarterly from builders and other individuals engaged in building activity until the building job reaches completion or is abandoned.
As of the September quarter 2010, the survey has consisted of:
- an indirect, modelled component comprising residential building work with approval values from $10,000 to less than $50,000 and non-residential building work with approval values from $50,000 to less than $250,000. The contributions from these building jobs are modelled based on their building approval details.
- a direct collection of all identified building work having approval values of $5,000,000 or more.
- a sample survey, selected from other identified building work.
The statistics compiled from this collection are published quarterly at a state level in Building Activity, Australia. For further information on the scope and coverage of this collection please see the BACS methodology.
The scope of these small area estimates includes new work (creation of buildings which did not previously exist) and alterations and additions (activity carried out on existing buildings, which may result in the creation of a new dwelling) and both private and public sector owned dwellings.
ABS building statistics (building approvals, building activity and the dwelling stock series currently under development) classify buildings according to the Functional Classification of Buildings. This defines a dwelling as a self-contained suite of rooms, including cooking and bathing facilities intended for long-term residential use. Regardless of whether they are self-contained or not, rooms within buildings offering institutional care (e.g. hospitals) or temporary accommodation (e.g. motels, hostels and holiday apartments) are not defined as dwellings. This differs from the definition used by the Census (a structure which is intended to have people live in it, and which is habitable on Census night), which can include non-permanent structures such as caravans, houseboats and tents, as well as communal or transitory accommodation such as cabins, hotels, prisons and hospitals.
Data are presented for the following types of dwellings:
- 'Houses' - defined as detached buildings used for long term residential purposes, consisting of only one dwelling unit and are not a result of alterations or additions to a pre-existing building.
- 'Townhouses' - defined as semi-detached row or terrace houses attached in some structural way to one or more dwellings, with their own private grounds and no separate dwelling above or below.
- 'Apartments' - defined as blocks of dwellings that don't have their own private grounds and usually share a common entrance, foyer or stairwell.
Small area modelling methodology
The current Building Activity Survey (BACS) sample is designed to produce reliable estimates of building activity at a state level. As not all approved building jobs are selected in the BACS sample, building activity information (i.e. date of commencement and completion) is not collected for all jobs. Therefore, auxiliary data needs to be used to model the state level BACS estimates down to a smaller geographical area.
These experimental estimates use SA2 level approvals from the Building Approvals collection to model the state level BACS estimates of dwellings completed down to SA2 level.
Dwellings completed on directly collected building jobs in BACS are allocated to the SA2 that the associated building approval has been classified to. As per the 'scope and coverage' section above, these jobs include:
- those with approval values of $5,000,000 or more
- those with approval values of $50,000 or more that were selected in the BACS sample.
The remainder of the BACS dwelling completion estimates are proportionally allocated down from state level to SA2 level. A number of 'anticipated completions' is calculated for each state and SA2 by taking the approvals that were not selected in the BACS sample and allocating them to the quarter they are anticipated to complete using average times from approval to completion by state, dwelling type and financial year (for more information see Average Dwelling Commencement Times and Average Dwelling Completion Times). The proportion of anticipated completions within each SA2 is then applied to the state level BACS dwelling completion estimates, as follows:
SA2 modelled number of dwellings completed = (SA2 number of anticipated completions / State number of anticipated completions ) * State BACS estimate of dwellings completed
Data quality
Estimates for building activity are based on a sample of approved building jobs and so they are subject to sampling error; that is, they may differ from the figures that would have been obtained if information for all approved jobs for the relevant period had been included in the survey. The estimates may also be subject to non-sampling error, such as inaccuracies that may occur because of inadequacies in the source of building approval information, imperfections in reporting by respondents, and errors made in the coding and processing of data. Details of the sampling error and non-sampling error of the Building Activity estimates are available in the Building Activity Methodology.
The small area modelling method has the following additional limitations:
- The proportional allocation method used is based on 'anticipated completions'. These are calculated using average times taken from approval to completion and therefore will not be accurate for all approvals.
- For some states/territories and dwelling types, the average times taken from approval to completion show high levels of volatility across financial years and variability across jobs. This makes it difficult to allocate approved jobs to an anticipated quarter of completion accurately. The average time data has been Winsorised to reduce the volatility. Options to reduce the variability in the average times are currently being investigated, such as finer output categories.
- The rate of approvals which are abandoned (i.e. do not proceed to completion) are assumed to be uniform within existing BACS output classes by total state, dwelling type and quarter. For further information about abandonment rates in building activity statistics please see Abandonment Rates for New Dwellings.
- The method aims to ensure that the sum of the small area output by state equals the published state level BACS estimates. There are small inconsistencies in some states where the SA2-level dwelling completions do not sum to the state-level estimate. This will be rectified in future releases of the small area estimates. The BACS state-level estimates should continue to be used as the official figure of dwellings completed, rather than the sum of the SA2 figures.
Future work
The ABS is investigating methods to improve this small area model, such as:
- improving average commencement and completion times, for example using finer output categories to reduce variability;
- incorporating additional auxiliary data sources, for example aerial imagery and occupancy certificates issued by building approval authorities; and
- including estimates of error at the small area level.