People who lost a job or were stood down: flows analysis, May 2020

Released
18/06/2020

People impacted by job loss or stood down in May

Between early April and early May, Australia continued to experience unprecedented interventions in the labour market, which included restrictions to slow the spread of COVID-19 and government support packages to mitigate its impact on individuals, households and businesses.

A large number of people had their hours reduced or were stood down in April, as social distancing and other business restrictions came into effect. These conditions continued into May, with social distancing rules impacting work and job search activities, while changes to schooling arrangements may have reduced people’s availability for work, or ability to look for work.

The implementation of the JobKeeper wage subsidy and changes to the JobSeeker program, including changes to the mutual obligations for payment recipients, will also contribute to changes in the labour market activity of people in Australia in May and later months.

Given these unique circumstances, the deterioration in the labour market was largely reflected in falls in hours worked (down by 0.7%), the participation rate (down 0.7 pts to 62.9%), employment (down 227,700) and the employment to population ratio (down 1.1 pts to 58.4%), and less so in an increase in unemployment. The number of unemployed people rose by around 80,000 people to 927,600 (a rise in the unemployment rate of 0.7 pts to 7.1%).

The underemployment rate decreased 0.7 pts to 13.1%, reflecting a reduction in the number of part-time workers who indicated that they would prefer to work more hours.

Had the increase in the number of people who were not in the labour force between April and May (142,000) been a further increase in unemployment (that is, if they had been actively looking for work and been available to work) then the number of unemployed people would have increased to around 1.1 million people (and an unemployment rate of around 8.1%).

Looking at the cumulative change between March and May, had the increase in the number of people who were not in the labour force (623,600) been a further increase in unemployment, then the number of unemployed people would have increased to around 1.55 million people (and an unemployment rate of around 11.3%).

These estimates highlight the sizable impact of developments over the past two months on people working in Australia.
2.3 million people affected by job loss or reduced hours between April and May

A combined group of almost 2.3 million people were affected by either losing their job between April and May, or working reduced hours for economic reasons in May. This was down from 2.7 million people between March and April. This group was much larger than the number of people who gained employment between April and May or worked increased hours in May.

Of the 2.3 million people affected by job loss or reduced hours in May:

  • over 700,000 people were employed in April, but not employed in May; and
  • around 1.55 million people worked either fewer than their usual hours, or no hours at all, for ‘economic reasons’ (that is, they were stood down, there was insufficient work or no work available).

Of the 1.55 million people who worked fewer than their usual hours, or no hours at all, for ‘economic reasons’:

  • over 360,000 did not work at all (considerably fewer than the over 750,000 people in April); and
  • nearly 1.2 million did some work, but worked fewer hours than usual (up from approximately 1 million in April).

Chart 1 shows the number of men and women working fewer than their usual hours, or no hours at all. Following the large increase between March and April, between April and May there was a decrease for both men and women, with a larger fall for women.

Source: 6291.0.55.001 Data Cube EM2a


The number of people who worked fewer hours than usual for ‘non-economic’ reasons, such as sickness or caring, taking paid or unpaid leave, or personal/other reasons, returned to average levels for May (approximately 2.5 million people), after the large increase observed in April.

Left or lost a job

In addition to the people who worked less than their usual hours or no hours as they were stood down, there was insufficient work or no work available, there were also around 180,000 people who worked less than their usual hours as they left or lost a job. These people were classified as employed in May as they indicated that they had an attachment to their job during the reference period. Almost all of these people did not work any hours. This is a reduction from the 370,000 employed people who worked less than their usual hours in April as they left or lost a job.

People moving in and out of employment, unemployment and not in the labour force

The number of people who moved out of employment between April and May (over 700,000) is considerably larger than the average number of people who have left employment each month over the last three years. Interestingly, almost 550,000 people moved into employment between April and May, and almost three-quarters of these people had been not in the labour force.

Almost three-quarters of the people who were employed in April but not in May were either not looking for work or not available for work in May (and hence were not in the labour force, rather than being unemployed). Being jobless is not necessarily the same as being unemployed.

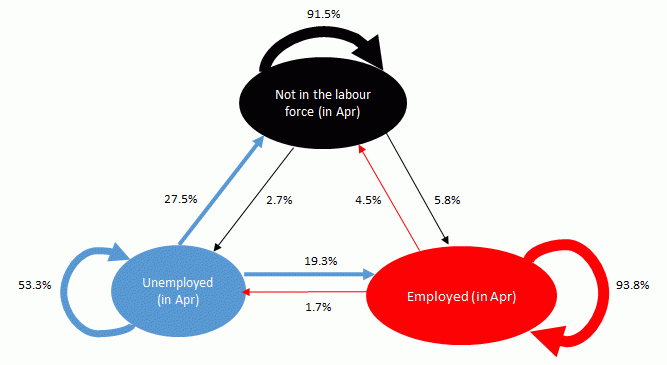
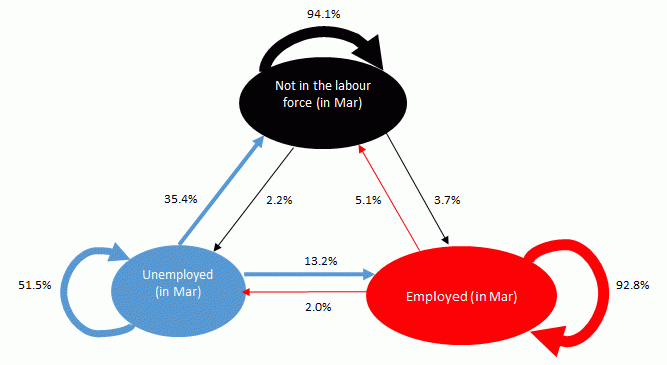
The proportion of people employed in April who moved to not in the labour force in May was lower than the proportion employed in March who moved to not in the labour force in April (4.5% compared to 5.1%), while the proportion of employed moving to unemployment fell from 2.0% to 1.7%.

The following diagrams compare the proportion of people moving between employment, unemployment and not in the labour force between March and April and between April and May, based on the matched sample (See People moving into or out of employment or unemployment for more details).

This comparison highlights:

  • the increase in the proportion of people remaining employed from one month to the next (93.8% between April and May, compared to 92.8% between March and April); and
  • the higher proportion of people moving out of unemployment into employment than into not in the labour force - between April and May 41% of people who moved out of unemployment moved into employment (rather than not in the labour force), compared to 27% between March and April.

Diagram 1: Flows in labour force status – April 2020 to May 2020

The following diagrams compare the proportion of people moving between employment, unemployment and not in the labour force between April and May.
This flow chart shows the proportions of people moving between employment, unemployment and not in the labour force from April to May 2020. Each status of workforce participation is represented as an oval connecting to each of the other statuses in the shape of a triangle. From the "not in the labour force" status, 2.7% have moved to the "unemployed" status whereas 5.8% have moved to the "employed" status. 91.5% have retained the "not in the labour force" status. From the "unemployed" status, 27.5% have moved to the "not in the labour force" status whereas 19.3% have moved to the "employed" status. 53.3% have retained the "unemployed" status. From the "employed" status, 1.7% have moved to the "unemployed" status whereas 4.5% have moved to the "not in the labour force" status. 93.8% have retained the "employed" status.

Diagram 2: Flows in labour force status – March 2020 to April 2020

The following diagrams compare the proportion of people moving between employment, unemployment and not in the labour force between March and April.
This flow chart shows the proportions of people moving between employment, unemployment and not in the labour force from March to April 2020. Each status of workforce participation is represented as an oval connecting to each of the other statuses in the shape of a triangle. From the "not in the labour force" status, 2.2% have moved to the "unemployed" status whereas 3.7% have moved to the "employed" status. 94.1% have retained the "not in the labour force" status. From the "unemployed" status, 35.4% have moved to the "not in the labour force" status whereas 13.2% have moved to the "employed" status. 51.5% have retained the "unemployed" status. From the "employed" status, 2.0% have moved to the "unemployed" status whereas 5.1% have moved to the "not in the labour force" status. 92.8% have retained the "employed" status.

Technical note on undertaking flows analysis

The flows figures included in this article were derived by 'scaling up' gross flows data to account for the gross flows being based on the matched sample only (7 of the 8 rotation groups). This enables the flows presented to represent the magnitude of change relative to the published monthly estimates of employment and unemployment. This simple scaling does not take into account weighting, population changes, or the unmatched part of the common sample (see the Rotation group analysis).

Further information

For further information, email labour.statistics@abs.gov.au.

Back to top of the page