Development of the new experimental monthly household spending indicator

Experimental indicator of household spending using banks transaction data

Released
22/02/2022

Introduction

The COVID-19 pandemic has increased policymakers’ demand for more timely insights into the economy. Household consumption is a key component of the economy so improving the timeliness and coverage of indicators of household spending is important. The ABS has been exploring the use of aggregated, de-identified transactions data from participating banks as a source for a new monthly indicator of household spending (‘the indicator’), which captures spending at the point of expenditure. This differs from household consumption, which is the point at which the household incurs a liability to the seller. 

This indicator provides early insights into household spending well before the Quarterly National Accounts. In household consumption terms, the indicator represents more than twice the coverage (68 per cent) of the current monthly Retail Trade survey (30 per cent). Household consumption is approximately 50 per cent of Gross Domestic Product (GDP).

The indicator will be published eight weeks after each month and data for all state and territories as well as at the national level will be available. Over time, we expect to shorten this publication lag when more robust processing systems are developed. 

Producing this new indicator has been made possible because of the ongoing goodwill of several of Australia’s banks. It also expands the suite of the ABS monthly products following the release of the business turnover series using Business Activity Statement data from the Australian Taxation Office.

The ABS will continue to explore the opportunities high frequency datasets provide to produce timelier insights into how Australia’s economy is performing.

Improving the timeliness and frequency of economic statistics while maintaining their quality is a longstanding challenge in the production of official statistics. This paper outlines the development of the indicator focusing on:

  • testing the suitability of bank transactions data as the primary data source;
  • the alignment with other comparable concepts such as the national accounts concept of household final consumption expenditure; and
  • the quality of the estimates produced.
Gross Domestic Product, Household Consumption and Household Spending

Household Final Consumption Expenditure (HFCE) is a major component of Gross Domestic Product (GDP). In the 2020-21 Australian System of National Accounts (ASNA), HFCE was approximately 52 per cent of Australia's GDP[1]. The ABS produces official estimates of HFCE on a quarterly and annual basis. These estimates are used to inform policy decisions, measure policy effectiveness and observe compositional changes in household consumption.

HFCE is produced by drawing on a wide range of sources including administrative data, scanner, or transactions type data, as well as traditional surveys. The Retail Trade Survey is one key data source and is often used as a leading indicator to quarterly HFCE, with approximate 30 per cent coverage of HFCE (Table 1). The bank transactions data enables the production of a monthly indicator with more than twice the coverage (68 per cent) of the Retail Trade Survey. A summary of the differences in frequency, coverage, concept and published detail is provided in Table 1.

Footnotes

Table 1. Comparison of sources, classifications, and coverage
 HFCERetail TradeHousehold Spending indicator
Data source(s)• Retail Trade
• Administrative data
• Government Finance Statistics
• Business Indicators
• Consumer Price Index
• Scanner data
• Building Activity
• Survey of Income and Housing
• Australian Petroleum Statistics
• Household Expenditure Survey
• Other ABS surveys
Retail Business SurveyAggregated, de-identified banks transactions data
FrequencyQuarterly, AnnualMonthly, QuarterlyMonthly
Classification structure/ Lowest level of compilationCOICOP/Sub class Australian and New Zealand Standard Industrial Classification (ANZSIC)/ClassCOICOP/Division
Classification CoverageAll COICOP• Retail Industry
• Selected subdivisions from Accommodation and Food Services Industry
Selected COICOP
Conceptual coverageHFCERetail Trade turnover (Survey)/30% of HFCE(a)Household purchases/68% of HFCE(b)

This table shows a summary of the differences in frequency, coverage, concept and detail between HFCE, Retail Trade and the Household Spending indicator.

Concepts

There are conceptual differences between Household spending and Household final consumption expenditure (HFCE).

Household spending is the goods and services paid for by Australian resident households within the Australian domestic territory or by Australian resident households abroad at the point of transaction. 

Household spending captures the point of expenditure; it is where payment is made for a good or service, not necessarily at the point where ownership changes, or when a service has been delivered, or where the goods and services are consumed. The expenditure of Australian resident households for business purposes is not included within the scope of household spending. Household spending is not a traditional economic statistic included in existing statistical frameworks, nor is it defined in the System of National Accounts (SNA) 2008.

Like household spending, HFCE consists of expenditure by resident households on goods and services, irrespective of whether the expenditure was made within the domestic territory, or by Australian residents abroad[2]. Conceptually HFCE is recorded at the point where the household incurs a liability to a seller. That is, at the time ownership changes for a good or where a service is delivered, and this is not always at the point where payment is made. This is the primary conceptual difference between HFCE and household spending.

Resident households consume a wide range of goods and services and HFCE is deconstructed into various ‘functional’ classifications focussing on the ‘purposes’ or ‘objectives’ of these transactions. The international Classification of Individual Consumption by Purpose (COICOP)[3] is used to classify HFCE transactions by purpose or function and the same classification has been used to categorise the indicator.

For some COICOP divisions this difference between HFCE and household spending is negligible as the consumption and associated spend occur almost simultaneously, such as food, clothing and footwear or alcoholic beverages. However, for other divisions, the timing difference between spending and consumption can lead to significant discrepancies. Examples include the spending and consumption associated with education, electricity, gas, and other fuels, or communications where bills are generally paid before or after these services have been used.

Other conceptual differences arise in the health division where household spending will capture total spending by the household, whereas HFCE captures the household out-of-pocket expense and any benefits paid by government, such as those made under the Medicare or Pharmaceutical Benefit Scheme, are included in government final consumption expenditure.

Bank Transactions Data

Since March 2020, participating banks have supplied aggregated, de-identified transactions data to the ABS. This includes the total spend on goods and services made by individuals and households for personal use from retailers and service providers. The bank data is provided at different time points following the end of each reference month. Once all data is received, it is validated and collated.

The data is received in different formats and classifications from the participating banks. Some banks provide data at a low level of categorisation e.g., at a bank allocated merchant category level, and others provide categorised data at the Australia and New Zealand Standard Industry Classification (ANZSIC) or retail or non-retail level. Data is received at different frequencies, with some banks providing daily data and others weekly. All participating banks provide data at an identifiable state and territory level.

The aggregated data does not contain information about individuals or households. Banks transactions data is only accessed by ABS staff required to produce relevant statistics, including the indicator. The ABS is committed to upholding the privacy, confidentiality and security of the information it collects.

Methodology

Scope assumptions and coverage

The indicator is derived from aggregated, de-identified card and banks transactions by resident households. The source data does not cover the whole population and does not include all payment types. While cash payments, direct transfers outside the banks, cryptocurrency and BPAY transactions are all forms of household spending, these are not currently included due to lack of available data sources or ability to identify such transactions in the current data set.

The following assumptions have been used in producing the indicator:

  1. All transactions represent final consumption expenditure. The data includes household transactions that may feed into the production process (e.g., a household purchase of seeds to grow vegetables at home). As it is not possible to identify or adjust for these transactions, it is assumed any ‘intermediate consumption’ transactions in the data have an immaterial impact on the final estimates.
  2. Non-resident transactions (net expenditure overseas) captured within the bank transaction data have an immaterial impact on the estimates. Lacking any means to identify and adjust non-resident transactions, it is assumed that expenditure patterns between resident and non-residents exhibit similar trends on consumption goods and services.

Estimation methods are used to adjust for under coverage of the population, under coverage within each spending category and over coverage of institutional sectors. For more information see Estimation.

Outputs are produced for nine out of the thirteen major Classification of Individual Consumption According to Purpose (COICOP) Divisions. Outputs are produced at the Australia, and State and Territory level. For more information see Outputs.

Transformation of the data

The aggregated banks transactions data is not designed for statistical purposes. In addition to normal micro and macro editing procedures, a number of data transformation steps and adjustments are made to derive the indicator. These include:

  1. Classification and concordance mapping
  2. Calendarisation data and derivation of trading day ratios
  3. Alcoholic beverages and tobacco adjustment
  4. Residual category adjustment
  5. Estimation
  6. Seasonal adjustment and Calendar adjusted estimates

1. Classification Concordance and Mapping

The bank data has varying classifications. To produce aggregate COICOP outputs, a concordance structure was developed to map the data from each participating bank. This maps bank data, by merchant category or ANZSIC class, to the COICOP division classification and creates a consistent data set for further transformation. 

For example, bank data spending initially classified as “grocery stores and supermarket” expenditure would be allocated directly to the Food COICOP division. This mapping is unique to the household spending indicator, and while this process does increase comparability with HFCE estimates, HFCE is produced at a much more detailed product level which enables more accurate categorisation.

2. Calendarisation and derivation of trading day ratios

Following the end of each month, daily and weekly data is received for that month. The daily data is aggregated up for the whole calendar month.

The weekly values are divided by 7 and the derived value (1/7) allocated to each day of the relevant week. To capture trading day effects, a trading day ratio is calculated and applied to ensure the weekly data appropriately reflects household spending patterns across the days of the week.

3. Alcoholic beverages and tobacco adjustments

Identification of spending on alcoholic beverages and tobacco COICOP varies across the bank data. Where not identifiable in the data a select adjustment is made. This creates expenditure shares based on the identifiable alcoholic beverages and tobacco data, which is then applied to the data where alcoholic beverages and tobacco spending is not identifiable. 

4. Residual category adjustment

The level of detail for most categorised bank transaction data directly maps to COICOP. However, there are instances where the categorisation is less detailed and represents multiple COICOP categories. In these instances, a residual category adjustment is applied so all transactions are categorised to a specific COICOP.

The residual category adjustment borrows information from other bank data where more detail is provided in order to make required adjustments to allocate the more aggregated data.

5. Estimation

There are potential areas of both under and over coverage. For example, not all Australian resident households are represented within the supplied bank data resulting in under coverage of the population. Instances of over or under coverage can introduce bias and variance in the estimates. 

To account for coverage issues, a proportional modified Denton[4] benchmarking method is applied. This is a standard ABS method used for temporal benchmarking, for example for quarterly GDP. In the absence of quarterly household spending, quarterly HFCE is used for the benchmarks. This balances timeliness and is conceptually more aligned with the target concept than other data sources or key aggregates available. Benchmarking to HFCE is applied at the state by COICOP division level. Total spending is then calculated as the aggregate of the state by division series.

Benchmarking to Quarterly HFCE:

  1. adjusts for coverage error in the bank transactions data from differences in its relative coverage by product and state.
  2. adjusts for changes in coverage of the bank transactions data over time, which are not representative of changes to total spending.
  3. adjusts for coverage error arising from differences in quarterly growth rates between the sampled and unsampled populations.

When the benchmark becomes available for the extrapolated periods, the growth rates are adjusted to meet the benchmark series. This results in revisions. Revisions from the initial to the benchmarked growth rates can be used to provide an indication of the accuracy of the initial estimates of the spending indicator in terms of size (variance) and direction (bias).

6. Seasonal Adjustment and Calendar Adjusted estimates

The indicator exhibits systematic seasonal and calendar related effects. Producing a seasonally adjusted series would improve the quality of the output in these ways:

  1. Interpretability – predictable seasonal effects will be removed to better identify short-term and long-term behaviour
  2. Relevance – increased suite of statistics available for users
  3. Coherence – comparability with existing outputs including Retail Trade and HFCE

A minimum of 3 years of data is usually required to seasonally adjust data. While we have 3 years of data (January 2019 to December 2021), this 3-year period is far from usual because of the pandemic and so seasonally adjusted estimates are not currently produced.

In the absence of seasonal adjustment, adjustments have been applied to allow for length of month and trading day effects present in the month-to-month movements for many series. These are referred to as calendar adjusted estimates.

The calendar adjusted series uses trading day adjusted bank transactions data, which differs from the input data used in the original series and includes a length of month adjustment prior to benchmarking.

The application of these methods to produce a calendar adjusted series generates a series adjusted for some of the seasonal influences present in the data.

Final Output

Monthly indices are produced for total household spending and nine of the major COICOP divisions:

  • Food
  • Alcoholic beverages and tobacco
  • Clothing and footwear
  • Furnishing and household equipment
  • Health
  • Transport
  • Recreation and culture
  • Hotels, cafes and restaurants
  • Miscellaneous goods and services

As levels of spending are not available from the indicator, index values are produced to enable users to calculate movements between any two time periods. The index values are set to 100.0 at the beginning of the time series, January 2019. The index values are available in both original and calendar adjusted terms for Australia, and each state and territory.

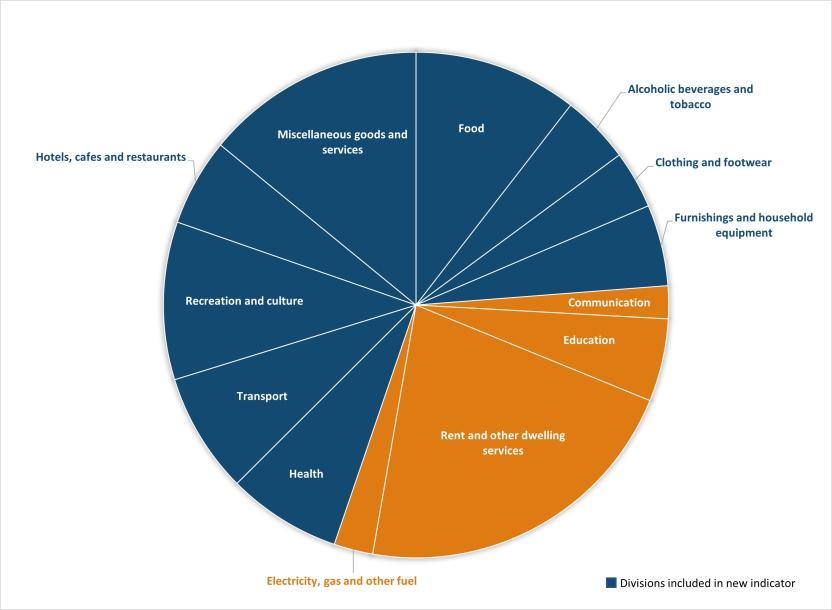
The publication of COICOP division estimates seeks to provide further insights into household spending. An equivalent presentation of these divisions in HFCE would equate to around 68 per cent coverage of total HFCE (Figure 1) based on the 2020-21 Australian System of National Accounts.

Footnotes

Figure 1. Monthly spending indicator HFCE category coverage

This chart shows the coverage of HFCE categories in the new household spending indicator
This chart shows the whole of HFCE and what portion of each COICOP division contributes to that total. The size of the segment in the graph shows the size of the proportion of HFCE. The parts that are highlights in blue on the left show the coverage that the Monthly Household Indicator represents. The parts in orange show the divisions that are not included in the indicator. The COICOP divisions that are covered by the indicator are: • Food • Alcoholic beverages and tobacco • Clothing and footwear • Furnishing and household equipment • Health • Transport • Recreation and culture • Hotels, cafes and restaurants • Miscellaneous goods and services The COICOP divisions that are not covered by the indicator are: • Communication • Education • Rent and other dwelling services • Electricity, gas and other fuels

Figure 1: Based on the Australian System of National Accounts 2020-21, HFCE current price original. Excludes net-expenditure overseas.

Quality Assessment

The indicator has been assessed against each dimension of quality in the ABS Data Quality Framework, including alignment with related estimates. The quality assessment demonstrated both fitness for purpose of the indicator, as well as its limitations.

Institutional environment

Relevance

Timeliness

Accuracy

Coherence

Interpretability

Comparison with Household Final Consumption Expenditure

This section provides analysis of the national total original unbenchmarked indicator estimates with the comparative national HFCE estimates produced within Australia’s National Accounts. The monthly spending indicator estimates have been aggregated to quarterly to undertake this comparison.

While HFCE is the basis for the spending indicator and differences between liability and the associated spend are minimal across several COICOP divisions, it is not itself a monthly measure of HFCE. However, with the introduction of quarterly benchmarking into the process, there is exact alignment with the quarterly HFCE movements, while prior to benchmarking, alignment varies (Figure 2 and 3).

At the total level and across most categories, pre-benchmarked indicator outputs align well with HFCE (see Figures 2 and 3). There are, however, some categories, such as communications, education services and housing, water, electricity, gas and other fuels, that show significant misalignment.

This diagram shows all household spending unbenchmarked aggregated to quarterly to show alignment with Total HFCE.

The Household Spending series comprises of all COICOP divisions, including those that will not be published separately, in order to demonstrate alignment with total HFCE.

This diagram shows household spending on health, unbenchmarked, aggregated to quarterly to show alignment with HFCE Health.


Table 2 summarises the alignment of COICOP divisions between HFCE and pre-benchmarked household spending estimates. The average absolute difference is the magnitude of the difference in the monthly percentage movements, whereas movement/direction alignment is the percentage of time the monthly changes move in the same direction. The alignment rating is then based on a combination of these two metrics.

Table 2: Coherence summary - HFCE and Household spending estimates
COICOP Division

Average Absolute Difference

(percentage points)

Movement/direction Alignment

(%)  

Alignment Rating
Alcoholic beverages and tobacco6.790.0Good
Food2.680.0Good
Clothing and footwear4.2100.0Very Good
Furnishings and household equipment5.980.0Good
Health2.4100.0Very Good
Miscellaneous goods and services4.460.0Poor alignment
Recreation and culture5.570.0Reasonably good
Hotels, cafes and restaurants5.790.0Good
Transport3.890.0Good
Education services61.3

90.0

Poor alignment
Communications2.760.0Poor alignment 
Rent and other dwelling services7.580.0Reasonably good
Electricity, gas and other fuels7.580.0Reasonably good
Total2.970.0Reasonably good

This table shows a summary of how each of the COICOP categories aligns between HFCE and the final estimates of the indicator before benchmarking.

Both HFCE and Household spending are based on current price, original for the purposes of this comparison. Household spending is unbenchmarked and aggregated to a quarterly frequency to complete this analysis.

Comparison with Retail Trade

An indicator series using bank transactions data was developed to compare with the monthly turnover estimates from the Retail Trade Survey (RTS)[5]. The monthly Retail Trade estimates are classified to ANZSIC, with a primary focus on industry group and sub-group level outputs.

The primary difference between the RTS and the household spending indicator is coverage. RTS focusses on measuring turnover, from sole traders and business, across the Retail industry that predominantly sell to households and covers all payment modes. Household spending is recorded at the point of transaction on goods and services across all relevant industries, including retail.

Table 3 shows the most like for like comparison between the two classifications. In some cases, certain categories in one classification will not include products in another category. For example, personal and accessory retailing found in the ANZSIC classification clothing, footwear and personal accessory retailing is not found in the COICOP classification clothing and footwear. Table 3 also summarises how each of the categories aligns between RTS and the unbenchmarked estimates. The average absolute difference is the magnitude of the difference in the monthly percentage movements, whereas the movement/direction alignment is the percentage of time the monthly changes move in the same direction. The alignment rating is based on a combination of these two metrics.

Table 3: Retail trade and Household spending comparison table
ANZISC Sub-DivisionsCOICOP Divisions/Groups

Average absolute difference

(percentage points)

Movement/direction Alignment

(%)

Alignment Rating
Food Retailing• Food
• Alcoholic beverages and tobacco - Alcoholic beverages
1.397.0Good
Household Goods Retailing• Furnishings and household equipment6.091.0Good
Clothing, Footwear and Personal Accessory Retailing• Clothing and footwear5.494.0Good
Department Stores• Clothing and footwear
• Furnishings and household equipment
8.986.0Reasonably good
Other Retailing• Health - Medicines, medical aids and therapeutic appliances
• Recreation and culture - Goods for recreation and culture; Newspapers, books and stationery
• Miscellaneous goods and services - Other goods
2.1100.0Very Good
Cafes, Restaurants and Takeaway Food Services• Hotels, cafes, and restaurants - Catering services2.583.0Reasonably good
Total• Food
• Alcoholic beverages and tobacco - Alcoholic beverages
• Clothing and footwear
• Furnishings and household equipment
• Health - Medicines, medical aids and therapeutic appliances
• Recreation and culture - Goods for recreation and culture; Newspapers, books and stationery
• Hotels, cafes, and restaurants - Catering services
• Miscellaneous goods and services - Other goods
1.997.0Very Good

This table shows the most like for like comparisons between the ANZISC and COICOP classifications as well as how each of the categories aligns between RTS and the unbenchmarked estimates of the indicator. Lower level categories have been used in some comparisons to show a more equivalent comparison. 

Despite the differences mentioned above, most of the industries show good alignment of the retail indicator series and the RTS series (see Figure 4) with some minor differences in some of the industries. Examples where there are differences are in department stores and household goods (Figure 5 and 6).

This diagram shows household spending alignment with the RTS series at the total level across all COICOP categories.

This diagram shows household spending alignment with the RTS series for department stores and equivalent COICOP categories in table 3. 

This diagram shows household spending alignment with the RTS series across the household goods and equivalent COICOP category in table 3.

State level estimates

The household spending indicator is also produced at the state and territory level. This can provide insights into state events and the impacts on household spending, for example the impact of lockdowns in different states.

The example below (Figure 7) shows the monthly change in household spending for hotels, cafes and restaurants in NSW, Vic, and QLD. From March 2020 to June 2020, the entire nation saw similar patterns in household spending for this category due to nation-wide lockdowns. From July to December 2020, however, there is a noticeable difference between spending activity in Victoria and the other states due to larger case numbers and sustained lockdowns particularly in Melbourne. In June 2021, NSW entered lockdown, resulting in reduced monthly household spending in hotels, cafes and restaurants. July 2021 saw falls in both QLD and Vic following the introduction of new state-based lockdown measures. 

This diagram shows the monthly household spending for hotels, cafes and restaurants in NSW, Vic, and QLD.

Since the onset of the COVID-19 pandemic, furnishing and household equipment household spending in ACT, SA and Tasmania (Figure 8) had been impacted similarly, except for the snap lockdown introduced in SA in July 2021 and the ACT lockdown commencing in August 2021 causing a decrease in spending. Spending increased as these lockdowns ended, and restrictions eased.  

This diagram shows the monthly household spending for furnishing and household equipment household spending in ACT, SA and Tasmania.

Conclusion and next steps

The monthly household spending is a high quality, high frequency economic indicator which can provide more timely insights into household spending activity in Australia. The ABS conducted a quality assessment in line with the ABS Data Quality Framework to evaluate the robustness and suitability of the statistical methods to produce the indicator. While there are coverage issues in terms of transaction types deemed in scope of household spending as well as coverage of the population, the overall quality of the developed indicator, the methods, compilation processes and coherence with existing lower frequency estimates are of good quality.

While household spending draws its basis from HFCE, and the indicator has good alignment and is broadly coherent, the differences in sources, scope and coverage need to be considered when comparing the indicator series with HFCE estimates. The estimation process of benchmarking the indicator using quarterly HFCE is necessary to address some persistent coverage issues and potential biases. The addition of other bank data, and expansion of transaction types, will improve the indicator and, over time, may reduce the need for the benchmarking procedure. Further, supplementing the indicator with other relevant transaction type data sets could lead to a more robust indicator that could be produced independently.

The new monthly household spending indicator provides more timely insights in the intervening months between quarterly and annual ABS economic releases. 

Table 4: Quality summary table
COICOP DivisionAppropriateness of payment mode to measure total household spending (a)Timing differences between spend and consumption (b)Average differences between National unbenchmarked and benchmarked Household spending series (c)Percentage of Division share of HFCE, 2020-21 (%) (d)Alignment rating between unbenchmarked Household Spending Series and HFCE (e)Alignment rating with monthly Retail Trade Survey (f)
Alcoholic beverages and tobaccoPartialMinimal2.64.4GoodGood
FoodYesMinimal0.910.5GoodGood
Clothing and footwearYesMinimal1.63.7Very GoodGood
Furnishings and household equipmentYesMinimal2.55.2GoodGood
HealthYesMinimal0.97.3Very GoodGood
Miscellaneous goods and servicesYesPartial1.514.1Poor alignmentGood
Recreation and cultureYesPartial2.010.2Reasonably goodGood
Hotels, cafes and restaurantsYesMinimal2.65.6GoodReasonably good
TransportYesMinimal1.87.7GoodNA
Education servicesNoLarge25.05.3Poor alignmentNA
CommunicationsNoLarge0.92.1Poor alignment NA
Rent and other dwelling servicesNoPartial2.721.6Reasonably goodNA
Electricity, gas and other fuelsNoLarge2.72.5Reasonably goodNA
TotalYesMinimal/Partial1.4100.0Reasonably goodVery Good

Summary Table for original November data at National level:

(a) Refer to sections “Methodology” and “Final Output”.

(b) Lag in data if large timing differences between spend and consumption.

(c) Average absolute difference in monthly % movements shown.

(d) The percentages are calculated based on the total of all HFCE categories (excluding NEO) from the ASNA.

(e) Refer to Table 2 in the “Comparison with Household Final Consumption Expenditure” section.

(f) Refer to Table 3 in the “Comparison with Retail Trade Survey” section. 

Future plans

This publication and the downloadable time series is the first release of the experimental monthly household spending indicator. Future publications will be approximately 8 weeks after each reference month. The ABS will develop systems and processes to improve the timeliness of the release. 

The methodological approaches used, and the experimental estimates, will be reviewed and tested before removing the experimental label. This may result in differences in presentation or in data values. The suitability of seasonal adjustment will continue to be monitored and assessed. As the timeliness, timeseries and scope of available bank transactions data improves, and other relevant data sources becoming available, there is potential for further enhancements.

Seeking feedback

The ABS welcomes feedback on the new indicator via email to national.accounts@abs.gov.au.

Footnotes

Disclaimer

Legislative requirements to ensure privacy and secrecy of this data have been adhered to. Only those authorised under the Australian Bureau of Statistics 1975 have been allowed to view data about any particular firm in conducting these analyses. In accordance with the Census and Statistics Act 1905, results have been confidentialised so no person or organisation can be identified. The banks provide aggregated data to the ABS so that any product level or individual spending is not identifiable.   

Acknowledgement

The ABS would like to acknowledge the ongoing support of the participating banks that have enabled the ABS to produce these statistics.

Back to top of the page