Addressing historical coherence: the experimental two-year innovation rate

Presents an experimental innovation-rate series using historical data from the Business Characteristics Survey (BCS).

Released
22/07/2022

Introduction

Innovation is the introduction of a new or significantly improved good, service, or process. In Australia and other member countries of the Organisation for Economic Co-operation and Development (OECD), one of the key statistics used to measure innovation is the rate of “innovation-active” businesses.

This article presents estimates for historical two-year innovation rates (TYIRs) which have been derived from previously collected single-year responses (Business Characteristics Surveys 2006-07 through to 2019-20). These estimates aim to address the comparison difficulties introduced with the methodological change from a single-year innovation rate (SYIR) to TYIR.

The SYIR and TYIR measure the percentage of Australian businesses which are innovation-active, that is, engaged in any work which was intended to, or did, result in the introduction of an innovation. This information is collected from businesses through the Business Characteristics Survey (BCS).
Background

The innovation status reported by businesses is affected by several considerations. One consideration is the collection reference period used. Internationally, reference periods have ranged from one to three years.

Since 2006-07, the BCS used a single-year reference period but the redeveloped 2020-21 BCS extended this to two years.

The choice of a two-year reference period balanced the need for:

  • international comparison
  • lower levels of respondent burden (particularly, recall and cognitive burden)
  • greater statistical utility

This decision was made as part of a broader BCS survey redevelopment project; whereby, there is now a subject specific BCS Innovation module every two years.

The concept and measurement of innovation has evolved over the course of its observation in Australia. Other changes since 2006 include:

  • the Australian and New Zealand Standard Industrial Classification (ANZSIC) was updated in 2006
  • the Agriculture, Forestry and Fisheries industry was included in the survey scope from 2008
  • the conceptual and statistical definition of innovation was revised in accordance with the 'Oslo Manual: Guidelines for Collecting, Reporting and Using Data on Innovation, Fourth edition' in 2018

For further details regarding the impact of these changes on quality and usage, please refer to data quality considerations section.

Methodology

The experimental TYIR was calculated for all pairs of consecutive years between 2006-07 and 2019-20. It is defined as the proportion of two-year innovation-active businesses:

\( TYIR={Expected\ number\ of\ businesses\ which\ were\ innovation\ active\ at\ least\ once\ in\ the\ last\ two\ years\over Number\ of\ businesses\ in\ the\ current\ year} \times100\)

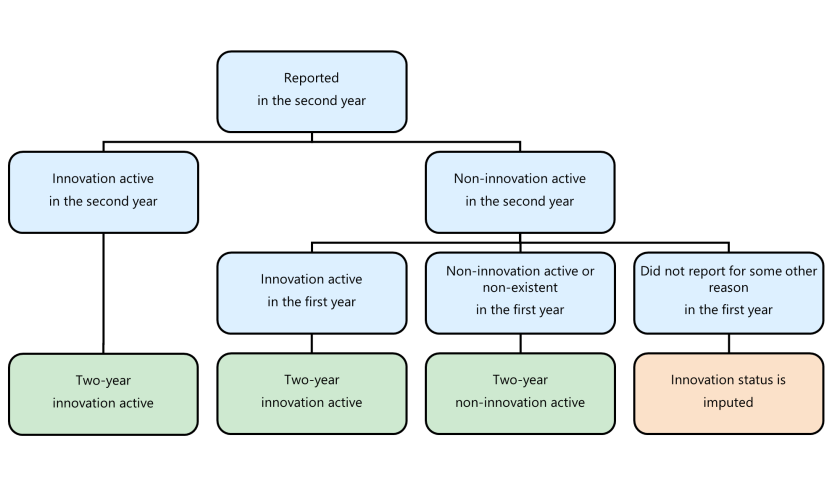
The “expected number of businesses” is used since complete two-year responses were not available for all businesses. The flowchart below outlines how such discrepancies were addressed.

Estimation flowchart

Estimation flowchart
The flowchart contains 10 rectangles: 6 for considerations (blue) and 4 for decisions (green and orange). The blue rectangles illustrates the breakdown of a cohort of businesses. First, only businesses that "Reported in the second year" are retained. These are divided into those that were "Innovation active in the second year" "Non-innovation active in the second year". These non-innovation active businesses are further separated by their response in the first year: "Innovation active in the first year", "Non-innovation active or non-existent in the first year", and "Did not report for some other reason in the first year". This leaves 4 exhaustive possibilities. 3 of these possibilities present sufficient information for an innovation status to be derived (green). Businesses which were innovation active in the first or second year are both given a two-year innovation active status. Businesses which were non-innovation active in the second year and were non-innovation active or non-existent in the first year are given a two-year non-innovation active status. The remaining scenario (Non-innovation active in the second year and did not report in the first year for some other reason) presents insufficient information for a derivation with innovation statuses being imputed (orange).

Only businesses which reported in the second year of each two-year reference period contributed to the calculation. This preserved past efforts to ensure surveyed businesses are representative of Australian businesses and incorporated the new survey method.

The innovation status of a business was then derived from its pair of single-year innovation statuses. For businesses with valid responses in both years:

  • two-year innovation active status – a business would need to be active in at least one of the two years
  • two-year non-innovation active status – a business would need to report inactivity for both years

These two scenarios are not exhaustive since businesses which reported in the second year include those which may not have responded in the first year. In some instances, the missing response was not needed:

  • if the business was innovation active in the second year, the business was already guaranteed to be two-year innovation active
  • if the business did not exist in the earlier year, the business was guaranteed to be non-innovation active for that year

The remaining businesses (those which existed throughout the two years, reported innovation inactivity in the second, but did not respond in the first) were imputed.

This approach guarantees an increased innovation rate since the extended reference period introduces more opportunity for businesses to identify as innovation-active while the criteria for inactivity have remained the same.

Imputation

Since surveyed businesses are representative of Australian businesses, the imputed innovation statuses were also treated as representative. The innovation rate was imputed with the probability of a business being innovation active in the first year given their relevant characteristics.

The imputation method is expected to have a minimal effect on the final TYIRs since the level of imputation was low for each reference period.

Furthermore, the assumptions are kept conservative. The method assumes time, ANZSIC industry, and reporting circumstances influence the innovation status. This avoids the minimal utility of more general methods and the rigidity of more specific methods.

Results

The TYIR was consistently greater than the SYIR for all groupings.

The national TYIR was lowest for 2008-10 at 52.26% and greatest for 2018-20 at 62.24%. It also exhibits a more stable increase over the reference period, dampening the saw-tooth pattern of the SYIR.

The difference between the smallest employment size and the other three was more pronounced with the TYIR.

Each of the four employment sizes displayed distinct characteristics. The largest employment size presented a decrease from 2016 while the smallest employment size presented stable growth.

At the industry level, the TYIR estimates generally presented similar characteristics to the SYIR. Some exceptions to this were:

  • Industry A (Agriculture, Forestry, and Fisheries) which displayed stronger growth, particularly in recent years.
  • Industries B (Mining), D (Electricity, Gas, Water, and Waste Services), and S (Other Services) which were much more stable for the two-year reference periods.

For detailed industry level estimates, please refer to the downloads section.

Data quality considerations

This statistic is experimental and cannot guarantee accurate alignment with future directly collected two-year innovation rate data. Factors such as the feasibility for respondents to recall their activities over a longer reference period are anticipated to have an impact but cannot be measured.

The ABS recommends that the data are not treated as time series. The extended reference period has captured survey changes which impact the coherence of the TYIR. Genuine shifts in the innovation rate and the effects of these historical changes cannot be distinguished.

The experimental TYIR has reduced the impact of the change from a single-year to two-year reference period, however, these statistics are not expected, nor intended, to match future data.  Most notably, the experimental TYIR has not led to a statistic comparable to the directly collected 2020-21 BCS Innovation module TYIR – which is significantly lower due to a number of factors discussed in the main release of this publication.

Relative Standard Errors (RSEs)

The data used to produce this experimental statistic are taken from the  BCS and largely subject to the same level of quality. RSEs were low, similar to those of the original SYIRs.

Data downloads

Historical two-year innovation rate estimates

Back to top of the page