TableBuilder

Create, save and download your own tables. Find out about costs and how to access.

Released
8/11/2021

\(\Large ⚿\) Log into TableBuilder


TableBuilder is a flexible way to access detailed data where you can:

Cost

Data series are per organisation - add unlimited members to your organisation at any time at no additional charge.

Cost for TableBuilder
ServicePrice
Census TableBuilder BasicFree
Census TableBuilder ProFree for organisation members*
Businesses in AustraliaFree
TableBuilder - other datasetsFree**


*Contact microdata.access.abs.gov.au if you have not automatically been joined to your organisation in the Registration Centre

**See the TableBuilder Topics page for more. 

How to access

  1. Register using your organisation email address (if applicable) to automatically join your organisation in the Registration Centre.
    • When you register, you are automatically granted access to Census TableBuilder Basic and Businesses in Australia
    • All organisation members are also automatically granted access to Census TableBuilder Pro (free) and to the products your organisation has access to.
    • If you wish to register your organisation for Census TableBuilder Pro, email microdata.access@abs.gov.au, including your organisation name, ABN (if applicable), street and postal addresses, user IDs of contact officers (must be registered), and your organisation's email domain (e.g. @xyz.com.au)
    • If you wish to subscribe to any other data series or if you have not automatically joined an organisation, email microdata.access@abs.gov.au, including your name, organisation, user ID number and the products and systems you want to subscribe to
  2. Log in to access TableBuilder using your Registration Centre ID and password.

Once registered, see Getting started for information on how to use the TableBuilder system, as well as the TableBuilder user guide (links on the left of this page)

Privacy policy

The ABS privacy policyCensus privacy policy and TableBuilder privacy impact assessment outline how the ABS handles any personal information that you provide to us. 

Topics

List of datasets available in TableBuilder, summary information, links to publications and data item lists

Released
19/11/2021

TableBuilder datasets are grouped into themed data series. You can subscribe to one or more data series in TableBuilder. When you subscribe to a data series, you and all members of your organisation can access all of the datasets within that data series. See How to access for more information, or email microdata.access@abs.gov.au to organise access to a data series for your organisation. 

Datasets and reference periods in TableBuilder are listed below. For datasets in other systems see MicrodataDownload and DataLab, or all topics in Available microdata and TableBuilder.

Free Data Series

The below data series are available to TableBuilder users for free. These data series are licensed to registered organisations, whose users can then access them as part of their organisations licence. "Businesses in Australia" and "Census TableBuilder Basic" are available to all individual users for free, regardless of any organisation affiliation.  For more information, see How to access. Please email microdata.access@abs.gov.au to organise access to a data series for your organisation. 

Aboriginal and Torres Strait Islander Peoples

Aboriginal and Torres Strait Islander Peoples (free to members of registered organisations)
DatasetDescriptionData item listRelease date
National Aboriginal and Torres Strait Islander Health, 2018-19 Collects information on the health and wellbeing of Aboriginal and Torres Strait Islander people.Data items26/03/2020
National Aboriginal and Torres Strait Islander Health Survey, Core Content - Risk Factors and Selected Health Conditions, 2012-13Collects information on the health and wellbeing of Aboriginal and Torres Strait Islander people.Data items28/07/2015
National Aboriginal and Torres Strait Islander Health Survey, Detailed Conditions and Other Health Data, 2012-13Collects information on the health and wellbeing of Aboriginal and Torres Strait Islander people.Data items28/08/2014
Aboriginal and Torres Strait Islander Health Survey, Nutrition and Physical Activity, 2012-13Provides key health indicators of the Aboriginal and Torres Strait Islander population. Demographic information includes education, employment, income, languages and household information. Nutrition and physical activity information includes sedentary behaviour, selected health conditions, biomedical information, health risk factors and food.Data items17/07/2015
National Aboriginal and Torres Strait Islander Social Survey, 2014-15Presents information on a range of demographic, social, environmental and economic characteristics of Aboriginal and Torres Strait Islander people, including personal and household characteristics.Data items27/05/2016


Australian Census Longitudinal Data

Australian Census Longitudinal Data (free to members of registered organisations)
DatasetDescriptionData item listRelease date
Australian Census Longitudinal Dataset, 2006-2011Uses data from the Census of Population and Housing to build a rich longitudinal picture of Australian society. The ACLD can uncover new insights into the dynamics and transitions that drive social and economic change over time, and how these vary for diverse population groups and geographies.Data items18/12/2013
Australian Census Longitudinal Dataset, 2006-2011-2016Uses data from the Census of Population and Housing to build a rich longitudinal picture of Australian society. The ACLD can uncover new insights into the dynamics and transitions that drive social and economic change over time, and how these vary for diverse population groups and geographies.Data items20/03/2019
Australian Census Longitudinal Dataset, 2006-2011-2016-2021Uses data from the Census of Population and Housing to build a rich longitudinal picture of Australian society. The ACLD can uncover new insights into the dynamics and transitions that drive social and economic change over time, and how these vary for diverse population groups and geographies.Data items10/04/2024
Australian Census Longitudinal Dataset, 2011-2016Uses data from the Census of Population and Housing to build a rich longitudinal picture of Australian society. The ACLD can uncover new insights into the dynamics and transitions that drive social and economic change over time, and how these vary for diverse population groups and geographies.Data items20/03/2019
Australian Census Longitudinal Dataset, 2011-2016-2021Uses data from the Census of Population and Housing to build a rich longitudinal picture of Australian society. The ACLD can uncover new insights into the dynamics and transitions that drive social and economic change over time, and how these vary for diverse population groups and geographies.Data items10/04/2024
Australian Census Longitudinal Dataset, 2016-2021Uses data from the Census of Population and Housing to build a rich longitudinal picture of Australian society. The ACLD can uncover new insights into the dynamics and transitions that drive social and economic change over time, and how these vary for diverse population groups and geographies.Data items10/04/2024


Businesses in Australia

Businesses in Australia (free to individuals)
DatasetDescriptionData item listRelease date
Businesses in Australia, 2018-19Contains all businesses that were active in the Australian economy in the 2018-19 financial year. The data are sourced from the ABS’ integrated product, the Business Longitudinal Data Analysis Environment (BLADE) which combines taxation and other administrative data.Data items30/04/2020


Census of Population and Housing

Census of Population and Housing (Census Basic is free to individuals; Census Pro is free to members of registered organisations)
DatasetDescriptionData item listRelease date
Census of Population and Housing, 2006 Basic (free to individuals) and Pro (free to members of registered organisations)All Census records for occupied private dwellings with their associated family and person records, and persons from non-private dwellings together with a record for the associated non-private dwelling. Includes age, marital status, citizenship and ancestry, languages, employment and income, journey to work, education, geography, family composition, household and dwelling information.Data items24/08/2009
Census of Population and Housing, 2011 Basic (free to individuals) and Pro (free to members of registered organisations)All Census records for occupied private dwellings with their associated family and person records, and persons from non-private dwellings together with a record for the associated non-private dwelling. Includes age, marital status, citizenship and ancestry, languages, employment and income, journey to work, education, geography, family composition, household and dwelling information.Data items15/08/2012
Census of Population and Housing, 2016 Basic (free) and Pro (free to members of registered organisations)All Census records for occupied private dwellings with their associated family and person records, and persons from non-private dwellings together with a record for the associated non-private dwelling. Includes age, marital status, citizenship and ancestry, languages, employment and income, journey to work, education, geography, family composition, household and dwelling information.Data items06/08/2019
Census of Population and Housing, 2021 Basic (free to individuals) and Pro (free to members of registered organisations)All Census records for occupied private dwellings with their associated family and person records, and persons from non-private dwellings together with a record for the associated non-private dwelling. Includes age, marital status, citizenship and ancestry, languages and income, education, geography, family composition, household and dwelling information.Data items21/09/2022
Census of Population and Housing: Estimating Homelessness, 2016 Presents detailed estimates of the prevalence of homelessness in TableBuilder from the ABS' Census of Population and Housing for 2016.Data items16/08/2019
Census of Population and Housing: Estimating Homelessness, 2021 Presents detailed estimates of the prevalence of homelessness in TableBuilder from the ABS' Census of Population and Housing for 2021.Data items27/04/2023
Census of Population and Housing: Index of Household Advantage and Disadvantage, 2016 The experimental Index of Household Advantage and Disadvantage (IHAD) summarises relative socio-economic advantage and disadvantage for households, using the 2016 Census of Population and Housing.Data items29/10/2019


Childhood Education and Care

Childhood Education and Care (free to members of registered organisations)
DatasetDescriptionData item listRelease date
Childhood Education and Care, 2017Collected every three years and is designed to provide a range of information about children aged 0–12 years and their families. The information collected includes the child care arrangements used by parents to care for their children, use of formal and informal care, cost and duration of the care and the attendance of children at preschool programs and other early childhood learning activities.Data items23/04/2018


Crime and Safety

Crime and Safety (free to members of registered organisations)
DatasetDescriptionData item listRelease date
Crime Victimisation, 2012-13Provides data about victims for a selected range of personal and household offences.Data items28/04/2014
Personal Safety, 2016Provides data on the nature and extent of violence experienced by men and women since the age of 15.Data items08/11/2018


Cultural Activities

Cultural Activities (free to members of registered organisations)
DatasetDescriptionData item listRelease date
Cultural Activities, 2017-18Designed to provide annual statistics about participation and attendance in selected cultural activities.

Adults data

Children data

28/05/2019
Cultural and Creative Activities, 2021-22Designed to provide annual statistics about participation and attendance in selected cultural activities.

Adults data

Children data

21/11/2023


Disability, Ageing and Carers

Disability, Ageing and Carers (free to members of registered organisations)
DatasetDescriptionData item listRelease date
Disability, Ageing and Carers, 2012Provides data on people with a disability, people aged 65 years or more, and assistance providers. Data items include household, family, income, person, conditions, restrictions, specific and broad activities, recipients, and assistance providers.Data items08/07/2014
Disability, Ageing and Carers, 2015Provides data on people with disability, older people (aged 65 years or more) and people who care for people with disability or older people. Data items include household, family, income, person, conditions, restrictions, specific and broad activities, recipients, and assistance providers.Data items18/10/2016
Disability, Ageing and Carers, 2018Provides data on people with disability, older people (aged 65 years or more) and people who care for people with disability or older people. Data items include household, family, income, person, conditions, restrictions, specific and broad activities, recipients, and assistance providers.Data items20/11/2019


Education and Work

Education and Work (free to members of registered organisations)
DatasetDescriptionData item listRelease date
Education and Work, 2011Includes data on labour force characteristics, participation in study, educational institution, educational attainment, and selected characteristics of apprentices and trainees.Data items15/05/2012
Education and Work, 2012Includes data on labour force characteristics, participation in study, educational institution, educational attainment, and selected characteristics of apprentices and trainees.Data items28/05/2013
Education and Work, 2013Includes data on labour force characteristics, participation in study, educational institution, educational attainment, and selected characteristics of apprentices and trainees.Data items28/03/2014
Education and Work, 2014Includes data on labour force characteristics, participation in study, educational institution, educational attainment, and selected characteristics of apprentices and trainees.Data items19/05/2015
Education and Work, 2015Includes data on labour force characteristics, participation in study, educational institution, educational attainment, and selected characteristics of apprentices and trainees.Data items22/02/2016
Education and Work, 2016Includes data on labour force characteristics, participation in study, educational institution, educational attainment, and selected characteristics of apprentices and trainees.Data items29/11/2016
Education and Work, 2017Includes data on labour force characteristics, participation in study, educational institution, educational attainment, and selected characteristics of apprentices and trainees.Data items06/11/2017
Education and Work, 2018Includes data on labour force characteristics, participation in study, educational institution, educational attainment, and selected characteristics of apprentices and trainees.Data items08/11/2018
Education and Work, 2019Includes data on labour force characteristics, participation in study, educational institution, educational attainment, and selected characteristics of apprentices and trainees.Data items13/11/2019
Education and Work, 2020Includes data on labour force characteristics, participation in study, educational institution, educational attainment, and selected characteristics of apprentices and trainees.Data items11/11/2020
Education and Work, 2021Includes data on labour force characteristics, participation in study, educational institution, educational attainment, and selected characteristics of apprentices and trainees.Data items09/11/2021
Education and Work, 2022Includes data on labour force characteristics, participation in study, educational institution, educational attainment, and selected characteristics of apprentices and trainees.Data items08/02/2023
Education and Work, 2023Includes data on labour force characteristics, participation in study, educational institution, educational attainment, and selected characteristics of apprentices and trainees.Data items18/12/2023


Employee Earnings and Hours

Employee Earnings and Hours (free to members of registered organisations)
DatasetDescriptionData item listRelease date
Employee Earnings and Hours, 2018Detailed earnings and hours statistics for characteristics such as industry, occupation, sex, age, full-time/part-time, and method of setting pay.Data items11/09/2020
Employee Earnings and Hours, 2021Detailed earnings and hours statistics for characteristics such as industry, occupation, sex, age, full-time/part-time, and method of setting pay.Data items29/03/2022


General Social Data

General Social Data (free to members of registered organisations)
DatasetDescriptionData item listRelease date
General Social Survey, 2014Includes data on demographic characteristics, health and disability, housing, education, work, income, financial stress, assets and liabilities, information technology, transport, voluntary work, family and community, homelessness, crime and participation in sport and recreational activities.Data items23/09/2015


Income, Housing, Wealth and Expenditure

Income, Housing, Wealth and Expenditure (free to members of registered organisations)
DatasetDescriptionData item listRelease date
Income and Housing, 2015-16Provides estimates of income, wealth and housing. These measures can be classified by a range of household, income unit, person or loan characteristics.Data items29/06/2018
Income and Housing, 2017-18Provides estimates of income, wealth and housing. These measures can be classified by a range of household, income unit, person or loan characteristics.Data items24/07/2019


Labour Force

Labour Force (free to members of registered organisations)
DatasetDescriptionData item listRelease date
Barriers and Incentives to Labour Force Participation, Retirement and Retirement Intentions, 2018-19Provides detailed information on characteristics of people who are not participating, or not participating fully, in the labour force and the factors that influence them to join or leave the labour force, and on information on retirement trends, the factors which influence decisions to retire, and the income arrangements that retirees and potential retirees have made to provide for their retirement.Data items28/08/2020
Characteristics of Employment, 2014 to 2023Weekly earnings of employees, casual workers, independent contractors, trade union membership, labour hire, job flexibility, job security.Data items13/03/2024
Jobs in Australia, annually 2011-12 to 2018-19Jobs in Australia provides statistics from the Longitudinal Employer Employee Database (LEED) to enable simultaneous analysis of met supply and demand in the Australian labour market. The LEED is a cross-sectional database, which uses administrative tax data to incorporate information from all employees and employers in Australia.Data items17/12/2021
Jobs and Income of Employed Persons, 2019-20Jobs and Income of Employed Persons provides statistics from the Longitudinal Employer Employee Database (LEED) to enable simultaneous analysis of met supply and demand in the Australian labour market. The LEED is a cross-sectional database, which uses administrative tax data to incorporate information from all employees and employers in Australia. From 2019-20, data on migrants has been linked to the LEED and a selection of variables are available in this microdata product. Data items31/05/2023
Jobs and Income of Employed Persons, 2020-21Jobs and Income of Employed Persons provides statistics from the Longitudinal Employer Employee Database (LEED) to enable simultaneous analysis of met supply and demand in the Australian labour market. The LEED is a cross-sectional database, which uses administrative tax data to incorporate information from all employees and employers in Australia. From 2019-20, data on migrants has been linked to the LEED and a selection of variables are available in this microdata product. Data items13/03/2024
Labour Force Status of Families, annually 2009-2018, quarterly from March 2019Enables detailed analysis of how families engage with the labour market and provides statistics on broad family dynamics including the number and age of children in the household.Data items11/10/2021
Participation, Job Search and Mobility, annually from 2015Provides statistics relating to people looking for work, finding work, losing jobs, changing jobs, or the reasons why people are not working or looking for work.Data items07/07/2021


Migrants

Migrants (free to members of registered organisations)
DatasetDescriptionData item listRelease date
Australian Census and Migrants, 2011, 2016Contains linked data from the Census of Population and Housing and from the Department of Social Services Permanent Migrant Database (PMD).Data items15/10/2019
Australian Census and Migrants, 2021Contains linked data from the 2021 Census of Population and Housing and from the Department of Social Services Permanent Migrant Database (PMD).Data items18/12/2023
Australian Census and Temporary Entrants, 2016Contains linked data from the 2016 Census of Population and Housing and data on temporary visa holders from the Department of Home Affairs.Data items15/10/2019
Australian Census and Temporary Entrants, 2021Contains linked data from the 2021 Census of Population and Housing and data on temporary visa holders from the Department of Home Affairs.Data items18/12/2023
Characteristics of Recent Migrants, 3-yearly from 2010Enables analysis of data about migrants arriving in the last 10 years including employment outcomes related to visa, birth country and education.Data items12/06/2020

Motor Vehicles

Motor Vehicles (free to members of registered organisations)
DatasetDescriptionData item listRelease date
Census of Motor Vehicles, annually from 2013 to 2021Includes all vehicles registered with a state, territory or motor vehicle authority for unrestricted use on public roads.Data items27/08/2021
Motor Vehicle Use, 2016, 2018, 2020Estimates of road registered vehicle usage including; total and average kilometres travelled, tonnes carried, tonne-kilometres travelled and fuel use.Data items01/02/2021
Road Freight Movements, 2014Statistics on tonnes, tonne-kilometres, total distance travelled of freight moved in Australia between selected ASGS statistical areas by road.Data items20/09/2017

National Health Survey

National Health Survey (free to members of registered organisations)
DatasetDescriptionData item listRelease date
National Health Survey, 2020-21Includes demographic and geographic information, health risk factors, health conditions and health actions. Additionally, biomedical data for NHS respondents who agreed to participate.Data items07/12/2022
National Health Survey, 2014-15, 2017-18Includes demographic and geographic information, health risk factors, health conditions and health actions. Additionally, biomedical data for NHS respondents who agreed to participate.Data items30/04/2019
National Health Survey, 2011-12Includes demographic and geographic information, health risk factors, health conditions and health actions. Additionally, biomedical data for NHS respondents who agreed to participate.Data items13/11/2014
Australian Health Survey, Core Content - Risk Factors and Selected Health Conditions, 2011-12Provides data for the common topics and combined samples of the National Health Survey and National Nutrition and Physical Activity Survey 2011-12, components of the Australian Health Survey (AHS) 2011-12. The focus of this current release is on the Core Content, primarily health risk factors and selected health conditions, as well as data from the National Health Measures Survey, the biomedical component of the AHS.Data items30/04/2014


Nutrition and Physical Activity

Nutrition and Physical Activity (free to members of registered organisations)
DatasetDescriptionData item listRelease date
Australian Health Survey, Nutrition and Physical Activity, 2011-12Includes demographic and geographic information, health risk factors, health conditions and health actions. Additionally, biomedical data for NHS respondents who agreed to participate.Data items06/11/2015
Australian Health Survey, Core Content - Risk Factors and Selected Health Conditions, 2011-12Provides data for the common topics and combined samples of the National Health Survey and National Nutrition and Physical Activity Survey 2011-12, components of the Australian Health Survey (AHS) 2011-12. The focus of this current release is on the Core Content, primarily health risk factors and selected health conditions, as well as data from the National Health Measures Survey, the biomedical component of the AHS.Data items30/04/2014


Patient Experiences

Patient Experiences (free to members of registered organisations)
DatasetDescriptionData item listRelease date
Patient Experiences, 2016-17Data on access and barriers to, and experiences of, health care services including GPs, specialists, dental professionals, hospitals and EDs.Data items12/04/2018


Preschool Education

Preschool Education (free to members of registered organisations)
DatasetDescriptionData item listRelease date
Preschool Education, annually from 2016Contains statistics on children enrolled in and attending a preschool program across Australia and is derived from administrative data provided by state and territory and Australian Government education departments and the Catholic Education Office of the Archdiocese of Canberra and Goulburn.Data items28/6/2023
Episodes of workers delivering a preschool program, 2021Contains statistics on children enrolled in and attending a preschool program across Australia and is derived from administrative data provided by state and territory and Australian Government education departments and the Catholic Education Office of the Archdiocese of Canberra and Goulburn.Data items28/6/2023


Qualifications and Work

Qualifications and Work (free to members of registered organisations)
DatasetDescriptionData item listRelease date
Qualifications and Work, 2018-19Presents detailed information about the educational history of people and the relevance of each qualification to their working lives.Data items29/09/2020


Sport and Physical Recreation

Sport and Physical Recreation (free to members of registered organisations)
DatasetDescriptionData item listRelease date
Participation in Sport and Physical Recreation, 2013-14Data on persons aged 15 years and over who participated in sport and physical activities as players, competitors or physically undertook an activity.Data items18/02/2015


Work-Related Injuries

Work-Related Injuries (free to members of registered organisations)
DatasetDescriptionData item listRelease date
Work-Related Injuries, 2017-18People who experienced a work-related injury or illness, including type of injury, job details and work-related injury rates.Data items27/09/2019
Work-Related Injuries, 2021-22People who experienced a work-related injury or illness, including type of injury, job details and work-related injury rates.Data items23/03/2023


Work-Related Training and Adult Learning

Work-Related Training and Adult Learning (free to members of registered organisations)
DatasetDescriptionData item listRelease date
Work-Related Training and Adult Learning, 2016-17Provides annual statistics about formal study and non-formal learning, with a focus on work-related training and personal interest learning.Data items17/01/2018
Work-Related Training and Adult Learning, 2021Provides annual statistics about formal study and non-formal learning, with a focus on work-related training and personal interest learning.Data items11/03/2022


Paid Data Series

The are currently no TableBuilder datasets that require a paid subscription to access.

Getting started

Registering and logging into TableBuilder, introducing the home page

Released
19/11/2021

Register and log in

After registering, navigate to the Log into your accounts page and click on TableBuilder to log in.

Enter your user ID (a number) and your password. Your TableBuilder password is the same as the one you created in the Registration Centre when registering.

When you log in for the first time, you are asked to agree to Conditions of use for TableBuilder. It is important that you read and understand these conditions so that you are using TableBuilder appropriately.

TableBuilder log in

If you forget your credentials, you can use the 'forgotten' links on the log in page to retrieve your user ID or reset your password. You need access to the email address you registered with and your secret question and answer.

Contact microdata.access@abs.gov.au:

  • if you can't remember your secret question and answer
  • to unlock your account if you attempt to log in with the wrong password too many times
  • if you have changed your email address (for example if you have moved to a new organisation or changed your name)

Taking the tour

When you open TableBuilder for the first time, a tour of TableBuilder features opens. The tour takes you through the home page features, saved tables, opening a dataset, creating a table, retrieving data and navigation.

To take the tour again, you can open it from the three vertical dots menu in the top right of the screen.

TableBuilder tour welcome screen

Home page features

There are a number of useful features on the TableBuilder home page.

TableBuilder homepage highlighting main features

1. Datasets panel

This panel shows the catalogue of datasets that you have access to: 

  • see How to access to subscribe to additional data series
  • click the arrow to expand the folder to display sub-folders (triangle icon) and datasets (cube icon)
  • select a dataset with a single click to display any saved or predefined tables for this dataset in the middle panel, and additional information about the dataset in the third panel
  • double-click on a dataset to open it and start creating a new table
2. New table button

Select a dataset in the Datasets panel, then click this button to start creating a new table. Alternatively, double-click on the dataset to open it.

3. Saved and predefined tables panel

This panel shows your saved tables and any pre-prepared (predefined) tables that are available for the selected dataset.

  • Predefined tables are accessible to all users.
  • Saved tables are tables you have saved and are only accessible by you.

When a dataset is selected in the Datasets panel, you can double-click on a table in the Saved and predefined tables panel to open and modify it.

4. Open table button

Select a table in the Saved and predefined tables panel, then click Open table to use and modify the selected table. Alternatively, double-click on the table to open it.

5. Description panel

The panel on the right provides general information about TableBuilder.

When a dataset is selected in the first panel and there is further information available about the dataset or its predefined tables, the information displays in the description panel.

6. Header bar menus

When you first open your TableBuilder session, the Datasets menu (the home page) is the only available menu. When you are on other screens, you can click on this menu to return to the home page.

After you open a dataset an additional menu appears for Table view. You can select this menu to return to your table for the dataset you have most recently opened.

7. Search

Use the Search box in the top right corner to search across all datasets that you have access to. The results show all datasets that include the search term in any field, including:

  • dataset names
  • your saved table names
  • predefined tables
  • variables
  • categories
8. TableBuilder user guide

Access this user guide at any time by clicking on the question mark icon on the top right corner of the screen. The user guide opens in a new tab so you can click between the user guide and your session.

9. TableBuilder tour

The TableBuilder tour opens when you log into TableBuilder for the first time. You can take the tour again at any time by clicking on the three vertical dots menu in the top right of the screen.

10. Logging out
  • Log out is located at the top right of the screen in the three vertical dots menu.
  • Before logging out, save any data you want to retain.
  • Logging out completely closes your TableBuilder session. If you only close your browser or tab without logging out, your session stays active until it times out.

Predefined tables

Some datasets have tables that have already been created and are available to all users. These are known as predefined tables. If there are predefined tables available for a dataset, they are displayed in the middle panel of the TableBuilder home page when the dataset is selected in the first panel. They can also be accessed by opening a dataset and clicking on the 'Saved and predefined tables' tab at the top of the left panel.

Predefined tables can be used as a starting point and be further modified as required. Predefined tables can be saved or downloaded like any other table. 

1. For example, the Census TableBuilder Basic dataset 2016 Census - Employment, Income and Education has six predefined tables.

Census TableBuilder Basic dataset 2016 Census - Employment, Income and Education has six predefined tables available for users.

2. Double click on the 2016 Census Total Personal Income (weekly) by Sex predefined table to open a table showing State by Sex by Total Personal Income (weekly) variables.

Predefined tables open with variables already included

3. Queue the table to retrieve and download the data.

predefined table output

Session timeout

If there has been no activity in TableBuilder for 30 minutes, the session times out. The following message displays and you need to log in again to continue working. Any unsaved data is lost. 

TableBuilder session time out screen

Dataset help information

Access dataset information and data item lists, understand what is being counted in a table

Released
19/11/2021

i links

When a dataset is open, there are a number of ways to find out more information about the dataset and variables.

Information is available via the i link next to the dataset title in the Table view. 

  • For Census datasets, the i link opens Census Dictionary information.
  • For all other datasets, the i link opens the dataset's associated microdata publication. This includes the full data item list in the Data downloads section (or in the Downloads tab in older publications).

i links open in a new tab or window so you can switch between your table and the help information.

i link next to dataset name

Census variables also have variable specific information in the Census Dictionary. Click on the i link next to the variable name in the table to open the Census Dictionary description. Data quality information for Census variables can be found using the Data Quality Statements linked to corresponding entries in the Census Dictionary. These statements include information about non-response rates and any known data quality issues for each Census variable.

Age in five year groups example

Census variables and geographies

Confidentiality

To maintain the confidentiality of respondents and to ensure the output of quality data, some system restrictions have been implemented. These restrictions include:

  • not allowing you to download individual records
  • perturbing the output in your tables
  • preventing the cross-tabulation of certain variables

See Confidentiality and How the data is processed.

You need to agree to Conditions of use when using TableBuilder. The ABS may impose a limit on the maximum number of tables per user.

Understanding what is being counted in a table

The type of record you are counting is displayed at the top of the table.

Census datasets provide information about persons, families and dwellings. Select the appropriate dataset based on what you want to count. 

Examples of records that may be counted in Census or other TableBuilder datasets include:

  • households
  • families
  • people
  • motor vehicles
  • businesses
Default summation

Census of Population and Housing datasets

Place of usual residence - counting persons and families

This is the place where a person usually lives. It may or may not be the place where the person was counted on Census Night. Usual residence data is less likely to be influenced by seasonal factors such as school holidays and snow seasons, and provide information about the usual residents of an area. It is often used by government agencies when allocating funds to regions.

Place of enumeration (location on Census night) - counting persons, families and dwellings

Census place of enumeration is a count of every person in Australia on Census Night, based on where they were located on that night. This may or may not be the place at which they usually live. It includes people who are on long-distance trains, buses or aircraft, or on board vessels in or between Australian ports. It includes overseas visitors.

This type of count provides a snapshot of an area on Census night. Although the Census is timed to attempt to capture the typical situation, holiday resort areas such as the Gold Coast and snow fields may show a large enumeration count compared with the usual residence count.

Persons, 15 years and over

The Census also provides information about the working population. This consists of persons aged 15 years and over who were employed in the week prior to Census night. The data collected relate to all workers, regardless of the hours worked. The Journey to Work data on which this is based are used by transport authorities, associated bodies, organisations and other interested people to plan public transport systems, and for the development and release of residential and commercial land.

Building a basic table

Open a dataset, using and removing rows and columns, variables and categories

Released
19/11/2021

Open a dataset

On the TableBuilder home page, click the triangle to expand the folder to display the datasets that you have access to. Either double-click the dataset or select the dataset and use the New table button at the bottom of the panel to start creating a new table. 

Open a dataset

This opens the Table view where you can build and modify tables. There are two panels:

  • the left panel shows the variables and categories that can be added to your table
  • the right panel is where you build your table
Table view with an empty table

Add variables and categories to a table

Variables and categories

When a dataset is opened in Table view, the left panel shows a list of variables and categories included in that dataset that can be added to your table.

  • Variables (or data items) are characteristics about the records in the dataset. For example, Age or Indigenous status (variables) are characteristics about people (records). There may be multiple similar variables in a dataset, such as Age in single years and Age in 5 year groupings.
  • Categories are the responses to the questions that have been provided by the respondent. Each variable has multiple categories. For example, the categories of the variable Age in single years may be 0, 1, 2, 3 etc. Categories must be complete (include options for all possible responses) and mutually exclusive (not overlap).

Related variables are grouped together in folders. Click on the folders to view the available variables and categories.

Variables and categories

Show and hide left panel

In most cases, when you are in the Table view the left panel is already open. To hide the left panel select the < arrow at the top of the menu. To show it again select the > arrow.

Hide left panel

Hide left panel option

Show left panel

Show left panel option

Rows, columns, wafers and filters

To create a table, select a variable from the list in left panel and add it to the table in the rows, columns, wafers, or filters.

  • Rows are horizontal displays of data, with the row headings appearing down the left side of the table.
  • Columns are vertical displays of data, with the column headings appearing across the top of the table.
  • Wafers are where data is displayed in multiple layers of a table. This can be a useful option for including a time or geography variable for example. When tables using wafers are exported or downloaded to a spreadsheet, each wafer appears on a different tab (if you download in xlsx format). Wafers may also be called layers or sheets.
  • Filters are used to limit the data in a table to only display data for specific variable categories. For example, by including New South Wales in a filter, the table results displays counts for New South Wales only, rather than the whole of Australia. See Add and remove a filter.

Selecting variables and categories

There are three ways to select variables or categories to be added to a table:

  1. Open the variable folder in the left panel and click in the tick boxes for the categories. Use the Add to Row, Column, Filter or Wafer buttons at the top of the left panel. This option is useful for selecting a few categories of a variable. You can also use Shift-click to select multiple categories at once.
  2. Drag the variable or category name to the right. A pop-up menu appears with options for adding to Column, Row or Wafer. Dropping the variable onto one of these options selects all categories of the variable at once. Dropping a category adds that category only.
  3. Click the arrow at the end of the variable name to show the Select a level drop-down list. Click on the variable in the drop-down list to select all categories of the variable at once. Hierarchical variables may have multiple options for selection, e.g. Age in 10 year ranges, Age in 5 year ranges and Age in single years. Then use the Add to Row, Column, Filter or Wafer buttons at the top of the panel.

Using the 2016 Census - Cultural Diversity dataset we create a table with Age in Ten Year Groups in the rows and Registered Marital Status in the columns.

1. In the left panel, click the Selected Person Characteristics folder to expand the list of available variables.

2. Expand the Age in Ten Year Groups folder to see the list of categories.

3. Select the tick boxes next to the categories to be added to the table, in this example 20-29, 30-39, 40-49, 50-59.

Tick selected categories

4. Click the add to Row button.

Add variable to row

5. TableBuilder adds the selected categories to the table. Categories that are in your table are shown in bold in the left panel.

Add selected categories to table

6. When the first variable is added to the table, TableBuilder also adds a default summation (what the table is counting). For 2016 Census - Cultural Diversity dataset, the default summation is counting the number of persons at their place of usual residence. See Understanding what is being counted in a table and Summation options for continuous variables sections for more detail on summation.

default summation options

7. Next, add the Registered Marital Status variable to the column headings. Using the drag and drop shortcut, all the available categories in a particular variable can be added to the table. The Column, Row and Wafer pop-up menu appears. Drop onto Column.

Drag and drop onto the column option in the pop-up menu

8. TableBuilder adds all the available categories from Marital Status to the column headings.

Add categories to columns

Queue and download a table

1. Once you have finished building your table structure, you need to submit the table to the queue and then download it to see the data. Select a download format at the top right of the window. Tables can be downloaded in the following formats:

  • Excel 2007 (.xlsx) (max 16,384 columns x 65,000 rows and < 100,000 cells)
  • Comma Separated Value (.csv)
  • CSV string value (.csv)
  • SDMX Structure Definition (.xml)
  • SDMX Archive (.zip)
To choose a different dataset, click the Datasets tab in the blue navigation menu.
Select the format for your table to download

2. After selecting your preferred format, click one of the Queue table buttons.

queue table buttons

3. Enter a unique name for the table and click Queue table.

Do not use these characters in your table name as the table will not generate:

  • ? * < > / \ |
naming a queued table

4. TableBuilder displays a message that the request has been successfully added to the table queue. Your table data will be available for download once it has completed.

  • Small tables normally complete within a few seconds or a minute.
  • Larger tables may take several minutes.
  • Very large tables may take several hours.
queued table message

5. Your table has been queued but your table structure has not yet been saved. If you also want to save your table structure so that you can modify or queue it again it in the future, you also need to use the Save table button.

6. While a job is queued and processing, you can continue to work on other tables, or add more tables to the queue. You can also log out of TableBuilder and come back later. Your table continues running in the background. 

7. To check the status of your queued table, click on the Saved and queued tables link in the confirmation message at the top of the screen. Alternatively, go to the three dots menu in the top right of the screen, and select Saved and queued tables. Click refresh on your browser to update the queue status. Tables may have a status of:

  • Queued - table is waiting to be submitted
  • Running - table is being populated
  • Completed, click here to download - table is ready for you to download to see the data
  • Error - try resubmitting your table or contact microdata.access@abs.gov.au if you continue to have issues

8. From the Saved and queued tables view, you can also click on View to open a table structure again and make further changes.

saved and queued tables

9. When the table has the status of Completed, click here to download, the table has finished processing and can be downloaded. Tables can be downloaded any number of times until they expire after 28 days.

When you click the download link, your browser commences the download process. Large tables may take some time to download. Browsers may have different download functions, such as:

  • Chrome - downloads appear in the bottom left corner of the browser when the file starts downloading.
  • Edge - downloads appear in a dropdown menu in the top right corner of the browser when the file finishes downloading. If you are downloading a large table, you may not see any indication your browser is progressing your request until it has completed.
  • Firefox - downloads appear in a popup in the top right corner of the browser when the file starts downloading.
  • Safari - a popup appears confirming your download, then the downloaded file is available in the top right corner of the browser.
click the download link

10. Your table downloads in a zip file. You can open the table from the zip file or save it to your computer.

Excel example

downloaded table in excel

'Select a level' drop-down list

Another way to add a variable to a table is to use the 'Select a level below' in the drop-down list to quickly select all categories. This is useful when there are a large number of categories or for hierarchical variables.

1. Click the arrow to the right of the variable. A drop-down list displays. Main Statistical Area Structure (Main ASGS) is a hierarchical variable so there are multiple options (levels) that you can choose. These are always displayed in descending order, with the smallest categories last.

Select a level in the hierarchical variable

2. Selecting State from the drop-down list includes all the available categories at this level in the hierarchy. When the Main Statistical Area Structure variable is expanded you can see that TableBuilder has selected all the available categories at this level in the hierarchy. At the top of the hierarchy TableBuilder indicates the number of categories are currently selected (in this case, 9 categories).

Select all States

3. Click the Add to Row button. TableBuilder adds all the selected categories to the row headings.

4. Queue and download to view completed table.

Shift-click to select multiple variable categories

Another way to quickly select multiple categories is to use Shift-click. This selects all categories between your first and last selection. This example adds all categories of the Age variable from 0 to 18.

1. In the left panel, expand the Age variable and select the first category in your range (in this case, 0).

Select first category

2. Hold down the Shift key and click the last category in the range (in this case, 18).

Select last category

3. TableBuilder automatically selects all the categories in between.

All categories selected

4. Click Add to Row or Add to Column to add the categories to the table, or click and drag the selected categories to the right into the Column, row, wafer pop-up menu.

Move a variable to a different axis

To swap the columns, rows and wafers, drag and drop the variable names within the table.

1. Starting with a table with Sex in the rows and state in the columns, drag and drop the Sex variable name onto the column headings. Drop the variable once the column header area turns blue.

Drag and drop the SEXP variable

2. This adds Sex to the column headings. As there are now two variables in the columns, Sex and State are displayed as nested variables. For more information about nesting, see Add multiple variables to rows, columns or wafers.

Sex is now in the column headings

3. Now drag the State variable name onto the row. Drop the variable once the row header area turns blue.

State now being dragged onto the row

4. The table updates to show State in the rows.

State is now dropped onto the row

5. Variables can also be dragged and dropped to the Wafer area.

Dragging variables to the wafer section

6. The table shows Sex in the Wafer and State in the rows. For more information on wafers see Add a variable to wafers.

Table shows Sex in the Wafer and State in the row

7. Click on Queue table to populate your table and download your data.

Remove a variable

You can remove an entire variable from the table by dragging and dropping the variable name onto the Remove icon above the table. You can drag and drop variables to Remove from rows, columns or wafers.

1. Drag and drop the Marital Status variable name onto Remove.

Drag and drop a variable onto Remove to remove it from the table

2. TableBuilder removes the entire variable from the table.

Remove categories

Instead of removing an entire variable, you can use the Remove button at the top of the left panel to remove one or more categories. If categories that have been removed are subsequently re-added, they appear in the order that they were added, not their original order.

For example to remove all the categories of the Marital Status variable from the table:

1. Click the folder icon to expand Marital Status. The categories that are currently in the table appear in bold (in this case, all the categories are in the table).

Expand the folder

2. Select the tick boxes for the categories to be removed from the table (for example Not applicable)

3. Click Remove. TableBuilder removes these categories from the table.

Tick to choose a category to remove, then click Remove

Clear the table

You can remove all variables from your table by using the Clear table button.

1. Click the Clear table icon.

Click the Clear Table icon

2. TableBuilder confirms the deletion of the table. Click OK. TableBuilder clears the table.

Change datasets

To choose a different dataset, click the Datasets tab in the header menu. This returns you to the TableBuilder home page.

If you can't see the dataset you are interested in, your organisation may not have subscribed to that data series:

  • Check which datasets your organisation has access to in Registration Centre, using the same user ID and password that you use for TableBuilder.
  • To subscribe to additional data series, see How to access.
  • For a list of all data series and datasets, see Topics. 

Opening another dataset clears the current table. If you want to use the current table again, save the table before switching datasets.

Building advanced tables

Large tables, hierarchical variables, adding multiple variables, using wafers and filters

Released
19/11/2021

Large tables

When a table has more than 10,000 cells including totals, TableBuilder automatically enters Large table mode and displays a warning message.

Large table notification message

When in large table mode, TableBuilder displays a summary version of the full table, with only two categories displaying for each variable. A message indicating that you are working in large table mode and the cell count of the large table displays above the table. This shows the number of rows, columns, wafers and the total cell count. The largest table that can be built in TableBuilder is 40 million cells, including row and column totals and wafers.

Although you can only see part of the table, you can continue using table functions, such as adding and removing variables or categories from the rows, columns and wafers. In large table mode, dragging variables with a large number of categories from one axis to another (such as large geographical classifications) may take some time.

large table summary view

After you have queued your table, very large tables of several million cells may take some time to run, from 30 min to several hours. This depends on how complex your table is, the size of the dataset and the number of other users submitting small and large tables. If you submit a lot of very large tables, your tables are likely to complete more slowly. 

Hierarchical variables

Datasets may include variables that are represented as hierarchies. This is where there are different levels of a variable that can be displayed. Geographic variables are often available as hierarchical variables. Examples:

  • Greater Capital City Statistical Areas (GCCSA) contains a hierarchy of several levels, with STATE at the top level, GCCSA at the next level, and Statistical Area 4 (SA4) at the lowest level.
  • Age variable may contain 10 year groupings at the top level, with 5 year groupings at the next level, and individual ages at the lowest level.

The highest level of the hierarchical variable is always displayed first in the list, the next level is displayed second, and the most detailed level is last.

Select a level of a hierarchical variable

Beside each variable in the left panel of the Table view you can select the > button to see how many levels a variable includes. Selecting one of items in the Select a level below list selects all categories at that level. All categories for single level variables can also be selected this way.

Click on the > next to the variable name. Selecting SA4 here selects all SA4s in all States.

Select all SA4s in all states

Click on the > next to one of the State level categories. Selecting SA4 here selects all SA4s in that State only.

Select all SA4s in one state only

Click on the > next to one of the Greater Capital City Statistical Area (GCCSA) level categories. Selecting SA4 here selects all SA4s in that GCCSA only.

Select all SA4s in one greater capital city only

Changing the level of a hierarchical variable in a table

For hierarchical variables, drill down within the table. By clicking on the underlined category name, the next level down of the variable displays. For example, clicking on New South Wales displays the next level down: Greater Sydney, Rest of NSW, etc.

Showing a hierarchical variable GCCSA

Display of next level down for New South Wales.

Next level down for NSW

Collapse back up to the State level by clicking on the double arrow. This displays all categories for the higher level.

Collapse back up to state level

Add a variable to wafers

You can also add variables to the third dimension of a table - wafers.

1. Using our earlier example table, add the Country of Birth of Person variable to the wafer. Click and drag Country of Birth towards the table. Drop the variable onto Wafer. Alternatively, after selecting the categories using the > you can use the Add to wafer button at the top. A separate wafer (layer) for each country is added to the table.

adding a variable to a wafer

2. The wafer displays above the table. The wafer for all people born in Oceania is displayed. View the list of all categories in wafers using the Wafers drop-down menu.

Table with wafers showing available categories in dropdown list

3. Wafers are displayed differently in the downloaded table depending on format.

Excel 2007 displays wafers as individual sheets of the workbook.

wafers displayed in excel

CSV displays wafers consecutively on the first sheet.

wafers displayed in csv format

4. To remove a variable from the wafer, click on the X next to the wafer variable or drag the wafer variable to the Remove icon.

removing a wafer

Add multiple variables to rows, columns or wafers

You can add multiple variables to a table so that the variables are nested within rows, columns or wafers. Nesting is where multiple variables are on the same axis, such as Age and Marital status in the Row axis. The maximum number of variables that can be nested on an axis is 10 variables. This is also the maximum number of variables that can be included in a table. For performance reasons it is better to have less than 10 variables in your table, particularly for large classifications or datasets. 

Once you have created your table, you can drag variables to change the order of nesting within a row, column or wafer. You can also drag variables between the rows, columns and wafers to rearrange your table.

To nest variables in a table, add variables one at a time to the row, column or wafer. Variables can be added using the drag and drop method or the Add to Row, Column or Wafer buttons.

  1. Select Age categories between 15 and 29 years and Add to row.
  2. Then select Indigenous Status, and Add to row.
  3. Add Sex to column.
  4. The variables Age and Indigenous Status display as nested variables.
nested variables in table structure

Add and remove a filter

When filters are applied to a table, only records that match the filters are included in the results. Filters are an alternative to selecting and including specific categories in the table, and can easily be removed to show all categories again.

1. The following table shows Labour Force Status (LFSP) by State with no filters applied.

Labour Force Status (LFSP) by State with no filters applied

Excel 2007 table output with no filter applied

Excel 2007 table with no filters applied

CSV table output with no filter applied

CSV table with no filters applied

2. Select a single category and click Add to Filter.

Select a single category and click Add to Filter

3. TableBuilder adds the filter to the Filters list above the table.

TableBuilder adds the filter to the Filters list above the table

Excel 2007 output with filter for males

Labour Force Status (LFSP) by State Excel 2007 output with filter applied

CSV output with filter for males

Labour Force Status (LFSP) by State CSV output with filter applied

4. Additional variables can be added to the filter. However, only one category can be added per variable. For example Sex - Male and Sex - Female cannot both be added as a filter at the same time, but you can add Marital status - Married.

5. The following table has two filters added. The table now only includes individuals who are both Male and Married.

This version of the table has two filters added. With the addition of these filters, the counts in the table will now only include individuals who are both Male and Married

Excel 2007 output with two filters applied

Labour Force Status (LFSP) by State Excel 2007 output with 2 filters applied

CSV output with two filters applied

abour Force Status (LFSP) by State CSV output with 2 filters applied

6. To remove a filter, click the X next to the filter name.

To remove a filter, click the X next to the filter name

Cell counts, mesh blocks, sorting, totals and other table options

Cell counts, sorting, totals, labels, codes , zero suppression, displaying percentages and RSEs

Released
19/11/2021

Cell count

To see how large your table is, check the cell count above the table. This shows the number of rows, columns and wafers for all cells (total) and displayed cells. The displayed cell count may differ from the total cell count if row or column totals are not displayed. The largest table (including totals and wafers) that can be built in TableBuilder is 40 million cells.

Cell count showing 1 column, 22 rows and 1 wafers total

Using mesh blocks

Some Census TableBuilder Pro 2016 and 2021 databases include mesh block level detail, the smallest geographical unit used in TableBuilder. Mesh blocks to enable you to build your own custom geographic areas. If you want to display a geography in a table that is not already provided in TableBuilder, you can use mesh blocks to accurately approximate a large range of other statistical regions. See the Custom data section and Census mesh block counts for help in customising your own geographies and using mesh blocks.

Mesh blocks are ideal for building custom geographic areas. However, you may also want to add mesh blocks directly to your table. TableBuilder has a limit of adding 62,000 categories from any one variable to a table. As there are more than 62,000 mesh blocks in each of Australia, New South Wales, Victoria and Queensland you need to select a smaller geographic area when using mesh blocks. Because of the very detailed information, you may need to build a number of tables if you want to include mesh blocks as a variable in your table.

1. If you try to add all mesh blocks to your table, an error message is displayed indicating 'A maximum of 62,000 categories can be added to a table. 'Untick all' at the top of the variable panel and select fewer categories'.

Adding all mesh blocks to a table
Maximum number of categories warning

2. The number of items you currently have selected is displayed at the top of the left panel. TableBuilder stops selecting categories when it reaches the 62,000 limit. Before continuing, clear your current selection by clicking on Untick All.

Untick all variables

3. You can then select a smaller number of categories to build a table. This example shows all mesh blocks in South Australia being successfully selected.

Selecting all mesh blocks in South Australia

Mesh blocks are restricted from cross-tabulation with certain other variables, see Confidentiality for more information.

Sort table rows

Rows can be sorted using the double arrow next to the variable names. Rows are sorted alphabetically by the variable labels. If row categories are removed and then re-added to a table, they appear in the order they have been added, not their original order. Categories can be re-ordered by using the sort option. Row variables can be sorted either by their category labels or codes.

Use the double arrows shown against the row variable label to sort based on the row labels.

Sorting using the double arrows

Clicking the double arrow on row headings sorts based on the category names for that variable. You can toggle between:

  • ascending order
Sort table via ascending order using double arrow
  • descending order
Sort table via descending order using double arrow
  • default order
Sample of table in default order

Show or hide totals in a table

Hide totals

TableBuilder can automatically add totals to tables. Click on the three vertical dots menu next to the variable name to show or hide the total for the variable.

For certain variables it may not make sense to add totals, in which case the Totals option does not appear.

If you remove totals for very large tables this can improve the time taken to retrieve the data. However, if you plan to use totals, it is better to use the totals generated by TableBuilder rather than summing the interior cells after downloading your table. See Totals on the Confidentiality page.

Show totals

Click on the three vertical dots menu and select Total to turn the option on

Hide totals

Click on the three vertical dots menu and select Total again to turn the option off

Category labels and codes

By default, the category labels show the names of the categories (such as Divorced, Separated, Married for the variable Marital Status). By clicking the three vertical dots menu next to the variable name, you can choose to display the numeric category codes instead. This can be a useful option for large classifications or variables with long category labels, such as the Australian Statistical Geography Standard (ASGS).

Table displaying category labels

Click on Codes to switch numeric categorical mode on

Table displaying numeric category codes instead of labels

Table displaying numeric category codes instead of labels

Zero suppression

Zero suppression helps you reduce noise in tables to focus on the most relevant cells of the table. When zero suppression is enabled, TableBuilder automatically removes rows and columns that contain only zeros. This can be useful for large tables with many small and zero values, as it can reduce the size of the table significantly, making it easier to focus on the results.

To enable zero suppression, go to the Options menu at the top of the table and select from the Rows and/or Columns options.

Zero suppression options showing rows and columns selected

If wafers are included in a table, then TableBuilder determines whether to suppress a row or column by looking at the entire cube, not just the currently visible wafer. A row or column is only suppressed if it contains only zeros on all of the wafers. This means that rows and columns with all zero values still appear in the table if a row or column only contains zeros on the current wafer, but has values on at least one of the other wafers.

For example, this table can be reduced by enabling zero suppression for rows. TableBuilder automatically removes all the rows that have only zeros in them. 

Zero suppression turned off

Table with column and row counts for totals and display counts

Zero suppression turned on

Table with count of columns and rows

Percentages

Use the Option menu above the table to change the counts in the table to percentages. The percentages option can be set to show percentages for:

  • rows
  • columns
  • totals
  • no percentages (none)

Percentages are calculated differently based on the option selected.

Percentages are not supported when opening certain predefined tables that contain grand totals.

When downloading tables containing percentages, the percentage symbol is only displayed in Excel format downloads. Other formats such as CSV include the percentage value but do not show the percent symbol (%) after the value.

Percentages options menu

Row percentages

Replaces the values in the table with a percentage of the total in each row.

Row percentages example

Column percentages

Replaces the values in the table with a percentage of the total in each column.

Column percentages example

Total percentages

Replaces the values with a percentage of the grand total. If you are using wafers then this shows the total percentage across all the wafers.

Total percentages example

No percentages

Selecting none removes percentages from the table and reverts back to counts.

No percentages example

Relative standard error

Where relative standard error (RSE) data is available for a table, this data is included in the downloaded table. Some datasets, including Census datasets, do not have RSEs. RSEs are only applicable for sample and weighted data for survey-based datasets that are subject to sampling variability. For help interpreting RSEs, see Relative standard error.

RSEs are presented differently depending on download format of table.

Excel: downloads include RSE data in a separate Excel worksheet (tab).

Excel data in separate excel tab

CSV: downloads include a separate column for RSE data.

CSV: downloads include a separate column for RSE data.

CSV data showing RSE

SDMX: RSE data is represented as an attribute value in the SDMX Generic Data observation element. This attribute is only added when the dataset is weighted and has RSE values in the associated data cube. 

RSEs SDMX view

Annotations in downloaded tables

Annotations provide additional information or notes about features or aspects relating to the data or dataset. If the table contains annotations they are included in the downloaded table.

Excel:

  • Annotation symbols in the table cells on the first worksheet
  • Annotation details in footnotes under the table

CSV:

  • Annotation symbols in a separate column
  • Annotation details immediately after the table data

SDMX: 

  • SDMX downloaded at the dataset level contains dataset level annotation descriptions and symbols in the <Annotations> ... </Annotations> section of the XML.
Example of annotations in a CSV download
Sample CSV output with annotations and suppressions

Search and save

Using search and saving tables

Released
19/11/2021

Searching in TableBuilder

There are two ways to search within TableBuilder:

  1. across all datasets and tables that you have access to: search box at the top right of all screens
  2. within a selected dataset: search box at the bottom left of the dataset you have open

Search across all datasets and tables

Use the search box in the top right corner to search across all datasets and tables. The results are presented by type:

  • dataset
  • table (your saved tables and predefined tables)
  • variable
  • category

TableBuilder displays results from all the datasets you have access to.

The results return in a table format with the following columns: 

  • Item - indicates in which dataset or table the search term has been found
  • Type - indicates the type of result: dataset, table, variable, category
  • Location - indicates the path to locate the search term

Navigate your search results

Click on a result in the panel on the right to open that item.

To return to the search page and continue with the same search results, use the back button on your browser toolbar.

Use the Filter tick boxes on the left panel to narrow down the results:

  • by dataset - display only specified folders or datasets
  • by type - display only specified dataset, table, variable or category
  • if no filters are ticked, results display for all datasets
Search results from searching across all datasets and tables

If your search term returns a large number of results, TableBuilder only displays the first 2,000 results per type (dataset, table, variable or category). In that case, the search may show no results for other datasets that also include the search term. Try refining your search to a more specific term so that your search includes all results.

Search results with more than 2000 results per type

All datasets search error

Some searches may get stuck on the "loading" screen and not return any results. To continue working in TableBuilder you need to:

  1. Close the tab or window where you are working in TableBuilder using the x. You may not be able to use the log out option.
  2. Clear your browser cache. For Edge and Chrome, use Ctrl+Alt+Del to open the clear cache options. Other browsers may have different ways to access the cache options.
  3. Navigate back to the log in page and enter your credentials.
  4. Try a different search term, or use the other search option: search within a selected dataset (see below).
Search error stuck at the loading screen

Search within a selected dataset

In addition to searching across all the available datasets, you can also search within the currently selected dataset. In the Table view, the Dataset search is at the bottom of the left panel.

Use the search box to display variables and categories that include your search term:

  • Type your search term and either click Enter on your keyboard or click the triangle next to the search box
  • Searching is not case sensitive
  • You can search for a whole or partial word or for multiple words
  • The number of results within the open dataset is shown below the search box
  • The first result in the variable folder structure is displayed in the left panel
  • Use the arrows below the search box to navigate through the results - the single arrows display the next or previous result, the double arrows display the first or final result
  • Click the X button to clear your search and revert to the full list of available variables

Census datasets that include mesh block may take a long time to display search results. You may prefer to search using the 'all datasets' search function (top right) and use the filter to limit the results to the dataset you are interested in. Use the back button on your browser toolbar to return to the search results after viewing each selection.

Search results within a dataset

Save tables

Saving a table

You can save the tables you create in TableBuilder:

  • Once saved, the tables are available the next time you log in.
  • Saved tables are only visible and accessible by the person who created the table.
  • Queuing a table does not save the table structure, although you can access previously queued table again for up to 28 days.
  • Saved tables remain in your profile until you delete them.

1. Once a table has been created, click on the Save table button above the table.

Save button

2. Enter a name for the table and click Save. The name of the table must be unique and no longer than 255 characters.

Table name to be saved

Open a saved table

There are three ways you can access your saved tables:

1. From any screen in TableBuilder, click on the Saved and queued tables option in the three vertical dots menu at the top right of the screen. This opens the main saved tables view where you can see all your saved tables across all datasets. From this view you can open any of the saved datasets, even if you have a different dataset open in the Table view.

Open a saved table via the Saved and queued tables option in the three vertical dots menu at the top right of the screen
Saved tables list

2. From the home page, select the dataset that you used to create your table so that all saved and predefined tables associated with the selected dataset appear in the middle panel of the home page. For this view, you can only see the saved tables for the selected dataset. 

Open a saved table via home page middle panel

3. From the Table view page, click on the Saved and predefined tables tab at the top of the variables panel on the left. For this view, you can only see the saved tables for the open dataset.

Opening a saved table from the Saved and predefined tables tab in the Table view

4. Select the table and click Open or double-click the saved table.

Open the saved table

5. If a table is currently open, any unsaved table content will be lost. The table you are opening will replace the currently active table.

Managing saved tables

The main view for Saved and queued tables is accessed via the three vertical dots menu in the top right corner. In the Saved tables panel on the left there are options to open, copy, delete and rename saved tables.

To open a saved table:

  1. Select the tick box next to the table
  2. Click Open

To create a copy of a saved table:

  1. Select the tick box next to the table to be copied
  2. Click Copy
  3. A copy of the saved table is created called 'saved table' or 'saved table1' etc, which you may rename.

To delete a saved table:

  1. Select the tick box next to the table to be deleted
  2. You can select one or more tables
  3. Click Delete
  4. Click OK to confirm the table or tables to be deleted
  5. Tables cannot be retrieved once they are deleted

To rename a saved table:

  1. Select the tick box next to the table to be renamed
  2. Enter a new name in the text box
  3. Saved table names must be unique
  4. Click Rename
Open, copy, delete or rename a saved table

Custom data

Create, edit, download and upload your own custom variable groupings

Released
19/11/2021

Create and save a custom data group within TableBuilder

You can create your own grouping of categories within a variable. These are also known as 'recodes'. Custom groups can be saved in TableBuilder or downloaded and shared with other users for uploading. Custom data is useful if you want to create your own classification or load more recent electoral boundaries. Once you create your grouping, you can add it to a table like any other variable.

You can only combine categories from one variable or one level of a variable. You cannot create a new custom data group using:

  • two or more original variables, such as Sex and Age - an error is displayed if you try to add more than one variable
  • categories from two different levels of a hierarchical variable, such as NSW and Melbourne - TableBuilder allows you to build and save a multi-level hierarchical variable, but does not allow you to add it to a table

To start creating your custom data, click on the Custom data button at the bottom of the left panel in Table view.

1. This example uses the 2016 Census - Cultural Diversity dataset. Click on the Custom data button.

Select the Custom data tab to create custom groups of values

2. In the Step 1 panel, select the categories you want to group together, then click on the double arrows to add them to the panel on the right.

For example, to create a group of States using Main Statistical Area Structure (Main ASGS), select the States from the list and click  »» 

Selecting required ASGS then moving them to step two

3. The selected categories now appear in the Step 2 panel on the right. After adding all the categories you need, click Save.

Requested ASGS has moved to step two

4. Enter a name for your new custom group and click Save.

Enter a custom name and click save

5. TableBuilder adds the new group to the My custom data list in the left panel of the Custom data view.

My Custom Data list

6. Your saved custom data group is now available in the left panel of the Table view. Custom variables are found with the original variable as pictured below.

Custom Geographies in 2021 Census datasets
Custom group in variables

7. The custom group can be added to a table.

Custom groups added to table

8. You can edit a group that you have created previously. However, if you have used your custom group in a saved table, the old version of the group will continue to display in the table. To update to the new version, you need to remove and re-add it to the table.

Download a saved custom data group

You can download a Custom data group you have built in TableBuilder to share with other users.

1. In Table view click on the Custom data button at the bottom of the left panel.

Custom data tab

2. In the My custom data panel, select the tick box next to the group to be downloaded and click the Download button.

Download custom data

3. Depending on the browser, the file either saves to the default downloads folder, or a prompt appears to save or open the file. For example:

Downloaded prompt on edge

4. The custom group is downloaded in a Comma Separated Values (CSV) format, and you can edit it outside TableBuilder or share it with other users. They will need to have access to the same original dataset to be able to use your custom data.

Download a classification to edit outside TableBuilder

You can download a whole classification to edit outside TableBuilder. This option is useful for very large classifications, such as geographies, or where you would like to use a TableBuilder classification to build your own classification outside TableBuilder

1. This example uses 2016 Census - Main Statistical Area Structure (Main ASGS) (UR). Click on the Custom data button on the left panel in Table view. Then select the whole classification you are interested in using the single arrow > at the end of the variable name. In this example, SA2 is selected. Click on the double arrow »» to move the selected classification to the second panel.

Selecting SA2 fow download

2. Once the classification has loaded, it may display over more than one page. You can view other pages using the page navigator below Step 2 panel. Click the Save button.

Save the contents

3. Choose a unique name for your classification. 

Save custom data

4. In the My custom data panel on the left, select the tick box next to the group to be downloaded and click the Download button.

Download SA2

5. Depending on the browser, the file either saves to the default downloads folder, or a prompt appears to Save or Open the file. For example:

Download prompt on Edge

6. The custom group downloads in a Comma Separated Values (CSV) format, and can be edited outside TableBuilder.

Edit a downloaded custom data group outside TableBuilder

When a custom group is downloaded as a file in Comma Separated Values (CSV) format, the file can be opened and edited in a text editor or application such as Excel. It is important to be careful when editing a saved custom groups file in Excel, as it may make changes to the data that will prevent the file from opening in TableBuilder again. For example, Excel may strip leading zeros from codes in the file, such as ValueCode, which will not allow the data to be loaded back into TableBuilder. It is best to use a text editor instead, such as UltraEdit, to upload the new group.

A downloaded custom group opened in a text editor.

Notepad

A downloaded custom group opened in a spreadsheet.

Excel extract

The first row contains the headings, and each subsequent row represents a single category in the custom variable group. The heading row must not be edited or the file cannot be uploaded to TableBuilder.

Rows can be added, edited or removed (except the header row) to change the composition of the group.

Upload a custom data group

Custom group files that have been created or edited in your own system or shared from other users can be uploaded into TableBuilder.

To upload a custom group:

  • You must have access to the dataset that the custom group was created in.
  • The dataset that relates to the custom group must be open.
  • Upload files must be in CSV format.
  • The structure of the custom group file must be retained using the same column headings.
  • The name of the group in the saved file must not be the same as an existing custom group. TableBuilder displays an error if a custom group with the same name as an existing group is attempted to be loaded. Delete the existing custom group, rename it, or rename the group saved in the file (by changing the value of the GroupName in the final column).
  • Only one saved group can be uploaded at a time.

1. To load a custom group from a file, open the dataset that was used to create the recode, and click on the Custom Data button at the bottom of the left panel in the Table view.

Custom data tab

2. In the My custom data panel, click the Upload button.

Upload button

3. Browse to the location where you saved your custom group file and select the file. When uploaded, TableBuilder adds the new group to the My custom data panel.

Custom group file uploaded

4. If there is a problem with the upload, an error message is displayed.

Common errors when uploading a custom data group:

Custom Data Upload Errors and Their Explanations
ErrorExplanation
| Upload error. 61 out of 65 lines successfully imported. A values code or name is not found.The ValueCode column, which is the numeric code for a variable name, may be missing leading zeros. Check if the classification you have edited includes leading zeros.
| Upload error. 0 out of 1,464 lines successfully imported. A group with this name already exists.The Custom Data group has previously been uploaded or the name has already been used. You will need to change the value of the GroupName in the final column to load the file.
| Upload error. 0 out of 1,464 lines successfully imported. A tables code or name is not found.The upload file doesn't match the dataset that is open. You will need to open the matching dataset to load the file. If you already have the correct file open, the information in the FactTableCode or FactTableName may be incorrect. You can check what this should be by downloading any custom data from the same dataset.
| Uploaded file has invalid CSV header. Expecting column names FactTableCode, FactTableName, FieldCode, FieldName, ValueSetCode, ValueSetName, ValueCode, ValueName, GroupName but read [, FactTableName, FieldCode, FieldName, ValueSetCode, ValueSetName, ValueCode, ValueName, GroupName]The header row contains an error. Check the header row in your file to ensure it has the correct names, as listed in the examples pictured above.
The requested URL was rejected. Please consult with your administrator.This message may be caused by a number of different actions. In this context it may be caused by trying to load an incorrect file type, such as an XLS. Only CSV files can be used when uploading Custom Data Groups.
No error but file does not upload.Your upload file may be too large. The maximum upload file is 20 million bytes (19.07MB).


Upload Commonwealth and state electoral divisions and local government areas

Commonwealth electoral divisions (CED), state electoral divisions (SED) and local government areas (LGA) boundaries change over time. ABS has prepared upload files to assist users to update the boundaries available within Census TableBuilder.

TableBuilder upload files for CEDs, SEDs and LGAs are available for use with Census 2016 datasets:
Australian Statistical Geography Standard (ASGS): Volume 3 - Non ABS Structures (see Downloads tab)

Earlier boundaries are also available using SA1s for use with Census 2011 datasets:
2016 Commonwealth Electoral Divisions
2012 Commonwealth Electoral Divisions

1. Download CSV file from the Downloads tab in Australian Statistical Geography Standard (ASGS): Volume 3 - Non ABS Structures and save it to your computer.

Census ASGS download

2. Files are available for Australia and for each state and territory. These files are suitable for use with the following 2016 Census of Population and Housing - TableBuilder Pro datasets:
2016 Census - Counting Persons, Place of Enumeration (MB) - compatible files are annotated with en (enumeration)
2016 Census - Counting Persons, Place of Usual Residence (MB) - compatible files are annotated with ur (usual residence)

File formats compatible with TableBuilder

3. Log into TableBuilder and open the dataset you are interested in. This example uses 2016 Census - Counting Persons, Place of Usual Residence (MB).

  • Click on to the Custom data button on the left panel of the Table view.
  • Click the upload button at the bottom left of the screen.
Upload button

4. Find the location where the CED files have been saved and select the region you are interested in (Australia, state or territory). This example uses 2020_lga_act_ur_csv.

Excel example

5. When the upload has completed, a message appears on the right to confirm the number of rows that have been loaded from the CSV file (not including the heading row). The uploaded custom data appears in the My custom data panel under Custom Geography. If you receive an error when uploading a file, check the errors and causes listed in the Upload a custom data group section above. 

Upload complete

6. In the Table view tab the custom data you uploaded appears under the Custom Geography folder. You can select multiple tick boxes at once by holding down the Shift key to add the NSW CEDs to a table.

Table view for custom data

Summation options for continuous variables

How to use summation options and ranges for continuous variables

Released
19/11/2021

Summation options

Understanding what is being counted

When you open a dataset and build a table, most datasets display the default summation above the table. This tells you what you are counting in your table. For example, your table may be counting persons, families, households, or motor vehicles. Some datasets also allow you to choose a summation option where you can vary what the table is counting. For example, a dataset may include options for counting number of drinks of alcohol consumed or number of kilometres travelled. 

The i link next to the default summation provides further information about what is being counted for the default summation.

For tables that do not use the default summation, an annotation displays below the table indicating what is being counted.

Click on the information i link for more information about the Default Summation

Categorical and continuous variables

Some datasets include categorical variables only while other datasets also include continuous variables.

Categorical variables have limited discrete responses, such as State/Territory or Marital status.

Continuous variables can take any numerical value and can be measured. In TableBuilder continuous variables may have options to calculate sum, median, mean or ranges.

In TableBuilder, some variables may be included as both categorical or continuous. For example:

  • Age may be categorical, where you can select specific ages to include in your table, and continuous, where you can calculate the median age for a population.
  • Income may be provided as a categorical variable in set ranges, such as $0-$499, $500-$999 etc, and may also be provided as a continuous variable, where you can create your own custom ranges, including decimal places.

Please note that both Census TableBuilder Basic and Census TableBuilder Pro do not include continuous variables.

Calculations for median, mean and sum cannot be applied to variables in these datasets within TableBuilder. 

Summation options functions

Datasets that include continuous variable functions have a Summation options folder at the top of the variable list panel on the left of the Table view. Summation options control what is being measured in the table. If a summation option is not added to the table or if there is no summations options folder, TableBuilder automatically adds the default summation option for that dataset.

Summation options allow you to calculate the following functions for continuous variables:

  • sum - add all responses, such as total number of drinks consumed for a population
  • median - the midpoint of the frequency distribution
  • mean - average
  • ranges - create your own custom intervals

For example, instead of counting the number of males and females who consume alcohol, you can display the total number of standard drinks consumed by males and females. For survey data, this is weighted based on population estimates.

A table that includes a sum, median or mean for a continuous variable only includes those records in the dataset that have a valid value. For example, records with responses for the continuous variable such as 'N/A' or 'Did not respond' are excluded. The records that have valid responses for a variable are determined for each individual cell of the table, including total cells. For further information about valid values, see Interpreting sums, means and medians.

Add a sum, median or mean to a table

1. Click on Summation options at the top of the left panel in Table view. Summation options are only visible for datasets that include continuous variables.

2. Select one of the sum, median or mean tick boxes and Add to row, column or wafer. In this example, the Sum of Number of standard drinks by day has been added to row.

Sample of adding a sum, median or mean to a table

3. Only one sum, median or mean can be added to a table at a time:

  • If you try to add a second sum, median or mean to a table that already includes one, TableBuilder automatically removes the existing one and adds the new one.
  • If you try to add more than one summation at the same time by ticking more than one of sum, median or mean, TableBuilder displays a error message "Only one summation option can be added to a table"
Following message will appear if you try to add more than one Summation Option to each table

4. The Weighted sum of Number of standard drinks by day has been added to the row.

Weighted sum of Number of standard drinks by day added to Row

5. Other variables can be added to the table. The variable Sex is added to column, and the table is queued and downloaded. This table displays the Weighted sum of Number of standard drinks by day, which is 59 million standard drinks for all males in Australia and 28 million for all females.

Results shown where the sum option was selected in the Summation Option

6. To display the median or mean Number of standard drinks consumed instead of the sum, select the new option from the summation options on the left, and Add to row again. This automatically replaces the summation option currently in the table.

Selecting the Median or Mean Number of standard drinks consumed will replace the Summation Option currently in the table.

7. After downloading the table, the Weighted median Number of standard drinks by day was 3.2 drinks for Males, 2.2 drinks for Females and 2.8 drinks for all persons.

Results shown where the median option was selected in the Summation Option

8. Similarly, when the Weighted mean Number of standard drinks by day is added to the row, it automatically replaces the median. The Weighted mean of Number of standard drinks by day was 4.7 drinks for Males, 3.1 drinks for Females and 4.0 drinks for all persons. The mean is calculated based on the population of people who have a valid response, and does not include people who do not drink or children. See Interpreting sums, means and medians for more information about valid responses for continuous variables.

Results shown where the mean option was selected in the Summation Option

9. If all Summation Options are removed from the table, TableBuilder automatically adds in the Default summation option back into the table. If the weighted mean is removed from the above table, by dragging it into Remove, TableBuilder confirms that 'Removed all the summation options from the table. Your table is now using the default summation option, listed in the Filter'. In this case, the table has reverted to counting Selected persons.

When the Summation Options are removed from the table, TableBuilder will automatically adds in the Default summation option

Interpreting sums, means and medians

Estimates of sums, medians, means and ranges for continuous variables must be interpreted carefully. You should read the entry for the continuous variable in the data item list for the dataset, checking the population and the 'special response' categories.

A continuous variable on a dataset has an associated range of 'valid value' responses, and also may have various categories of response that are 'special', for example a special response may be 'Not applicable' or 'Not stated'. These special responses may occur for a variety of reasons, such as the relevant question does not apply to certain records, or the information is unable to be determined. Read the dataset documentation and data item list for detailed information. To open the website dataset information, click the i link at the top left next to the dataset name when in Table view. This opens in a new tab so you can continue working in TableBuilder.

Whenever a sum or mean is included in a table for a continuous variable, the statistic is estimated for the variable's reference population with a valid response.

A continuous variable that does have possible special responses appears in two different sections of the variables list panel:

  • as a selectable summation option (continuous variable)
  • as a categorical variable under the relevant grouping

The version that appears as a categorical variable contains categories for each of the special response types, and one for 'valid' responses. You can use this variable for population estimates of the various special response types (such as 'No Response'). It is highly recommended when interpreting a table of means or sums of a variable that the corresponding categorical variable be used in separate tabulations of population counts.

When interpreting a table of median estimates, it is also important to understand the population for which the estimate applies, and the valid responses. If there are a small number of records making up a cell's reference population with a valid response, the cell may be suppressed, showing a value of '0' or 'np'. The suppression occurs to prevent the release of disclosive information. The relative standard error (RSE) for each median estimate is estimated using the Woodruff method, which is a replicate weight method. Further information is available in the Relative standard error section.

1. When working with sum, median and mean, check the data item list for the dataset to see the population to which the variable applies. 

  • Access the data item list via the i link next to the dataset name in the Table view.
  • You can also access data item lists via the relevant publication on the Topics page.
To access the data item list in a dataset, click on the information i icon.
Sample download of the TableBuilder Data item list

3. Using the earlier example, open the National Health Survey, 2017-18 dataset and search for Number of standard drinks consumed using the search box in the lower left corner. This finds two results in the variables list.

  1. a continuous variable (summation option)
  2. a categorical variable that can be used to find the number of records that recorded a valid response, and that were used to calculate the mean.
Sample search result for Number of standard drinks consumed using the search box function

4. If a table is created using Sex and the categorical version of Number of standard drinks consumed, the weighted number of persons whose responses contributed to the sum and mean are displayed. This table is now counting persons in thousands (000's). The categorical variable for Number of standard drinks consumed provides estimates of the size of the population to which the above sum, median and mean are calculated. It also provides the sizes of the populations to which it does not apply, for example, the category 'Have never consumed alcohol', which also includes people under the age of 15 years.

There were weighted counts of 5.8 million males and 4.5 million females whose responses were included in the sum and mean. An incorrect result would have occurred for mean if the persons who did not consume any alcohol were recorded as consuming a valid value of 0 standard drinks.

Sample output with default summation

Ranges

Continuous variables on a dataset usually allow you to create ranges to include in your table. Ranges allow you to create groups of a consistent size that can summarise your data. For example, Age ranges can be created from Age in single years to create 10 year groupings.

Categorical variables can also be grouped using Custom data, where you can create groups of a consistent size, such as 10 year groupings, or groups that suit your analysis, such as 15-17 years, 18-29 years, 30-49 years and 50+.

When using a ranges variable in a table, the ranges span all valid values for that variable. The table does not include records which did not provide a valid response for that variable. Even if all the categories within a ranges variable are added to a table, the grand total of the table may therefore be less than the total population due to records without a valid value being excluded. See Interpreting sums, means and medians for more information about valid responses for continuous variables. You should also read the entry for the continuous variable in the data item list for the dataset and check the population, and the 'special response' categories. Information about each variable's population is available in the dataset's data item list on the ABS website. To open the website dataset information, click the i link at the top left next to the dataset name when in Table view. This opens in a new tab so you can continue working in TableBuilder.

Creating ranges

1. In the left panel, open the Summation options folder to select the continuous variable to be put into ranges. Click on the Range button.

Creating Ranges in the Summation Options

2. The Ranges screen appears.

  • Enter a name for the range (no longer than 25 characters).
  • Enter the minimum and maximum values for your range in To and From.
  • When selecting the From and To values, select less than \(<\) or less than or equal to \(\le\) in the drop-down menu to choose whether to include the lower boundary or upper boundary in each range.
  • Enter an increment for each range - this is the size of each range category that will be created. 
Customising the ranges

3. If values are selected outside the allowable range values, TableBuilder displays information about the minimums and maximums you can select. You can use this information to help you decide on appropriate range parameters. Click Next.

Additional information will display if values are selected outside the allowable range values.

4. The ranges to be included are displayed. Edit by clicking Back or continue by clicking Create.

Display of the ranges to be included.

5. This creates your range, and adds it to a new Ranges folder in the variables list panel in the Table View below the Summation options folder. Click on the Ranges folder to view your range. The Ranges variable is now saved and can be used to a table now or for future tables using this dataset.

Click on the Ranges folder to view your range.

6. Custom ranges can be added to a table like any other variable, by dragging and dropping, or using the Add buttons at the top of the left panel.

Sample of custom ranges added

Copy and delete ranges

1. To copy or delete a ranges variable, open the Ranges folder below the Summation options folder in the left hand panel. Click the Manage button next to your variable.

To clone or delete a Range variable, find the Ranges folder and click the Manage button next to the variable

2. The Ranges management screen opens.

Ranges Management dialogue box opens up

3. To copy a range, click the Copy button. The Ranges screen opens with the parameter values for the existing Ranges variable entered. Change the parameters and rename the range, then clicking the Next button to continue to create the new range. 

4. To delete a range permanently, click Delete. A confirmation screen opens showing items that you have created using this range:

  • any groups you have created (using Custom data
  • any tables you have saved

Clicking OK deletes these groups and tables as well as the ranges variable. 

Confirmation screen where you're deleting a range permanently

Confidentiality and relative standard error

Perturbation and interpreting tables with small cells, sparsity and relative standard errors

Released
19/11/2021

In accordance with the Census and Statistics Act 1905, all the data in TableBuilder is subject to a confidentiality process before release. This confidentiality process is undertaken to avoid releasing information that may allow for the identification of particular individuals, families, households, dwellings or businesses. For further details of how the ABS handles your information, see the ABS privacy policyCensus privacy policy and TableBuilder Privacy Impact Assessment.

Cross-tabulation restrictions

System restrictions have been implemented which prevent the cross-tabulation of certain variables within several datasets.

These restrictions have been applied to:

  • maintain the confidentiality of respondents
  • ensure the output of quality data
  • assist users by not allowing combinations of variables that statistically should not be combined.

When the restriction is triggered the following error message will be displayed: "The variable you are trying to add cannot be used with one of the variables already in the table.”

These restrictions are applied at the system level and can not be bypassed, though other similar variables may be available. For example, if you are using geographical areas from Mesh Blocks, you may be able to use another geographical area variable instead.


Perturbation

To minimise the risk of identifying individuals in aggregate statistics, a technique has been developed to randomly adjust cell values. Random adjustment of the data, known as perturbation, is considered to be the most satisfactory technique for avoiding the release of identifiable data while maximising the range of information that can be released. These adjustments have a negligible impact on the underlying pattern of the statistics.

Perturbation is applied across all non-zero cells in a table, including the totals cells. Perturbation may change the true cell value by either increasing or decreasing the value by a small amount. Within this context, although cells may appear to contain none, or all, of a relevant sub-population, this is not necessarily a reflection of the true value of the cell. These adjustments result in introduced random errors, but with almost no bias. The information value of the table as a whole is not significantly impaired.

Random perturbation can be a source of frustration to users, as it can result in inconsistencies in the data. Most tables reporting basic statistics do not show significant discrepancies due to random perturbation. However, as the degree of complexity of tables increases, the need for random perturbation remains and it will continue to be used in most TableBuilder datasets.

Totals

In TableBuilder, totals are not calculated by summing the interior values of the table. Instead, more accurate totals are provided by calculating the true total, and then perturbing this value. If you attempt to reconstruct a total on the basis of the perturbed interior cells, you are adding together the small changes made to each cell which may result in a large change relative to the perturbed total. It is recommended that totals are constructed in TableBuilder, rather than by summing the interior cells from an exported table.

Small cells

When calculating proportions, percentages or ratios from cross-classified or small area tables, the introduced random error can be ignored except for small cells. The introduced random adjustments made to cells in a table are independent of the size of the original cell value, so perturbation has the greatest relative impact on small cell values. The information value of the table as a whole is not impaired as small cell values are also strongly affected by other factors, such as sampling error, respondent errors and processing errors.

Small cells may not be reliable, as not enough records have been selected in the sample to accurately estimate the population for that combination of characteristics. To continue working, you can try creating a variant of the original table. For example, removing a Not applicable category may reduce the number of small cells in the table. Possible methods to improve reliability of the table include:

  • removing one or more variables
  • removing one or more categories
  • using a less detailed level of a hierarchical variable
  • creating a custom range to combine less relevant categories.

Caution should be exercised when interpreting and using cells with small values or large percentage Relative standard error (RSE) values. RSEs are provided for survey-based datasets that are subject to sampling variability. Datasets including the full Census of Population and Housing are not weighted so RSEs are not applicable. 

When analysing a table of means or sums for a continuous variable, it is recommended that the table be compared to the corresponding table of counts of records with a valid response for that continuous variable. No reliance on estimates of means or sums should be placed on cells with a large RSE or for which the corresponding cell count is small. For more information, see the Summation options for continuous variables section.

Further information

Relative standard error

Some datasets, such as censuses of a population, are not weighted so the relative standard errors (RSE) do not apply and are not available in TableBuilder. RSEs are available for sample-based datasets that are subject to sampling variability. Refer to the TableBuilder section of each dataset's publication for information on reliability of estimates within these datasets. Publications for each TableBuilder dataset can be accessed from the Topics page, or within TableBuilder, click the i link at the top left next to the dataset name when in Table view. This opens in a new tab so you can continue working in TableBuilder. RSEs will automatically included in any downloaded table.

Sources of variability

There are two sources of uncertainty or variability associated with survey estimates that are released by TableBuilder. The first source of variability is due to sampling and the second is due to random adjustment of cell values.

Variability due to sampling

Since the estimates from surveys may be based on information obtained from a sub-sample of usual residents of a sample of dwellings, they are subject to sampling variability. They may differ from those that would have been produced if all usual residents of all dwellings had been included in the survey.

Most weighted datasets in TableBuilder measure this component of variability using the group Jackknife method.

These datasets use the Bootstrap method:

  • Employee earnings and hours
  • Motor vehicle use
  • Road freight movements

Variability due to random adjustment

The random adjustment of totals and subtotals introduces another source of variability into the estimates. As these adjustments are generated in a predictable way the impact they have on estimates can be measured directly.
 

Standard errors

The variability due to sampling and random adjustment is combined into a single measure called the standard error (SE). The standard error indicates the extent to which an estimate might have varied by chance, because only a sample of dwellings was included, and by random adjustment.

There are about two chances in three that a sample estimate differs by less than one standard error from the number that would have been obtained if all dwellings had been included and there was no random adjustment. There are about 19 chances in 20 that the difference is less than two standard errors. Another measure of the likely difference is the relative standard error (RSE), which is obtained by expressing the standard error as a percentage of the estimate.


\(RSE\%(x)=\left(\frac{SE(x)}{x}\right)*100\)


RSEs of proportions and percentages

Proportions and percentages formed from the ratio of two estimates are also subject to sampling errors. The size of the error depends of the accuracy of both the numerator and denominator. For proportions where the denominator is an estimate of the number of persons in a group and the numerator is the number of persons in a sub-group of the denominator group, the formula to approximate the RSE is given below. The formula is only valid when x is a subset of y.


\(RSE\left(\frac{x}{y}\right)\cong\sqrt{RSE(x)^2-RSE(y)^2}\)


For proportions where the denominator and numerator are independent estimates, for example a ratio of rates relating to two separate populations such as Indigenous and Non-Indigenous, the formula to approximate the RSE is given below. The formula is only valid when x and y are estimated from separate independent populations, and when the RSEs on x and y are small.


\(RSE\left(\frac{y}{x}\right)\cong\sqrt{RSE(y)^2-RSE(x)^2}\)


Standard errors may also be used to calculate standard errors for the difference between two survey estimates (numbers or percentages). The sampling error of the difference between the two estimates depends on their individual standard errors and the relationship (correlation) between them. An approximate standard error of the difference between two estimates (x-y) may be calculated by the following formula:


\(SE(x-y)\cong\sqrt{SE(x)^2+SE(y)^2}\)


While this formula is only exact for differences between separate and uncorrelated characteristics of subpopulations, it is expected to provide a reasonable approximation for most differences likely to be of interest in relation to this survey.

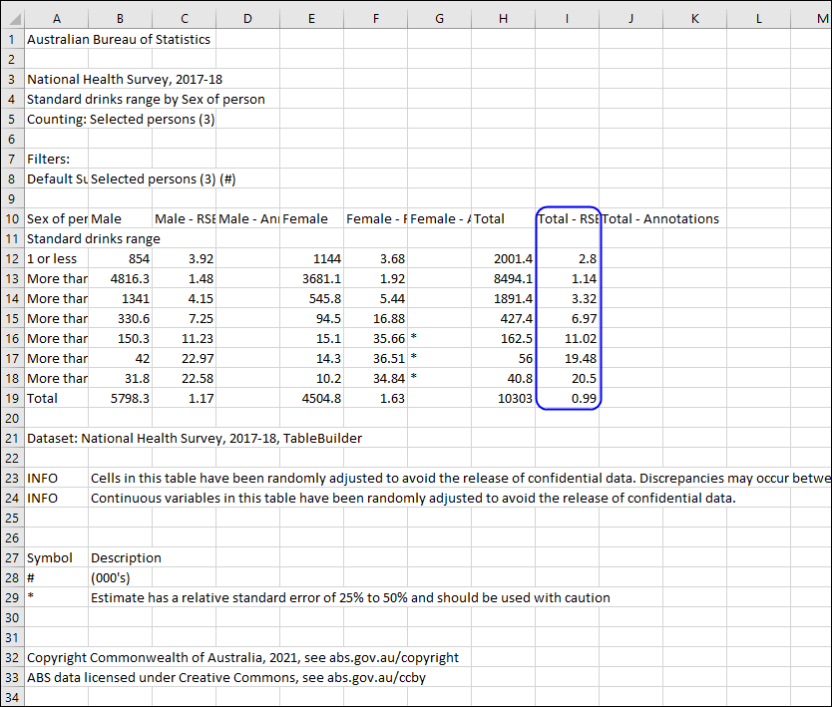
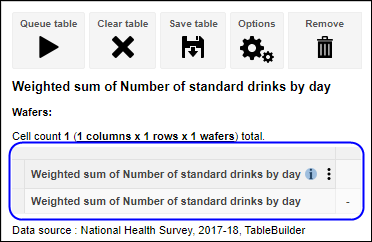
In TableBuilder, it is the RSE of a percentage that is displayed, from which the standard error may be calculated. For example, if the estimated proportion is 30% with an RSE of 20%, then the standard error for the proportion is 6%.

In some cases, the formula for the approximation of the RSE of a proportion may be unsuitable to use because the RSE of the numerator is very close to, or below, the RSE of the denominator. In this case the RSE is suppressed. It is recommended to use the alternative formula below to calculate the RSE of the proportion if this occurs.


\(RSE\left(\frac{x}{y}\right)\cong\sqrt{RSE(x)^2+\left(1-\frac{2x}{y}\right)*RSE(y)^2}\)


Standard errors of means and sums

The estimates of means and sums of continuous variables are subject to sampling variability and random adjustment. As for population estimates, the variability due to sampling and random adjustment is combined into the calculated Standard Error, and the relative standard error is reported. The component of variability arising from sampling is calculated using either the Jackknife or Bootstrap method, depending on the dataset.

Standard errors of quantiles

The estimates of quantiles such as medians, quartiles, quintiles and deciles are subject to sampling variability and random adjustment. As for population estimates, the variability due to sampling and random adjustment is combined into the calculated Standard Error, and the relative standard error is reported. The component of variability arising from sampling is calculated using the Woodruff method. This is also true for Equal Distribution Quantiles.

Reliability of estimates

Estimates with RSEs of 25% or more are not considered reliable for most purposes. Estimates with RSEs greater than 25% but less than or equal to 50% are annotated by an asterisk (*) to indicate they are subject to high standard errors and should be used with caution. Estimates with RSEs greater than 50% have their RSE suppressed in order to prevent the release of confidential data, and are annotated by a double asterisk (**). These estimates are considered too unreliable for general use. Occasionally an estimate of RSE may be suppressed and displayed as ‘np’ (not published). This occurs because the RSE cannot be estimated reliably, and in this case the RSE should be interpreted as being greater than 50%.

Excel downloads include small red arrows which indicate an annotation for cells that are asterisked

Types of warnings and suppressions for RSE

Excel downloads include np and RSE percentage data in a separate RSE Excel worksheet (tab)

Types of warnings and suppressions for RSE

CSV displays asterisk, np and RSE percentage data within the same sheet as the counts data

Types of warnings and suppressions for RSE

Non-sampling error

The imprecision due to sampling variability and random adjustment should not be confused with inaccuracies that may occur because of imperfections in reporting by respondents and recording by interviewers, and errors made in coding and processing data. Inaccuracies of this kind are referred to as non-sampling error, and they may occur in any enumeration, whether it be a full count or a sample. Every effort is made to reduce non-sampling error to a minimum by careful design of questionnaires, intensive training and supervision of interviewers, and efficient operating procedures.

Sparsity

Some datasets have an additional quality measure called sparsity applied to tables with too many small cells. Sparsity does not apply to most Census of Population and Housing datasets.

Small cells may not be reliable, as not enough records have been selected in the sample to accurately estimate the population for that combination of characteristics.

In this example table showing Country of Birth (using the most detailed level of this hierarchical variable) by Social marital status, an error is located at the bottom of the spreadsheet. 

Sparsity error

To continue working, you can try creating a variant of the original table. For example, removing a Not applicable category may reduce the number of small cells in the table and allow the data to be retrieved. Possible methods to reduce the size of the table include:

  • removing one or more variables
  • removing one or more categories
  • using a less detailed level of a hierarchical variable
  • creating a custom range to combine less relevant categories.

For this table, the Marital status categories of Not applicable and Married in a defacto marriage were removed. Then the full Country of birth variable was replaced with all categories within Oceania and Antarctica, still at the most detailed level of this hierarchical variable. This table was able to be retrieved.

No sparsity error

Troubleshooting

Getting access, troubleshooting tables, data and system performance

Released
19/11/2021

Access

How do I access TableBuilder

Register in the ABS Registration Centre to access datasets in TableBuilder.

  • You automatically get access to basic datasets (free) by registering
  • If you register with your organisation email address, and your organisation is already registered, you also automatically get access to Census TableBuilder Pro (free) and any other datasets your organisation has access to

How much does TableBuilder cost

  • Basic datasets are free, including Census TableBuilder Basic and Businesses in Australia
  • To access Census TableBuilder Pro (free) you need to join your organisation in the Registration Centre - contact microdata.access@abs.gov.au if you are not automatically joined to your organisation when you register
  • Other datasets can be accessed upon application - microdata.access@abs.gov.au

I have forgotten my password/user ID

Select the forgotten password or user ID link on the TableBuilder log in page and follow the prompts.

If you have forgotten which email you registered with or your secret question and answer, contact microdata.access@abs.gov.au.

I cannot log in with my email address

TableBuilder user ID is a number. If you have forgotten your user ID, click on forgotten user ID from the TableBuilder log in page.

How do I update my personal details

Log into the Registration Centre using the same user ID and password that you use for TableBuilder.

You can update:

  • your address
  • phone number
  • secret question/answer

You can also see which organisation you are a member of and see all the data series that you have access to.

How do I update my email address

Your email address must match your organisation, and this can only be updated by an ABS staff member.

If you have changed your email address because you have changed organisations, ABS will remove you from your old organisation and add to your new organisation. This will give you access to your new organisation's subscribed paid products.

Using your new email account, email microdata.access@abs.gov.au with:

  • your name
  • the names of your former and current organisations
  • your old email address
  • your user ID number

If you have changed your email address because you have changed your name, email microdata.access@abs.gov.au using your new email account with:

  • your former and current names
  • the name of your organisation
  • your user ID number

Can I share my log in details with colleagues or friends so they can access ABS registered products

No, you must not share your password with anyone

  • Each user needs to register individually in their own name
  • You have agreed to Conditions of use that you will not share your access credentials with any other person, including other people in your organisation
  • Additional organisation users can access your organisation's paid subscriptions for free
  • If users or organisations are found to have breached the conditions of use, access may be revoked

I cannot see the dataset I want to use when I log into TableBuilder

  • Your organisation may not have subscribed to the data series you are trying to access. Check which datasets your organisation has access to in Registration Centre
  • Subscribe to additional data series in How to access

Tables

Why do I have to queue my table and why are graphs, maps and quantiles no longer available?

The ABS regularly reviews its security position in an ever-evolving cyber environment to ensure the best safeguards are in place for the data we hold. In our latest review, we identified an update needed to provide greater data protection.
Some changes have been made to the way that table data is retrieved. This has been necessary to ensure the security and privacy of data. You will still be able to access the same data as before and all your saved tables and custom groups will still be available.

In the updated version of TableBuilder, when you create a table, you submit your table to the queue and it will be populated with data and returned to you for download, rather than having it returned on screen. This is similar to the previous process used to generate large tables. This process is likely to take less than a minute for small tables, several minutes for large tables and an hour or longer for very large tables. 

As data is returned in downloads rather than on screen, the following functions are no longer available:

  • quantiles
  • graphs
  • maps

Why did my table download as a CSV

The default download format is CSV, you can choose your preferred download format in the top right corner before you queue your table. 

If you queue a table in XLSX format and then open the table outline using the view link from the Saved and queued tables view the default format will be set to CSV. You can change the format before you re-queue the table. 

What are the largest tables I can create in TableBuilder

Tables can be up to 40 million cells, including totals and wafers. Very large tables may take several hours to populate depending on the size of the table and other tables in the queue.

  • Excel 2007 has a limit of 16,384 columns x 65,000 rows and less than 100,000 cells.
  • use CSV to download larger tables

How can I reduce the size of a large table

Options to reduce the size of your table include:

  • Remove categories that you may not be interested in, such as Not applicable categories.
  • Turn off totals - this does not change the size of your large table but can improve the time it takes to populate the table. However if you are planning to use totals, you should use the totals generated within TableBuilder rather than summing the interior cells. See also Totals on the Confidentiality page.
  • Group categories together that you want to include but do not need to view separately, by creating a Custom data group.

How can I display my table more effectively

There are a number of options to improve your displayed table layout. These do not affect your total cell count for Large table mode.

  • Hide totals, by clicking on the three dots menu beside each variable within your row headings and unticking Total.
  • Select Zero suppression for rows and/or columns in the Options menu. This hides rows or columns where all cells are zeros. If you are using wafers, then this option hides rows or columns where all cells are zeros across all wafers, so rows or columns of zeros may appear in some wafers.

I can't add mesh blocks to my table

TableBuilder has a limit of adding 60,000 categories from any one variable to a table. As there are more than 60,000 mesh blocks in each of Australia, New South Wales, Victoria and Queensland you need to select fewer geographic categories when using mesh blocks. If you have already ticked too many mesh blocks, click untick all to start again.

You are also unable to add mesh blocks to tables in combination with certain variables, see Confidentiality for more information.

Why do I have dashes in my table

A table outline preview is available within TableBuilder. To see the data for your table, queue and download your table.

Can I upload my table back into TableBuilder

No, you can only save tables in TableBuilder and then open them in a later session.

You can share and upload custom data variables that you have created either inside or outside TableBuilder.

After editing or sharing a custom group, upload is not working

There are a number of errors that can occur when Uploading custom data including:

  • leading zeros have been dropped when editing in Excel
  • reusing an existing custom data group name
  • not having access to the right dataset, or not having that dataset open when uploading
  • errors in the header row
  • loading a file type other than CSV
  • file is too large (greater than 20MB)

My table with nested variables on a row, column or wafer is causing problems

Nested variables (multiple variables nested on one row, column or wafer) can cause issues for some TableBuilder functions. Nesting up to 10 variables is possible for some variables but may cause performance issues. Nesting fewer variables is recommended, particularly for large classifications

Data

Which geographic areas and variables are available in TableBuilder

Data item lists for each dataset available in TableBuilder datasets are available via TableBuilder topics and Available microdata.

In TableBuilder in the Table view, the i links next to each dataset name link to the associated web information and data item list.

Is Census data before 2006 available in TableBuilder

No. TableBuilder includes Census data from 2006 onwards. See Historical Census Data for earlier data.

Can I create my own variables and classifications to use in a table

  • Multiple variables cannot be combined to create a new variable. For example, Age and Sex cannot be merged to create a single variable. However, filters can be used to display certain categories only. For example, Sex=Male and Age=17 can be added as filters to a table so that the data in a table applies only to male 17 year olds. See Add and remove a filter.
  • You can create a new category by collapsing an existing variable categories. For example, Age categories in single years can be collapsed to create a new category for 0-17 year olds. See Custom data.
  • You can also upload your own variable classifications. New classifications must use existing variable categories within TableBuilder. For example, a new geographic classification that has been constructed using mesh blocks can be uploaded to TableBuilder. See Custom data.

Why do I have only zeroes in my downloaded table

There are several reasons this may happen:

  • Sparsity settings may prevent your table from displaying data. Some datasets have an additional quality measure applied to tables with too many very small cells. This measure is particularly relevant to survey datasets and has not been applied to Census TableBuilder datasets. Very small cells of a table using survey data may not be reliable, as not enough records have been selected in the sample to accurately estimate the population for that combination of characteristics. A sparsity error appears below the table where this has occurred.
  • The ABS sometimes releases 'shell tables' in advance of releasing a dataset, to allow you to become familiar with the variables and structure of the dataset and to set up and save tables for future use. If your table includes variables that have not been released yet in the dataset you are using, it shows zeros.
  • There may be an outage with the TableBuilder system. If the issue is not caused by sparsity or shell tables, report the issue by emailing microdata.access@abs.gov.au.

How does perturbation affect my results

Perturbation is applied across all non-zero cells in a table, including the totals cells. Perturbation may change the true cell value by either increasing or decreasing the value by a small amount. This introduces almost no bias. However, small cells may change by a large amount in proportion to the true value, and therefore should not be relied upon. Other factors also affect the reliability of small cells, such as sampling error, respondent errors and processing errors. 

Why don't the interior cells in my table add up to the totals displayed

All non-zero cells in tables are subject to perturbation, a small adjustment made to cell values, including totals, to protect the confidentiality of the data. In TableBuilder, totals are not calculated by summing the interior values of the table. Instead, more accurate totals are provided by calculating the true total, and then perturbing this value.

Why is there sometimes a large difference between the sum of the interior cells and totals displayed

Perturbation makes small changes to all estimates including both the interior cells of the table and the totals. If you attempt to reconstruct a total on the basis of the perturbed interior cells, you are adding together the small changes made to each cell which may result in a large change relative to the perturbed total. It is recommended that totals are constructed in TableBuilder, rather than by summing the interior cells from an exported table.

Can I create medians and means in TableBuilder

Summation options for continuous variables, such as sums, medians and means can be created in TableBuilder for continuous variables. Some datasets, such as Census TableBuilder, contain only categorical variables. To create medians and means for categorical variables, download the data into a spreadsheet to generate these formulas.

Performance

TableBuilder is timing out

TableBuilder times out when no action has been taken for 30 minutes. Log in again using your user ID and password.

When I submit a table to queue, it takes a long time to return

The time it takes for the system to process and return your table depends on size of your table and the number of other tables in the queue.

  • Small tables normally complete within a few seconds or a minute.
  • Larger tables may take several minutes.
  • Very large tables may take several hours.

Check the Saved and queued tables screen (via the three dots menu at the top right) to see if your table has finished processing.

Click refresh on your browser to update the queue status. 

If your large table has still not returned after 24 hours, contact microdata.access@abs.gov.au.

My download does not appear to be progressing or is taking a long time

  • Different browsers have different functions and speeds to download tables. Not all browsers show progress while downloading.
  • Very large tables may take a several minutes to download even though they have been zipped. 

My downloaded zip file is empty

Some special characters cause queue issues and your zip file will be empty when it completes. Do not use these characters when naming your queued table:

  • ? * < > / \ |

It takes a long time to add a new variable to my table

While working in a large table, it can be slow to drag variables between rows, columns and wafers. This may happen for:

  • large datasets
  • large variable classifications with hundreds or thousands of categories.

When I search all datasets my results are incomplete

The all datasets search (top right corner) returns a maximum of 2000 results per type of result:

  • datasets
  • tables (saved or predefined)
  • variables
  • categories

If your search exceeds 2000 for one of these search types, TableBuilder displays (2000+) in red in the bottom left corner against that type. You can:

  • refine your search to a more specific term to return complete results
  • use the dataset specific search to view results for that dataset only - open the dataset you are interested in and use the dataset search in the bottom left corner

When I search all datasets TableBuilder is stuck at the loading screen

For some searches, your search may get stuck at the loading screen, and not return your results. To resolve this error, follow the steps to close the session and clear the cache.

In Custom data, is there a limit on the number of areas that can be included in my custom geographic area

There is no limit on the number of areas that can be included for your custom group. However, when you are editing very large number of areas the system may slow down.

An error message box is displayed asking you to contact your administrator

If you get an error 'The requested URL was rejected. Please consult with your administrator.' you need to provide details of the actions you were performing in TableBuilder when the error occurred. Send the details to microdata.access@abs.gov.au.

TableBuilder takes a long time on the log in page or when I open TableBuilder

There is a known issue with some browsers where the 'processing' blue circle appears even though no action is underway. Move your cursor so that this disappears and you can continue working.

Why can't I add my summation option using click and drag

There is a known issue if you tick median or mean and then try to drag the summation variable onto column, row or wafer pop up, TableBuilder gives you an error:

Only one summation option can be added to a table

To add median or mean use the add to row, column or wafer buttons at the top of the left panel instead. 

Adding sum to your table is not affected by this error.  

Why is my queued table returning an error

There is a known issue for some summation variables where the queued table results in a status of error. We are working with the software provider to resolve this issue.

Try a different summation variable or contact microdata.access@abs.gov.au.

I am having a technical problem with TableBuilder, how do I report this

If you are not able to resolve your query through the help provided in this guide, email microdata.access@abs.gov.au.

If you would like assistance to analyse your table results, submit a Consultancy services request form. This is a charged service.