Australian Aboriginal and Torres Strait Islander Health Survey: Biomedical Results

This is not the latest release View the latest release

Information on biomarkers of chronic disease and nutrition, including cardiovascular disease, diabetes, kidney function, iodine, and vitamin D

Reference period
2012-13 financial year
Released
10/09/2014

Key statistics

  • One in ten (11.1%) Aboriginal and Torres Strait Islander adults had diabetes
  • One in four (25.0%) Aboriginal and Torres Strait Islander adults had high cholesterol
  • The Aboriginal and Torres Strait Islander adult population was iodine sufficient, with a population median urinary iodine concentration of 135.0 μg/L

Key findings

This publication presents information from the National Aboriginal and Torres Strait Islander Health Measures Survey. This survey is the largest biomedical survey ever conducted for Aboriginal and Torres Strait Islander Australians. Around 3,300 Aboriginal and Torres Strait Islander adults (aged 18 years and over) across Australia took part and voluntarily provided blood and/or urine samples, which were tested for a range of chronic disease and nutrient biomarkers.

At the national level, the results showed that:

  • One in ten (11.1%) Aboriginal and Torres Strait Islander adults had diabetes. This comprised 9.6% with diagnosed diabetes and 1.5% with diabetes newly diagnosed from their test results.
  • A further 4.7% were at high risk of diabetes according to their blood test results.
  • Two in three (65.3%) had at least one risk factor for cardiovascular disease, that is, they were taking cholesterol-lowering medication or had one or more of high total cholesterol, lower than normal levels of HDL (good) cholesterol, high LDL (bad) cholesterol or high triglycerides.
  • Nearly one in five (17.9%) had signs of chronic kidney disease.

It was also revealed that for Aboriginal and Torres Strait Islander adults:

  • Around half (53.1%) with diabetes also had signs of chronic kidney disease.
  • Two in five (38.9%) with diagnosed diabetes were effectively managing their condition, that is, they had an HbA1c test result of 7.0% or less.
  • A quarter (25.0%) had high cholesterol, but only around one in ten (9.1%) of this group were aware they had it.

The survey also found striking differences across remoteness areas. When compared with those in urban areas, Aboriginal and Torres Strait Islander adults in remote areas were:

  • Two and a half times as likely to have signs of chronic kidney disease (33.6% compared with 13.1%).
  • Around twice as likely to have diabetes (20.8% compared with 9.4%).
  • Five times as likely to have newly diagnosed diabetes (4.8% compared with 0.9%).
  • Less likely to be effectively managing their diabetes (25.1% compared with 43.5%).

Finally, when compared with the non-Indigenous population (and after adjusting for age differences), Aboriginal and Torres Strait Islander people were:

  • More than three times as likely to have diabetes (rate ratio of 3.3).
  • Twice as likely to have signs of chronic kidney disease (rate ratio of 2.1).
  • Nearly twice as likely to have high triglycerides (rate ratio 1.9).
  • More likely to have more than one chronic condition, for example having both diabetes and kidney disease at the same time (53.1% compared with 32.5%).
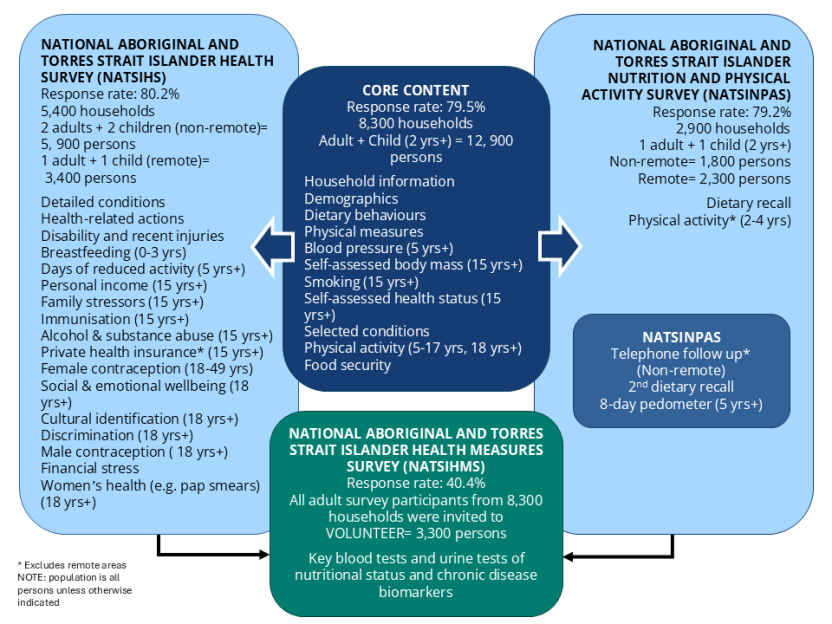
About the National Aboriginal and Torres Strait Islander Health Measures Survey

Diabetes

Diabetes is a chronic condition where insulin, a hormone that controls blood glucose levels, is no longer produced or not produced in sufficient amounts by the body[1]. If left undiagnosed or poorly managed, diabetes can lead to coronary heart disease, stroke, kidney failure, limb amputations or blindness[2]. In 2012, diabetes was the second leading cause of death for Aboriginal and Torres Strait Islander people. The age standardised death rate for diabetes was seven times higher for Aboriginal and Torres Strait Islander Australians compared with non-Indigenous Australians[3].

The NATSIHMS provides an objective measurement of the number of Aboriginal and Torres Strait Islander people with diabetes in Australia. It included two tests to measure diabetes: a fasting plasma glucose test and a glycated haemoglobin test (commonly referred to as HbA1c).

Fasting plasma glucose measures the level of sugar in the person's blood at the time of testing. Participants were required to fast for 8 hours prior to the test in order to get an accurate reading. HbA1c, on the other hand, measures what the person's average blood glucose level has been in the previous three months. Participants were not required to fast for this test. A set of cut-offs are used for each test to determine whether a person has diabetes or is at high risk of diabetes. The cut-offs used in the NATSIHMS are shown below.

Cut-offs for diabetes in the NATSIHMS
 Fasting plasma glucose (mmol/L)(a)HbA1c (%)(b)
Has diabetes≥7.0≥6.5
At high risk of diabetes6.1 to <7.06.0 to <6.5
No diabetes<6.1<6.0
  1. Based on the World Health Organization (WHO) cut-offs for fasting plasma glucose[4].
  2. An HbA1c level of greater than or equal to 6.5% is the WHO recommended cut-off point for diabetes[5].

Measuring diabetes - definitions

Diabetes prevalence

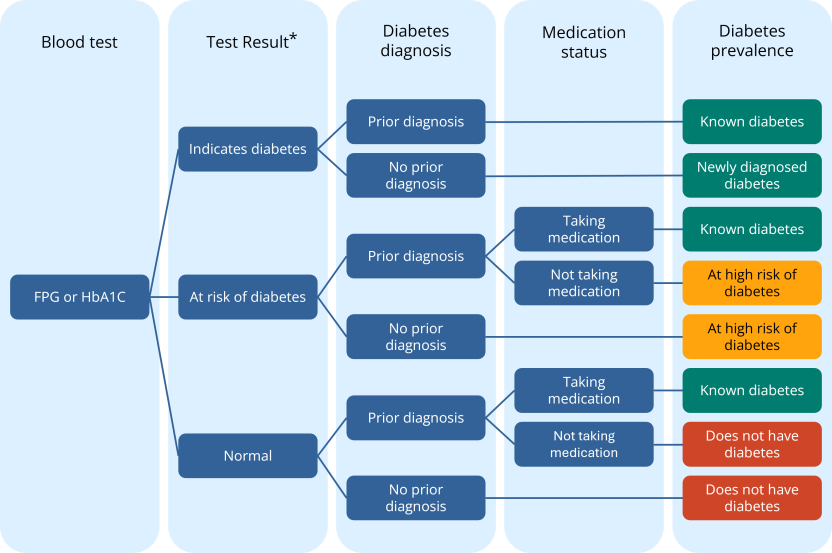
Diabetes prevalence was derived using a combination of blood test results and self-reported information on diabetes diagnosis and medication use. See the Measuring diabetes - definitions section for a detailed description.

Data source and definitions

Fasting plasma glucose is the current standard test for diabetes diagnosis in Australia. The information on diabetes in the following sections is based on fasting plasma glucose results only. Information on diabetes prevalence using glycated haemoglobin (commonly referred to as HbA1c) test results, which is a non-fasting test, is shown in Tables 1, 3, 4, 5, 6, 7 and 17 in the Data downloads of this publication.

In order to get an accurate reading for the fasting plasma glucose test, participants were required to fast for 8 hours or more beforehand. The results presented here refer only to those who did fast (approximately 78% of adults who participated in the NATSIHMS).

In 2012–13, just over one in ten (11.1%) Aboriginal and Torres Strait Islander adults had diabetes. This comprised 9.6% with known diabetes and 1.5% with diabetes newly diagnosed from their test results. This indicates that there was approximately one newly diagnosed case for every six diagnosed cases. A further one in twenty (4.7%) Aboriginal and Torres Strait Islander people had an impaired fasting plasma glucose result, which indicates that they were at high risk of diabetes. This means that there was an extra two people at high risk of diabetes for every six people who had been diagnosed.

Diabetes was twice as common among Aboriginal and Torres Strait Islander people living in remote areas in 2012–13. Around one in five (20.8%) Aboriginal and Torres Strait Islander people in remote areas had diabetes compared with around one in ten people in non-remote areas (9.4%). This difference was particularly pronounced for newly diagnosed diabetes, which was five times as high in remote areas than in non-remote areas (4.8% compared with 0.9%).

After taking age differences into account, Aboriginal and Torres Strait Islander people were more than three times as likely as non-Indigenous people to have diabetes. They were 3.6 times as likely to have known diabetes and twice as likely to have newly diagnosed diabetes. They were also nearly twice as likely to be at high risk of diabetes.

Diabetes prevalence among Aboriginal and Torres Strait Islander people steadily increased with age. Rates were especially high among those aged 55 years and over, with around one in every three people in this age group having diabetes (34.5%). A further 7.5% of those aged 55 and over were at high risk of diabetes.

Although this overall age pattern was similar to non-Indigenous Australians, diabetes tended to occur at earlier ages for Aboriginal and Torres Strait Islander people. For example, the rate of diabetes for Aboriginal and Torres Strait Islander people aged 35–44 years (9.0%) was on par with that for non-Indigenous people aged 55–64 years (8.2%). Likewise, the rate for those aged 45–54 years (17.8%) was similar to that for those aged 65–74 in the non-Indigenous population (15.0%). This pattern was apparent for both known diabetes and newly diagnosed diabetes.

One of the major risk factors for developing diabetes is obesity, as excess body weight can interfere with the body's production of, and resistance to, insulin[6]. The Australian Aboriginal and Torres Strait Islander Health Survey showed that four in every ten (39.8%) Aboriginal and Torres Strait Islander people were obese. In 2012–13, Aboriginal and Torres Strait Islander people who were obese were around seven times as likely as those of normal weight or underweight to have diabetes (17.2% compared with 2.4%).

Many Aboriginal and Torres Strait Islander people with diabetes also had signs of other chronic conditions. For example, diabetes had very high co-morbidity with kidney disease, of which diabetes is the major cause[7]. Around half (53.1%) of all Aboriginal and Torres Strait Islander people with diabetes had signs of chronic kidney disease in 2012–13. This was significantly higher than the corresponding rate in the non-Indigenous population (32.5%).

Diabetes was also associated with higher rates of cardiovascular disease. Six in ten (60.5%) Aboriginal and Torres Strait Islander people with diabetes had lower than normal levels of HDL (good) cholesterol compared with 32.9% of those without diabetes. They were also around twice as likely to have high triglycerides (45.1% compared with 20.7%). Rates of liver disease as measured by GGT were also much higher among those with diabetes (42.0% compared with 20.0%), as were rates of anaemia (19.3% compared with 5.9%).

For more information on diabetes prevalence, see Tables 1, 3, 4, 5, 6, 7 and 17 in the Data downloads of this publication.

Diabetes management

Glycated haemoglobin (HbA1c) is used to measure how well a person is managing their diabetes. This test gives an indication of the person's average blood glucose levels over the previous three months. The optimum management target for HbA1c for people with diabetes is a level of 7.0% or less. Maintaining this level decreases a person's risk of developing a range of complications from their diabetes, including problems with their circulation, kidneys, eyes and feet, and lowers the risk of heart attack and stroke. There is also a range of other optimum targets for Type 2 diabetes management, including those for cholesterol levels, Body Mass Index (BMI) and blood pressure[2]. These are listed in the Data source and definitions box below.

Data source and definitions

In the NATSIHMS, information on diabetes management is presented for those with known diabetes. See the Measuring diabetes - definitions section for information on how this population is defined. The information in this section is based on fasting plasma glucose results only. Information on diabetes management using glycated haemoglobin (commonly referred to as HbA1c) test results is shown in Table 15 in the Data downloads of this publication.

Goals for optimum diabetes management, as defined by the 2014–15 General Practice Management of Type 2 Diabetes[2] are as follows:

  • Fasting blood glucose levels between 6.0 and 8.0 mmol/L
  • HbA1c levels less than or equal to 7.0%
  • Total cholesterol less than 4.0 mmol/L
  • HDL 'good' cholesterol greater than or equal to 1.0 mmol/L
  • LDL 'bad' cholesterol less than 2.0 mmol/L
  • Non-HDL cholesterol less than 2.5 mmol/L
  • Triglycerides less than 2.0 mmol/L
  • Albumin creatinine ratio (a test relating to level of kidney damage) less than 3.5 mg/mmol for women and less than 2.5 mg/mmol for men
  • Urinary albumin excretion less than 20 mg/L
  • Blood pressure less than or equal to 130/80 mmHg
  • 'Normal' Body Mass Index (i.e. a BMI score of between 18.5 and 24.9)*
  • Non-smoker
  • Normal healthy eating**
  • Alcohol intake less than or equal to 2 standard drinks per day**
  • At least 30 minutes of physical activity per day, most days of the week (total greater than or equal to 150 minutes per week)**
  • Immunisation against influenza, pneumococcal disease, diphtheria, tetanus, and pertussis**.

* The Guidelines do not specifically prescribe a normal BMI but rather a ‘healthy’ weight loss goal. Normal BMI is used for this data item as the survey only collected body mass at one time point. The previous guidelines (2012) also prescribed a normal BMI.

**Note information on normal eating habits, immunisation, alcohol and physical activity targets have not been included in this release, as data for these variables are not available for all persons in the NATSIHMS. However, some of this information can be sourced from the NATSIHS component.

In 2012–13, around two in five (38.9%) Aboriginal and Torres Strait Islander adults with known diabetes were effectively managing their condition, that is, they had an HbA1c test result of 7.0% or less. Overall, Aboriginal and Torres Strait Islander women were more likely than men to be managing their diabetes (47.0% compared with 28.1%).

Based on the HbA1c target, Aboriginal and Torres Strait Islander people with known diabetes were less likely than their non-Indigenous counterparts to be managing their condition (38.9% compared with 55.9%).

As shown in the previous chapters, rates of known diabetes were particularly high for Aboriginal and Torres Strait Islander people living in remote areas (16.0% compared with 8.5% in non-remote areas). Yet people in remote areas were far less likely than those in non-remote areas to be effectively managing their condition (25.1% compared with 43.5%).

Whilst HbA1c is a good indicator for monitoring diabetes, controlling other aspects of health such as blood lipids (fats) and kidney function levels also decreases the risk of diabetes related complications[8]. In 2012–13, just over half (56.9%) of all Aboriginal and Torres Strait Islander adults with known diabetes met the management target for triglycerides and almost half (44.4%) met the target for albumin creatinine ratio (ACR), which measures levels of kidney damage. However, Aboriginal and Torres Strait Islander people were still less likely than non-Indigenous people to meet these targets, particularly for ACR (44.4% compared with 71.0%).

For more information on diabetes management see Table 14 in the Data downloads of this publication.

Cardiovascular disease

Cardiovascular disease remains one of the leading causes of death worldwide. In 2012, ischaemic heart diseases, which include angina, blocked arteries of the heart and heart attacks, were the leading cause of death for both Aboriginal and Torres Strait Islander people and non-Indigenous Australians. However, the age-standardised death rate for ischaemic heart diseases was nearly twice as high for Aboriginal and Torres Strait Islander people as that for non-Indigenous Australians[3].

The main indicators of cardiovascular disease that were measured in the National Aboriginal and Torres Strait Islander Health Measures Survey (NATSIHMS) were cholesterol, including total, high density lipoprotein (HDL) and low density lipoprotein (LDL), and triglycerides.

Blood pressure and obesity are also important measures associated with cardiovascular risk and were measured in the Australian Aboriginal and Torres Strait Islander Health Survey (AATSIHS). Detailed information on the prevalence of high blood pressure and obesity can be found in Australian Aboriginal and Torres Strait Islander Health Survey: Updated Results, 2012–13.

Cholesterol

Cholesterol is a type of fat that circulates in the blood. It is essential for many metabolic processes, including the production of hormones and building cells. There are two main types of cholesterol: high density lipoprotein (HDL) and low density lipoprotein (LDL). HDL cholesterol is known as 'good' cholesterol, as it picks up excess cholesterol in the blood and takes it to the liver where it is broken down, helping to prevent blockages. Low levels of HDL may increase the risk of heart disease. LDL cholesterol, on the other hand, is known as 'bad' cholesterol, as high levels in the bloodstream can lead to fatty deposits developing in the arteries, increasing the risk of heart attack or stroke[9][10].

Data source and definitions

Cholesterol levels are measured using a blood test. Abnormal cholesterol levels are defined as follows:

  • Total cholesterol greater than or equal to 5.5 mmol/L
  • LDL cholesterol greater than or equal to 3.5 mmol/L
  • HDL cholesterol less than 1.0 mmol/L for men and less than 1.3 mmol/L for women.

In order to get an accurate reading for the LDL cholesterol, people were required to fast for 8 hours or more beforehand. The LDL cholesterol results presented here refer only to those people who did fast (approximately 78% of adults who participated in the NATSIHMS).

Total cholesterol

Total cholesterol is a measure of all the different types of fats in the blood. Abnormal or high total cholesterol is a major risk factor for coronary heart disease and stroke[11].

In 2012–13, one in four Aboriginal and Torres Strait Islander adults (25.0%) had abnormal or high total cholesterol levels according to their blood test results. Yet only one in ten people (9.1%) from this group self-reported having high cholesterol as a current long-term health condition. This was similar to the rate found in the non-Indigenous population (10.1%). This suggests that the majority of Aboriginal and Torres Strait Islander people with high total cholesterol results were either unaware that they had the condition or did not consider it to be a long-term or current problem.

After adjusting for differences in age structure, Aboriginal and Torres Strait Islander people were less likely than non-Indigenous people to have high total cholesterol (rate ratio of 0.8). However, this is likely due to more Aboriginal and Torres Strait Islander people taking cholesterol-lowering medication, particularly after the age of 55 (see the Dyslipidaemia section of this publication).

Interestingly, there was no difference in the proportion of Aboriginal and Torres Strait Islander people with high total cholesterol between non-remote and remote areas in 2012–13. Rates were also similar for both men and women.

Similar to non-Indigenous Australians, the prevalence of high total cholesterol for Aboriginal and Torres Strait Islander people generally increased with age, peaking at 34.9% among those aged 45–54 years before dropping to 23.3% among those aged 55 years and over. However, this is likely the result of older people being more likely than younger people to take cholesterol-lowering medication.

Obesity, smoking and high blood pressure are all known risk factors for high cholesterol[12]. The NATSIHMS showed that Aboriginal and Torres Strait Islander people who were obese were twice as likely to have high total cholesterol as those who were normal weight or underweight (30.3% compared with 16.3%). Likewise, around two in five people with very high or severe blood pressure (42.7%) had high total cholesterol compared with 23.3% of those with normal blood pressure levels.

Yet, surprisingly, cholesterol was not associated with smoking in 2012–13. In fact, rates of high total cholesterol for Aboriginal and Torres Strait Islander people who were current smokers (25.6%) were very similar to those for ex-smokers (25.9%) and people who had never smoked (23.6%). This was different to the pattern seen in the non-Indigenous population, where smokers were more likely to have high total cholesterol than non-smokers[13].

The NATSIHMS also showed that Aboriginal and Torres Strait Islander people with high cholesterol were more likely to have other signs of cardiovascular disease. For example, around four in five people with high total cholesterol levels also had abnormal levels of LDL cholesterol (82.6%). People with high total cholesterol were also more than twice as likely as those with normal total cholesterol levels to have high triglycerides (45.7% compared with 17.6%).

LDL cholesterol

LDL cholesterol is a measure of 'bad' cholesterol in the blood. Over time, LDL cholesterol can build up in the blood vessels and arteries, blocking the passage of blood flow[14].

Overall, the results for LDL cholesterol were very similar to those for total cholesterol. In 2012–13, 25.0% of Aboriginal and Torres Strait Islander adults had abnormal or high levels of LDL cholesterol. After accounting for age differences, Aboriginal and Torres Strait Islander people were less likely than non-Indigenous people to have high LDL cholesterol levels (rate ratio 0.8).

Similar to the age pattern observed for high total cholesterol, the prevalence of high LDL cholesterol increased with age until middle adulthood, before decreasing among those aged 55 years and over. Again, this could be due to older people being more likely than younger people to take cholesterol-lowering medication.

The associations between LDL cholesterol and health risk factors were also very similar to those for total cholesterol, with higher rates of LDL cholesterol among those who were overweight or obese, and those who had high blood pressure. Aboriginal and Torres Strait Islander people with abnormal LDL cholesterol were also more likely than those with normal LDL cholesterol to have high total cholesterol (84.9% compared with 3.8%) and high triglyceride levels (35.5% compared with 18.6%).

HDL cholesterol

HDL cholesterol, on the other hand, is the measure of 'good' cholesterol. HDL picks up excess cholesterol in the blood and takes it to the liver where it is broken down[14].

In 2012–13, almost two in five Aboriginal and Torres Strait Islander adults (39.5%) had abnormal or low levels of HDL cholesterol, with higher rates among women (51.4%) than men (27.0%).

Unlike the other cholesterol biomarkers, abnormal HDL cholesterol was more common among Aboriginal and Torres Strait Islander people in remote areas than in non-remote areas (58.6% compared with 34.0%). Rates were especially high in very remote areas, where nearly two in three people (63.7%) had lower than normal levels of good cholesterol compared with one in three people (31.4%) in major cities.

After adjusting for age differences, Aboriginal and Torres Strait Islander people were nearly twice as likely as non-Indigenous people to have abnormal HDL cholesterol (rate ratio 1.8). For Aboriginal and Torres Strait Islander people, abnormal HDL cholesterol increased markedly during early adulthood, rising from 29.5% among those aged 18–24 years to 46.8% among those aged 35–44 years. This was noticeably different to the age pattern for non-Indigenous people, where rates remained fairly steady across all age groups (between 20.7% and 24.5%).

Low levels of HDL cholesterol were also associated with a range of lifestyle risk factors. For example, nearly half of those who were obese (49.1%) or who were current smokers (46.1%) had lower than normal levels of HDL cholesterol, compared with 29.3% who were normal weight or underweight and 35.0% who had never smoked.

Although people with low levels of HDL cholesterol were less likely to have abnormal total cholesterol (20.5% compared with 28.5%), they were more likely than those with normal levels of HDL cholesterol to have abnormal triglycerides (34.2% compared with 19.3%). Furthermore, people with low levels of HDL cholesterol were around twice as likely to have diabetes (18.2% compared with 7.0%) and chronic kidney disease (24.4% compared with 13.6%).

For more information on cholesterol, see Tables 1, 3, 4, 5, 6, 7, 8 and 17 in the Data downloads of this publication.

Triglycerides

Like cholesterol, triglycerides are a fatty substance in the blood. However, triglycerides work more like a type of fuel, circulating in the bloodstream to be used as energy by the cells. Research shows that high blood triglycerides are an independent risk factor for heart disease as they contribute to the development of atherosclerosis, which is the build-up of fatty deposits in the blood vessels[15]. High triglycerides are typically caused by a diet high in fat or kilojoules, but can also become elevated as a result of having other conditions, such as diabetes and kidney disease.

Data source and definitions

Triglycerides are measured using a blood test. Abnormal triglyceride levels were defined as greater than or equal to 2.0 mmol/L.

In order to get an accurate reading for triglycerides, people were required to fast for 8 hours or more beforehand. The results presented here refer only to those people who did fast (approximately 78% of adults who participated in the NATSIHMS).

In 2012–13, almost one in four Aboriginal and Torres Strait Islander adults (24.8%) had high triglyceride levels according to their blood test results, with higher rates among men (32.2%) than women (17.6%). A similar pattern was also seen between non-Indigenous men and women. After adjusting for differences in age structure, Aboriginal and Torres Strait Islander people were twice as likely as non-Indigenous people to have high triglycerides (rate ratio of 1.9).

Regionally, high triglyceride levels were more common among Aboriginal and Torres Strait Islander people living in remote areas, where one in three people (33.5%) had high triglyceride levels compared with around one in four people in non-remote areas (23.3%).

The NATSIHMS showed that there was a sharp increase in the proportion of Aboriginal and Torres Strait Islander people with high triglyceride levels after the age of 35 years, with rates peaking at 33.2% among those aged 45–54 years. The gap between the Aboriginal and Torres Strait Islander population and non-Indigenous population also began to noticeably widen from 35 years, with Aboriginal and Torres Strait Islander people aged 35–44 years being around twice as likely as their non-Indigenous counterparts to have high triglycerides.

Risk factors such as excess body weight contribute to the development of abnormal triglyceride levels[16]. In 2012–13, overweight or obese Aboriginal and Torres Strait Islander adults were four times as likely to have high triglyceride levels compared with adults who were of normal weight or underweight (31.4% compared with 7.8%). However, there was no clear relationship between triglycerides and smoking.

Interestingly, Aboriginal and Torres Strait Islander people with high triglycerides were more likely than those with normal triglycerides to have abnormal levels for nearly every other chronic disease tested for in the NATSIHMS. This was particularly the case for the other cardiovascular biomarkers, such as high total cholesterol (47.4% compared with 18.6%), lower than normal HDL cholesterol (50.8% compared with 32.3%) and high LDL cholesterol (35.8% compared with 21.5%).

High triglycerides were also related to diabetes, as insulin resistance or poorly controlled diabetes can increase triglyceride levels[16][17]. In 2012–13, Aboriginal and Torres Strait Islander people with high triglyceride levels were more than twice as likely as those with normal triglyceride levels to have diabetes (20.2% compared with 8.1%). They were also more likely to have signs of chronic kidney disease and liver disease.

For more information on triglycerides, see Tables 1, 3, 4, 5, 6, 7, 8 and 17 in the Data downloads of this publication.

Dyslipidaemia

Dyslipidaemia refers to a number of different lipid disorders (that is, conditions where there are too many fats in the blood). Estimates of dyslipidaemia from the NATSIHMS can be used to determine how many Aboriginal and Torres Strait Islander people have at least one lipid disorder and therefore have an increased risk of heart disease.

Data source and definitions

In the NATSIHMS, a person was classified as having dyslipidaemia if they had one or more of the following:

  • Taking cholesterol-lowering medication
  • Total cholesterol greater than or equal to 5.5 mmol/L
  • HDL cholesterol less than 1.0 mmol/L for men and less than 1.3 mmol/L for women
  • LDL cholesterol greater than or equal to 3.5 mmol/L
  • Triglycerides greater than or equal to 2.0 mmol/L.

In order to get an accurate reading for dyslipidaemia, people were required to fast for 8 hours or more beforehand. The results presented here refer only to those people who did fast (approximately 78% of adults who participated in the NATSIHMS).

In 2012–13, around two in three (65.3%) Aboriginal and Torres Strait Islander adults had dyslipidaemia. This comprised 13.9% who took some form of cholesterol-lowering medication and 51.4% who took no medication but had either high total cholesterol, low HDL cholesterol, high LDL cholesterol or high triglyceride levels based on their test results. Overall, rates of dyslipidaemia were similar for both men and women.

After adjusting for age difference between the two populations, Aboriginal and Torres Strait Islander people were more likely than non-Indigenous people to have dyslipidaemia (rate ratio of 1.1). Although the overall age pattern was similar to that for non-Indigenous Australians, rates of dyslipidaemia were significantly higher for middle aged Aboriginal and Torres Strait Islander people compared with their non-Indigenous counterparts. For example, 73.8% of Aboriginal and Torres Strait Islander people aged 35–44 years had dyslipidaemia compared with 59.2% of non-Indigenous people in this age group.

The results showed that Aboriginal and Torres Strait Islander people were no more likely than their non-Indigenous counterparts to have dyslipidaemia based on their test results alone. In fact, the difference between the two populations was entirely driven by Aboriginal and Torres Strait Islander people being more likely than non-Indigenous people to take some form of cholesterol-lowering medication (rate ratio of 1.6), particularly at younger ages. For example, cholesterol medication use in the Aboriginal and Torres Strait Islander population noticeably increased from 7.8% among those aged 35–44 years to 23.7% of those aged 45–54 years. This was about 10 years earlier than the corresponding increase in the non-Indigenous population, which occurred between 45–54 years and 55 years over.

In 2012–13, Aboriginal and Torres Strait Islander people living in remote areas were more likely than those living in non-remote areas to have dyslipidaemia (79.4% compared with 62.8%). Rates were particularly high among those in very remote areas, where around eight in ten (81.1%) people had dyslipidaemia compared with around six in ten (58.7%) people living in major cities. Interestingly, this was not due to differences in the proportions of adults taking cholesterol-lowering medication. Instead, it was due to Aboriginal and Torres Islander people in remote areas being more likely than those in non-remote areas to have dyslipidaemia based on their test results alone.

As with all the cardiovascular disease biomarkers, dyslipidaemia was strongly associated with obesity. In fact in 2012–13, Aboriginal and Torres Strait Islander people who were obese were almost twice as likely to have dyslipidaemia compared with those of normal weight or underweight (79.9% compared with 42.5%). Interestingly though, there was no association found between dyslipidaemia and smoking.

For more information on dyslipidaemia, see Tables 3, 4, 13 and 17 in the Data downloads of this publication.

Chronic kidney disease

Kidney disease is a chronic disease in which a person's kidney function is reduced or damaged. This affects the kidney's ability to filter blood and therefore control the body's water and other hormone levels, leading to increased fluid and waste within the body[18]. Kidney disease is also associated with several other chronic diseases such as diabetes and cardiovascular disease.

Diseases of the urinary system were the 10th leading cause of death for Aboriginal and Torres Strait Islander people in 2012. The age-standardised death rate for urinary diseases was two and a half times higher for Aboriginal and Torres Strait Islander people than for non-Indigenous people[3].

Chronic kidney disease has a number of stages, ranging in severity from Stage 1 to Stage 5, with the early stages often showing no symptoms. An individual's kidney function can improve or regress during the early stages of the disease but once Stages 4 and 5 are reached, kidney function is severely reduced and unlikely to improve. A person with end stage kidney disease is generally reliant on kidney replacement therapy in the form of dialysis or kidney transplant[18][19].

Data source and definitions

The NATSIHMS measured two aspects of kidney function: estimated glomerular filtration rate (eGFR) and the presence of albuminuria.

Chronic kidney disease stages were then determined by combining the participants' eGFR results with their albumin creatinine ratio (ACR) results. The different stages were defined as follows:

  • No indicators of chronic kidney disease - eGFR ≥60 mL/min/1.73 m² and no presence of albuminuria
    • Stage 1 - eGFR ≥90 mL/min/1.73 m² & albuminuria
    • Stage 2 - eGFR 60–89 mL/min/1.73 m² & albuminuria
    • Stage 3a - eGFR 45–59 mL/min/1.73 m²
    • Stage 3b - eGFR 30–44 mL/min/1.73 m²
    • Stage 4–5 - eGFR <30 mL/min/1.73 m²

The NATSIHMS test results only indicate a stage of chronic kidney disease as further testing would be required for a diagnosis.

Note that people who live in non-private dwellings, such as hostels, hospitals or nursing homes were not in the scope of the survey. This may affect estimates of the number of people with some conditions; for example, conditions which may require periods of hospitalisation, such as kidney disease.

In 2012–13, almost one in five (17.9%) Aboriginal and Torres Strait Islander people aged 18 years and over had indicators of chronic kidney disease, with the majority being in Stage 1 (11.8%) and very few in Stages 4–5 (1.1%). Overall, the rates of chronic kidney disease were similar for Aboriginal and Torres Strait Islander men (18.9%) and women (16.9%).

After taking age differences into account, Aboriginal and Torres Strait Islander people were more than twice as likely as non-Indigenous people to have indicators of chronic kidney disease (rate ratio of 2.1). They were three times as likely as their non-Indigenous counterparts to have indicators of Stage 1 chronic kidney disease and more than four times as likely to have Stages 4–5 (rate ratio of 4.6).

Among those Aboriginal and Torres Strait Islander people who had indicators of chronic kidney disease in the NATSIHMS, 11.2% self-reported having the condition. Although this rate is significantly higher than that for the non-Indigenous population (where 6.0% with indicators of chronic kidney disease self-reported having the condition), these results still indicate that around nine in ten Aboriginal and Torres Strait Islander people with signs of kidney disease were not aware they had it.

However, this is not unexpected as unlike other tests for chronic disease, results for albuminuria or abnormal eGFR alone cannot provide a diagnosis for kidney disease and could instead indicate the presence of an acute kidney condition or infection. Kidney disease can only be confirmed if albuminuria or eGFR of less than 60 mL/min/1.73 m² are persistent for at least three months[20]. The majority (69.8%) of people with indicators of chronic kidney disease who self-reported the condition had test results that indicated they were in the later stages of the disease (Stages 3 to 5).

Rates of chronic kidney disease were particularly high for Aboriginal and Torres Strait Islander people living in remote areas in 2012–13, where around three in every ten (33.6%) people had indicators of the disease. This compared with just over one in ten (13.1%) living in non-remote areas.

Overall, the prevalence of chronic kidney disease in the Aboriginal and Torres Strait Islander population steadily increased with age from early adulthood, whereas in the non-Indigenous population, levels of kidney disease remained very flat until late adulthood and only began to increase from the age of 65.

The higher prevalence of chronic kidney disease in the Aboriginal and Torres Strait Islander population may be due to the high prevalence of traditional chronic kidney disease risk factors, including diabetes and high blood pressure[18]. Diabetes is the most common cause of chronic kidney disease as, over time, high blood glucose levels can damage the filtering units within the kidneys[7]. In the NATSIHMS, almost four in ten (37.7%) Aboriginal and Torres Strait Islander people with chronic kidney disease also had diabetes. This compared with less than one in ten (6.4%) people without chronic kidney disease.

High blood pressure is another important risk factor for chronic kidney disease as high blood pressure can damage the blood vessels supplying the kidneys[21]. In 2012–13, Aboriginal and Torres Strait Islander people with high blood pressure were more than twice as likely to have indicators of chronic kidney disease compared with those who had normal blood pressure (29.4% compared with 14.9%).

Obesity was also associated with higher rates of chronic kidney disease in 2012–13. Around two in ten (20.1%) Aboriginal and Torres Strait Islander people who were obese had indicators of chronic kidney disease compared with just over one in ten (12.7%) people who were normal weight or underweight. Interestingly, however, this relationship between obesity and chronic kidney disease was not evident in the non-Indigenous population[13].

For more information on chronic kidney disease, see Tables 1, 3, 4, 5, 6, 7, 10 and 17 in the Data downloads of this publication.

Liver function

The liver works as the body's filter, removing toxins from the blood, processing nutrients and regulating its metabolism. A range of factors, including fatty liver disease, infections and excessive alcohol consumption can prevent the liver from performing these functions and if left untreated, can lead to liver damage[22]. When the liver is inflamed or damaged, enzymes including alanine aminotransferase (ALT) and gamma glutamyl transferase (GGT) leak from the liver cells into the bloodstream. As a result, elevated levels of ALT and GGT in the bloodstream can indicate the presence of liver disease.

Cirrhosis and other diseases of liver were the 9th leading cause of death for Aboriginal and Torres Strait Islander people in 2012 and were the 23rd leading cause for non-Indigenous people. The age standardised death rate for these diseases were four times higher for Aboriginal and Torres Strait Islander people than for non-Indigenous people overall[3].

Data source and definitions

The NATSIHMS measured the levels of two blood enzymes related to liver function: alanine aminotransferase (ALT) and gamma glutamyl transferase (GGT). While elevated levels for either test may indicate liver damage, they cannot diagnose the presence of liver disease.

Abnormal liver function as measured by ALT is defined as:

  • an ALT reading of greater than 40 U/L for males
  • an ALT reading of greater than 30 U/L for females.

Abnormal liver function as measured by GGT is defined as:

  • a GGT reading of greater than 50 U/L for males
  • a GGT reading of greater than 35 U/L for females.

Alanine aminotransferase (ALT)

ALT is an enzyme found mainly in the liver that helps the liver metabolise food into energy. Elevated levels of ALT in the blood can occur when the liver is damaged or diseased[23].

In 2012–13, 16.5% of Aboriginal and Torres Strait Islander adults had abnormal or elevated levels of ALT in their blood, with higher rates among men than women (19.9% compared with 13.3%). After taking age differences into account, Aboriginal and Torres Strait Islander people were around one and a half times as likely as non-Indigenous Australians to have high ALT levels (rate ratio of 1.4).

Elevated ALT was more common among Aboriginal and Torres Strait Islander people living in remote areas in 2012–13. Around one in five (21.8%) Aboriginal and Torres Strait Islander people in remote areas had abnormal ALT levels compared with around one in seven (15.0%) of those who lived in non-remote areas.

Aboriginal and Torres Strait Islander people were at a higher risk of liver disease than their non-Indigenous counterparts in some age groups, with the biggest difference for those aged 25–34 years (19.6% compared with 12.2%).

Excess body fat is recognised as a risk factor for liver disease[24]. As was the case for non-Indigenous Australians, Aboriginal and Torres Strait Islander people who were obese were around three times as likely to have elevated ALT compared with those of normal weight or underweight (25.5% compared with 8.6%)[13].

High blood pressure was also associated with elevated ALT in 2012–13. Aboriginal and Torres Strait Islander people with high blood pressure were twice as likely to have abnormal ALT compared to those with normal blood pressure (26.1% and 13.7% respectively). The same pattern was apparent for non-Indigenous adults; however the relationship was less pronounced (13.1% who had high blood pressure also experienced elevated ALT compared with 10.3% who had normal blood pressure).

Overall, almost three in five Aboriginal and Torres Strait Islander people (58.9%) who had elevated ALT also had high levels of GGT. While Aboriginal and Torres Strait Islander people with abnormal ALT were almost twice as likely to have high triglycerides (40.3% compared with 21.7%), there was no clear association with any of the other chronic disease biomarkers except for anaemia.

Gamma glutamyl transferase (GGT)

The enzyme GGT is found in many tissues in the body. It exists in a relatively high concentration in the liver but is also found in the tissues of the kidneys, bile duct, pancreas, gallbladder, spleen, heart and brain. When any of these tissues are damaged or diseased, GGT leaks from the tissue into the bloodstream. High GGT levels may therefore be indicative of a broader range of conditions and not just liver disease[25][26].

In 2012–13, around one in four (23.4%) Aboriginal and Torres Strait Islander people had abnormal or elevated levels of GGT in their blood. After taking age differences of the populations into account, Aboriginal and Torres Strait Islander people were twice as likely as non-Indigenous Australians to have abnormal levels of GGT (rate ratio 2.1).

As was the case with ALT, the proportion of Aboriginal and Torres Strait Islander people with elevated GGT was higher in remote Australia than in non-remote Australia. Over one in three (35.0%) Aboriginal and Torres Strait Islander people in remote areas had elevated GGT compared to one in five (20.0%) in non-remote areas. However, unlike ALT, abnormal GGT rates were similar for both men and women (23.9% compared with 22.9%).

Overall, abnormal levels of GGT increased with age for both Aboriginal and Torres Strait Islander people and non-Indigenous people. However, the rate of one in every seven (14.6%) Aboriginal and Torres Strait Islander aged 18–24 years with abnormal GGT was not reached by non-Indigenous people until the age of 45–54 years (13.1%).

As was the case with ALT, rates of abnormal GGT were higher among those who were obese or who had high blood pressure. For example, around one in three (32.0%) people who were obese had abnormal GGT compared with around one in seven (13.5%) who were of normal weight or underweight. Likewise, one in three Aboriginal and Torres Strait Islander people with high blood pressure also had abnormal GGT (33.3%) compared to only one in five who did not have high blood pressure (20.6%). However, unlike ALT, GGT was also linked to smoking, with current smokers more likely to have abnormal GGT than those who had never smoked (27.8% and 19.7% respectively).

Aboriginal and Torres Strait Islander people with abnormal GGT were more likely to have indicators of other chronic conditions as well. This was particularly the case for triglycerides, where those with high GGT levels were more than twice as likely as those with normal GGT levels to have high triglycerides (47.7% compared with 18.0%). They were also more likely to have high total cholesterol (36.4% compared with 21.9%), diabetes (20.3% compared with 8.4%) and signs of kidney disease (27.7% compared with 14.8%).

For more information on ALT and GGT, see Tables 1, 3, 4, 5, 6 and 11 in the Data downloads of this publication.

Exposure to tobacco smoke

The NATSIHMS included a test for cotinine as an objective measure of smoking status. The body produces cotinine in the process of breaking down, or metabolising, nicotine[27]. Given that most nicotine comes from exposure to tobacco smoke, cotinine levels are assumed to be generally proportionate to the amount of tobacco exposure a person receives through smoking, or in some cases, through exposure to second hand smoke. However, cotinine levels only remain elevated for around 20 hours after exposure to tobacco smoke, therefore it can only provide a measure of short-term exposure.

Data source and definitions

Levels of cotinine were measured via a blood test. In the NATSIHMS, cotinine levels of 140 nmol/L or greater indicate exposure to tobacco smoke.

The 2012–13 AATSIHS showed that 44.4% of Aboriginal and Torres Strait Islander adults self-reported being a current daily smoker[28].

As for the non-Indigenous population, the pattern across age for Aboriginal and Torres Strait Islander people for cotinine levels of 140 nmol/L or more were very similar to that for the self-reported smoking data. Although small gaps were evident, none of these were significant.

As expected, the majority (95.4%) of Aboriginal and Torres Strait Islander adults who self-reported being current smokers had cotinine levels indicating exposure to tobacco smoke. Interestingly, however, 13.9% of those who self-reported being an ex-smoker had levels of cotinine indicating exposure to tobacco smoke, as did 6.0% of those who self-reported having never smoked. This pattern was the same for both men and women. Overall, these discrepancies were much higher than those found in the non-Indigenous population, where only 5.7% of ex-smokers and 0.3% of those who had never smoked had cotinine levels of 140nmol/L or more.

This difference was particularly noticeable for Aboriginal and Torres Strait Islander people living in remote areas, where 22.5% of non-smokers had levels of cotinine indicating exposure to tobacco smoke. One potential explanation for this could be the use of chewing tobacco. Chewing tobacco is not included in the self-reported smoking rates, yet according to the AATSIHS, around 2.2% of Aboriginal and Torres Strait Islander people living in remote areas chewed tobacco daily. The NATSIHMS showed that of those non-smokers in remote areas who had cotinine levels greater than or equal to 140nmol/L, around one in five (19%) reported chewing tobacco daily.

Other possible reasons for the discrepancy include the use of nicotine in some smoking cessation programs (e.g. nicotine patches), which would raise the level of cotinine in the blood, or high levels of exposure to second hand smoke. It is also possible that people's smoking behaviours changed between the time they self-reported their smoking status and the time they provided their biomedical sample.

For more information on cotinine, see Table 5 in the Data downloads of this publication.

Anaemia

Anaemia is caused by a decrease in either the number of red blood cells in the body or the quantity of haemoglobin within red blood cells. When a person is anaemic, their heart has to work harder to ensure that muscles and organs get the oxygen they need. Haemoglobin is a protein found in red blood cells. It contains a large amount of iron and helps transport oxygen from the lungs to the rest of the body. The NATSIHMS measured the concentration of haemoglobin in the blood, which can help diagnose anaemia.

Data source and definitions

Haemoglobin levels were measured using a blood test. Abnormal levels of haemoglobin indicating a risk of anaemia are defined differently for males and females, young people, and pregnant women, as based on World Health Organization (WHO) guidelines[29]:

  • Less than 120 g/L for females aged 15 years or older who are not pregnant
  • Less than 130 g/L for males aged 15 years or older
  • Less than 110 g/L for pregnant women.

In 2012–13, 7.6% of Aboriginal and Torres Strait Islander adults were at risk of anaemia. After taking age differences into account, Aboriginal and Torres Strait Islander people were almost twice as likely as non-Indigenous people to be at risk (rate ratio of 1.9).

Overall, the risk of anaemia was higher for Aboriginal and Torres Strait Islander people living in remote areas compared with those living in non-remote areas (10.1% compared with 6.9%). Research suggests that poor nutrition and poor supply of healthy food contributes to chronic diseases such as anaemia, particularly in remote Australia[30].

As was the case in the non-Indigenous population, Aboriginal and Torres Strait Islander women were more likely than men to be at risk of anaemia (10.3% compared with 4.8%). Although the overall age pattern for anaemia was similar for both the Aboriginal and Torres Strait Islander and non-Indigenous populations, Aboriginal and Torres Strait Islander people were at a higher risk of anaemia than their non-Indigenous counterparts in most age groups.

Research has shown that anaemia is associated with both diabetes and chronic kidney disease[31]. This was reflected in the NATSIHMS results, where 29.6% of those at risk of anaemia had diabetes compared with 9.7% of those not at risk. Those at risk of anaemia were also more likely to have signs of chronic kidney disease (41.9% compared with 15.8%).

For more information on anaemia, see Tables 1, 3, 4, 5 and 6 in the Data downloads of this publication.

Iodine

Iodine is an essential nutrient required for the production of thyroid hormones. These hormones are important for normal growth and development, particularly of the brain. The major dietary sources of iodine include seafood, especially seaweed, baked bread and dairy milk. Inadequate amounts of iodine may lead to a range of conditions, including goiter, hypothyroidism, and in severe cases, intellectual disability[32].

Data source and definitions

Iodine levels are measured using a urine test.

According to WHO, a population is considered iodine deficient if the median urinary iodine concentration (MUIC) is less than 100 μg/L. The WHO recommends that no more than 20% and 50% of the population have an iodine concentration below 50 μg/L and 100 μg/L, respectively[32].

The NATSIHMS showed that the Aboriginal and Torres Strait Islander adult population was iodine sufficient in 2012–13, with a population MUIC of 135.0 μg/L. Likewise, only around one in ten people (10.8%) had an iodine level of less than 50 μg/L.

Overall, Aboriginal and Torres Strait Islander adults had higher iodine levels than all non-Indigenous adults (a median of 135.0 ug/L compared with 124.0 ug/L)[33]. Likewise, after adjusting for age differences, Aboriginal and Torres Strait Islander people were less likely than non-Indigenous people to have iodine levels under 50 μg/L (rate ratio 0.8).

Median iodine levels were generally higher among Aboriginal and Torres Strait Islander people living in remote areas than in non-remote areas in 2012–13. This may be due to the varying access to and affordability of certain foods, or the different diets typically consumed by people living in various parts of Australia. Interestingly, however, there was no difference in proportion of people with an iodine level of less than 50 μg/L between non-remote and remote areas (11.0% compared with 10.1%).

Looking at age, rates of urinary iodine concentration below 50 ug/L remained fairly stable among Aboriginal and Torres Strait Islander and non-Indigenous adults across all broad age groups. Although rates for both populations appeared to dip for those aged 55 years and over, this difference was not significant.

Sufficient iodine levels are particularly important for women of childbearing years as deficiency could impede the normal growth and development of the fetus if these women were to become pregnant[32]. In 2012–13, Aboriginal and Torres Strait Islander women aged 18–44 years had a MUIC of 135 μg/L, which was above the recommended population level of 100 ug/L.

For more information on iodine, see Tables 2, 3, 4 and 5 in the Data downloads of this publication.

Vitamin D

Vitamin D is essential for the body to absorb calcium effectively, which is important for bone health and muscle function, and for preventing conditions such as osteoporosis. The main source of Vitamin D is exposure to sunlight, although small amounts can be obtained through some foods, such as fatty fish and fortified margarine and milk[34].

The main consequence of severe Vitamin D deficiency is rickets in children and osteopenia (fragile bones) in older people[34]. There is some evidence to suggest that low Vitamin D levels could also be a risk factor for other chronic conditions, including heart disease, cancer and kidney disease, but more research is needed to better understand these links[35][36].

Measuring vitamin D

In the NATSIHMS, Vitamin D levels were measured via a blood test, which measures Vitamin D obtained from both food and sunlight[34].

The NATSIHMS used the Liquid Chromatography Mass Spectrometry (LCMS) method to assess Vitamin D status. This method has the highest sensitivity and specificity for measurement of Vitamin D[37].

Given the expensive equipment required for the LCMS method and the lack of standardisation in measurement across laboratories, the LCMS method is not yet widely used in Australia and standardised test cut-offs are yet to be developed[36].

In the NATSIHMS, the levels recommended in a recent Australian position statement on Vitamin D have been applied to determine Vitamin D deficiency[35]. These cut-offs are:

  • Mild deficiency: 30 – 49 nmol/L
  • Moderate deficiency: 13* – 29 nmol/L
  • Severe deficiency: <13* nmol/L
  • Total deficiency: <50 nmol/L
  • Adequate levels: ≥50 nmol/L**

* Note that the cut-off recommended in the position statement is <12.5 nmol/L, but the AATSIHS is unable to output against this cut-off as the Vitamin D data is only available in whole numbers.

** Note that the position statement states that levels may need to be 10 to 20 nmol/L higher at the end of summer, to allow for seasonal decrease.

In 2012–13, around one in four (26.5%) Aboriginal and Torres Strait Islander adults had a Vitamin D deficiency (<50 nmol/L), with the majority having a mild deficiency (21.9%) and the remainder a moderate or severe deficiency (4.6%). This pattern was similar for both men and women. After taking age differences into account, Aboriginal and Torres Strait Islander people were more likely to have a Vitamin D deficiency than their non-Indigenous counterparts (rate ratio of 1.1).

In 2012–13, Vitamin D deficiency was much more common among Aboriginal and Torres Strait Islander people living in remote areas, where almost four in ten (38.7%) Aboriginal and Torres Strait Islander people were Vitamin D deficient compared with just over two in ten people living in non-remote areas (23.0%).

Unlike many of the other biomarkers, Vitamin D levels did not vary by age, with similar deficiency rates for all broad age groups (between 25.1% and 29.2%). This was different to the pattern seen in the non-Indigenous population, where rates of Vitamin D deficiency decreased as people got older. This decrease in Vitamin D deficiency in the non-Indigenous population corresponded with an increase in the use of Vitamin D supplements, especially among older age groups[33]. However information on supplement use was not collected in the AATSIHS, so this comparison is not available for the Aboriginal and Torres Strait Islander population.

As expected, Vitamin D levels varied considerably by season, with overall deficiency rates for Aboriginal and Torres Strait Islander people being much lower in summer (15.3%) and autumn (16.2%) than in winter (36.4%) and spring (34.8%). While this seasonal impact was seen across both non-remote and remote areas, rates of Vitamin D deficiency remained higher among Aboriginal and Torres Strait Islander people in remote areas than in non-remote areas regardless of the time of year.

The Australian position statement[35] on Vitamin D highlights that obese people may be at higher risk of Vitamin D deficiency because excess body fat can interfere with the absorption of Vitamin D. This was reflected in the NATSIHMS results, with Aboriginal and Torres Strait Islander people who were obese being almost twice as likely to have Vitamin D deficiency as those who were underweight or of normal weight (33.4% and 17.5% respectively). Interestingly though, this relationship was not evident in the non-Indigenous population[33].

There is some evidence to suggest that low Vitamin D levels are associated with increased risk of certain chronic health conditions, including heart disease and diabetes, although these are yet to be clearly established[35][36]. In 2012–13, Aboriginal and Torres Strait Islander people with a Vitamin D deficiency were almost twice as likely as those with adequate levels of Vitamin D to have diabetes (16.6% compared with 9.0%). They were also more likely to have chronic kidney disease (26.9% compared with 14.3%). It is important to note however, that the cause and effect of these relationships cannot be determined from this information.

For more information on Vitamin D see Tables 2, 3, 4, 5, 12 and 16 in the Data downloads of this publication.

Data downloads

Australian Aboriginal and Torres Strait Islander Health Survey: Biomedical Results, 2012-13

Data files

* Table 2: This update clarifies the unit of measurement in the Relative Standard Errors worksheet. No data have been changed.

Footnotes

  1. Diabetes Australia, Sept 2011, ‘What is Diabetes?’, http://www.diabetesaustralia.com.au/en/Understanding-Diabetes/What-is-Diabetes/; accessed 10/09/2014.
  2. The Royal Australian College of General Practitioners and Diabetes Australia, 2014, ‘General practice management of type 2 diabetes’,  https://www.pharmaceucare.com/assets/docs/General_practice_management_of_type_2_diabetes.91150421.pdf; accessed 10/09/2014.
  3. Australian Bureau of Statistics 2014, ‘Causes of Death, Australia, 2012’,  https://www.abs.gov.au/ausstats/abs@.nsf/Lookup/by%20Subject/3303.0~2012~Main%20Features~Contents~1; accessed 10/09/2014.
  4. World Health Organization 2006, ‘Definition and diagnosis of diabetes mellitus and intermediate hyperglycemia’,  ttps://www.who.int/publications/i/item/definition-and-diagnosis-of-diabetes-mellitus-and-intermediate-hyperglycaemia; accessed 10/09/2014.
  5. World Health Organization 2011, ‘Use of Glycated Haemoglobin (HbA1c) in the Diagnosis of Diabetes Mellitus’,  ttps://www.who.int/publications/i/item/use-of-glycated-haemoglobin-(-hba1c)-in-diagnosis-of-diabetes-mellitus; accessed 10/09/2014.
  6. Kahn, B.B & Flier, J.S., 2000, 'Obesity and insulin resistance'. The Journal of Clinical Investigation, http://www.jci.org/articles/view/10842; accessed 10/09/2014.
  7. Kidney Health Australia, ‘Diabetes and Chronic Kidney Disease (CKD)’, http://www.kidney.org.au/ForPatients/Management/DiabetesandCKD/tabid/704/Default.aspx; accessed 10/09/2014.
  8. Australian Diabetes Council, 2011, Reducing the risk of complications in type 2 diabetes, http://www.australiandiabetescouncil.com/ADCCorporateSite/files/f4/f4940c4e-c5eb-4430-b50f-6724d0f9472d.pdf; accessed 10/09/2014.
  9. CSIRO, ‘Cholesterol facts’, http://www.csiro.au/Outcomes/Health-and-Wellbeing/Prevention/CholesterolFacts.aspx; accessed 10/09/2014.
  10. American Heart Association, ‘Good vs. Bad Cholesterol’, http://www.heart.org/HEARTORG/Conditions/Cholesterol/AboutCholesterol/Good-vs-Bad-Cholesterol_UCM_305561_Article.jsp; accessed 10/09/2014.
  11. Australian Institute of Health and Welfare, 2013, High blood cholesterol, http://www.aihw.gov.au/high-blood-cholesterol/; accessed 10/09/2014.
  12. Heart Foundation, Cardiovascular Condition, http://www.heartfoundation.org.au/your-heart/cardiovascular-conditions/Pages/high-cholesterol.aspx; accessed 10/09/2014.
  13. Australian Bureau of Statistics, 2013, ‘Australian Health Survey: Biomedical Results for Chronic Diseases’, https://www.abs.gov.au/statistics/health/health-conditions-and-risks/national-health-measures-survey/2011-12; accessed 10/09/2014.
  14. National Heart Foundation of Australia, 2013, ‘Cholesterol’, http://www.heartfoundation.org.au/SiteCollectionDocuments/NAHU-Cholesterol.pdf; accessed 10/09/2014.
  15. Talayero, BG and Sacks, FM, 2011, 'The Role of Triglycerides in Atherosclerosis', Current Cardiology Reports, http://link.springer.com/article/10.1007%2Fs11886-011-0220-3#page-1; accessed 10/09/2014.
  16. Miller, M., Stone, N.J., Ballantyne, C., Bittner, V., Criqui, M.H., Ginsberg, H.N.,..Pennathur, S., 2011, ‘Triglycerides and Cardiovascular Disease’, Circulation, 123, 2292-2333, http://circ.ahajournals.org/content/123/20/2292.full; accessed 10/09/2014.
  17. American Heart Association, 2014, ‘Cholesterol Abnormalities & Diabetes’, http://www.heart.org/HEARTORG/Conditions/Diabetes/WhyDiabetesMatters/Cholesterol-Abnormalities-Diabetes_UCM_313868_Article.jsp; accessed 10/09/2014.
  18. Kidney Health Australia, July 2014, ‘Risk factors and symptoms of Kidney Disease?’, http://www.kidney.org.au/KidneyDisease/RiskFactorsandSymptoms/tabid/819/Default.aspx; accessed 10/09/2014.
  19. The Renal Association, July 2014, Stage 4-5 CKD, http://www.renal.org/information-resources/the-uk-eckd-guide/stages-4-5-ckd#sthash.sHNUuIjf.puzWwFtZ.dpbs; accessed 10/09/2014.
  20. Kidney Health Australia, Jun 2013, Chronic Kidney Disease (CKD) Management in General Practice. 2nd Edition 2012, http://www.kidney.org.au//LinkClick.aspx?fileticket=vfDcA4sEUMs%3d&tabid=635&mid=1584; accessed 10/09/2014.
  21. Australian Institute of Health and Welfare, Jun 2013, An overview of Chronic Kidney Disease in Australia, 2009, https://www.aihw.gov.au/reports/chronic-kidney-disease/overview-chronic-kidney-disease-australia-2009/contents/summary; accessed 10/09/2014.
  22. Angulo, P and Lindor, KD, 2002, 'Non-alcoholic fatty liver disease', Journal of Gastroenterology and Hepatology, http://www.gastrohep.com/conreports/bangkok/jghs2.pdf; accessed 10/09/2014.
  23. Schindhelm, RK, et al. 2006, 'Alanine aminotransferase as a marker of non-alcoholic fatty liver disease in relation to type 2 diabetes mellitus and cardiovascular disease', Diabetes/Metabolism Research and Reviews, https://pubmed.ncbi.nlm.nih.gov/16832839/; accessed 10/09/2014.
  24. Farrell, GC et al. 2006, 'Nonalcoholic fatty liver disease: From steatosis to cirrhosis', Hepatology, http://onlinelibrary.wiley.com/doi/10.1002/hep.20973/full; accessed 10/09/2014.
  25. Lee, DS, et al. 2007, 'Gamma Glutamyl Transferase and Metabolic Syndrome, Cardiovascular Disease, and Mortality Risk: The Framingham Heart Study', Arteriosclerosis, Thrombosis, and Vascular Biology, http://atvb.ahajournals.org/content/27/1/127.full; accessed 10/09/2014.
  26. Ruttman, E, et al. 2005, 'Gamma-Glutamyltransferase as a Risk Factor for Cardiovascular Disease Mortality: An Epidemiological Investigation in a Cohort of 163 944 Austrian Adults', Circulation: Journal of the American Heart Association, http://circ.ahajournals.org/content/112/14/2130.full; accessed 10/09/2014.
  27. Benowitz, NL, 1996, 'Cotinine as a Biomarker of Environmental Tobacco Smoke Exposure, Epidemiologic Reviews', http://epirev.oxfordjournals.org/content/18/2/188.citation; accessed 10/09/2014.
  28. Australian Bureau of Statistics, June 2014, Australian Aboriginal and Torres Strait Islander Health Survey: Updated Results, 2012–13, ABS cat. no 4727.0.55.006, https://www.abs.gov.au/ausstats/abs@.nsf/Lookup/by%20Subject/4727.0.55.006~2012–13~Main%20Features~Tobacco%20smoking~13; accessed 10/09/2014.
  29. World Health Organization (WHO) 2011, Haemoglobin concentrations for the diagnosis of anaemia and assessment of severity, Vitamin and Mineral Nutrition Information System, https://www.who.int/publications/i/item/WHO-NMH-NHD-MNM-11.1; accessed 10/09/2014.
  30. Council of Australian Governments, 2009, National Strategy For Food Security In Remote Indigenous Communities, https://www.coag.gov.au/sites/default/files/nat_strat_food_security.pdf; accessed 10/09/2014.
  31. Mehdi, U & Toto, RD 2009, 'Anemia, Diabetes, and Chronic Kidney Disease', Diabetes Care, https://diabetesjournals.org/care/article/32/7/1320/26911/Anemia-Diabetes-and-Chronic-Kidney-Disease; accessed 10/09/2014.
  32. World Health Organization, UNICEF, ICCIDD, 2007, Assessment of iodine deficiency disorders and monitoring their elimination, https://www.who.int/publications/i/item/9789241595827; accessed 10/09/2014.
  33. Australian Bureau of Statistics 2014, Australian Health Survey: Biomedical Results for Nutrients, 2011-12, ABS cat. no. 4364.0.55.006, https://www.abs.gov.au/ausstats/abs@.nsf/Lookup/4364.0.55.006Chapter2002011-12; accessed 10/09/2014.
  34. Gibson RS, 2005, Principles of Nutritional Assessment, 2nd edition, Oxford University Press, New York; accessed 10/09/2014.
  35. Nowson CA, McGrath JJ, Ebeling PR, Haikerwal A, Daly RM, Sanders KM, Seibel MJ and Mason, RS, 2012, Vitamin D and health in adults in Australia and New Zealand a position statement, Medical Journal of Australia 196(11): 686-687, https://www.mja.com.au/journal/2012/196/11/vitamin-d-and-health-adults-australia-and-new-zealand-position-statement?0=ip_login_no_cache%3Da474845072622903b6f5567f3a1d71d9; accessed 10/09/2014.
  36. The Royal College of Pathologists of Australasia, 2013, Position statement; Use and Interpretation of Vitamin D testing, https://www.rcpa.edu.au/Library/College-Policies/Position-Statements/Use-and-Interpretation-of-Vitamin-D-Testing; accessed 10/09/2014.
  37. Carter GD, Jones JC. 2009 Use of a common standard improves the performance of liquid chromatography-tandem mass spectrometry methods for serum 25-hydroxyvitamin-D. Ann Clin Biochem; 46: 79-81; accessed 10/09/2014.
Back to top of the page