- This experimental indicator is derived from Australian Taxation Office (ATO) Business Activity Statements (BAS) turnover data from monthly BAS remitters. It includes 13 of the 19 industry divisions classified according to the Australian and New Zealand Standard Industrial Classification (ANZSIC), 2006.
- Monthly BAS reporting covers businesses with GST annual turnover of $20 million or more and a proportion of smaller businesses that report monthly on a voluntary basis.
- The estimated monthly changes in business turnover are aligned as closely as is feasible to the Australian System of National Accounts concept of market output. Users should exercise caution in comparing the indicator to other ABS economic outputs due to differences in concepts, scope, coverage, and methods.
- In this release, revisions resulting from updates to source data and additional processing have been applied back to January 2010.
Monthly Business Turnover Indicator
This is not the latest release View the latest release
Experimental indicator of business turnover derived from monthly Business Activity Statements
Reference period
July 2022
Released
9/09/2022
Key statistics
In seasonally adjusted terms, the July 2022 monthly business turnover indicator showed:
- Falls in seven of the 13 published industries
- The largest fall was in Mining (-10.1%)
- The largest increase was in Electricity, gas, water and waste services (5.0%)
- Through the year, rises were seen in all 13 published industries
Industry
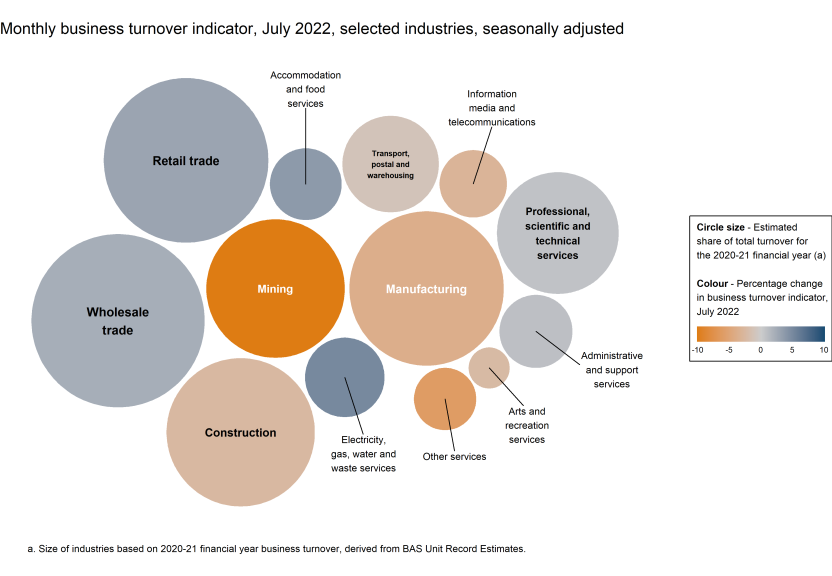
Total turnover differs between industries. This should be considered when analysing month-to-month movements in the context of overall economic activity. The chart below shows the monthly movements in the turnover indicator for July 2022 (represented by colour) and the selected industries' estimated share of total turnover for the 2020-21 financial year (represented by circle size).
Image
Description
The chart has 13 circles, one for each industry division included in the Monthly Business Turnover Indicator. The size of each circle represents the share of total business turnover for the 2020-21 financial year for that industry. Circles are also given a colour shading to represent the monthly change in the Monthly Business Turnover Indicator for the current reference month. Industries with negative movements are coloured orange, those with little or no movement are grey, and positive movements are blue.
The largest circles are for Wholesale trade, Retail trade, Manufacturing, Construction, and Mining.
Mining is coloured a strong orange, showing a strong negative movement in business turnover.
Business turnover differs from the National Accounts concept of output. For example, the value of goods sold by wholesalers and subsequently retailers are reflected in turnover for both industries while National Accounts output measures the margins gained by each industry.
Industry analysis and charts
In July 2022, six of the 13 industry divisions included in the indicator showed increases to turnover in seasonally adjusted terms. The largest rise in monthly turnover was seen in:
- Electricity, gas, water and waste services (5.0%)
- Accommodation and food services (3.7%)
- Retail trade (2.9%)
The increase in Electricity, gas, water and waste services was the third consecutive rise, reflecting the continued elevation in wholesale energy prices.
Of the seven industries that showed falls in July 2022, the largest were in:
- Mining (-10.1%)
- Other services (-6.1%)
- Manufacturing (-3.8%)
The fall in Mining comes after seven months of consecutive rises and aligns with a sharp decline in exports for the month of July, something also seen in the latest International Trade in Goods and Services data.
All industry divisions recorded year-on-year increases in business turnover in July 2022, compared with the early phase of the COVID-19 Delta period in July 2021. The largest rises were recorded in:
- Accommodation and food services (51.7%)
- Electricity, gas, water and waste services (44.8%)
- Transport, postal and warehousing (37.8%)
Mining
Manufacturing
Electricity, gas, water and waste services
Construction
Wholesale trade
Retail trade
Accommodation and food services
Transport, postal and warehousing
Information media and telecommunications
Professional, scientific and technical services
Administrative and support services
Arts and recreation services
Other services
Data downloads
Time series spreadsheets
Data files
Table 01: Business turnover indicator, Mining - Monthly percentage change and index
Table 02: Business turnover indicator, Manufacturing - Monthly percentage change and index
Table 03: Business turnover indicator, Electricity, gas, water and waste services - Monthly percentage change and index
Table 04: Business turnover indicator, Construction - Monthly percentage change and index
Table 05: Business turnover indicator, Wholesale trade - Monthly percentage change and index
Table 06: Business turnover indicator, Retail trade - Monthly percentage change and index
Table 07: Business turnover indicator, Accommodation and food services - Monthly percentage change and index
Table 08: Business turnover indicator, Transport, postal and warehousing - Monthly percentage change and index
Table 09: Business turnover indicator, Information media and telecommunications - Monthly percentage change and index
Table 10: Business turnover indicator, Professional, scientific and technical services - Monthly percentage change and index
Table 11: Business turnover indicator, Administrative support services - Monthly percentage change and index
Table 12: Business turnover indicator, Arts and recreation services - Monthly percentage change and index
Table 13: Business turnover indicator, Other services - Monthly percentage change and index
Data Explorer datasets
Caution: Data in Data Explorer is currently released after the 11:30am release on the ABS website. Please check the reference period when using Data Explorer.
For more information about Data Explorer, see the Data Explorer user guide.
Business Turnover Indicator - Monthly percentage changes and indexes, January 2010 onwards