Latest release

Chapter 2 General Methodology

Producer and International Trade Price Indexes: Concepts, Sources and Methods
Reference period
2022

Introduction

The Australian Producer and International Trade Price Indexes are compiled in broad agreement with the guidelines contained in the International Monetary Fund’s Producer Price Index Manual, Theory and Practice (2004) and Export and Import Price Index Manual, Theory and Practice (2009).

As the International Monetary Fund’s guidelines are not targeted to harmoniously align with the broad range of industries of the Australian economy, this section of the release explores the historical development of the Producer and International Trade Price Indexes and outline the current methodology used by the ABS in the compilation of the Australia, Producer Price Indexes (PPI), and International Trade Price Indexes (ITPI).

Historical Development

The first Producer Price Indexes compiled by the ABS was the Melbourne Wholesale Price Index. This index was introduced in 1912 with historical index numbers from 1861. Prices were obtained from newspapers and trade publications. The index was compiled until 1961. The index primarily included basic materials and food stuffs, weighted together using consumption data from 1910. Neither the list of products nor the weighting varied during the life of the index. 

The Wholesale Price (Basic Materials and Foodstuffs) Index was introduced in 1939 with historical index numbers available from 1928. The index was compiled until 1970. The prices used in the index were, in the main, obtained directly from manufacturers and merchants in Melbourne (with a few important exceptions). Products in the index were priced in their basic form wherever possible and in respect of imported materials as near as possible to the point where they made their first effective impact on the local price structure. The weights were based on estimates of the average annual consumption of the products in Australia during the period 1928-29 to 1934-35 inclusive. 

Over the 1960s, 1970s and 1980s a number of new indexes were introduced. These included monthly input indexes of the building construction industry, monthly input and output indexes of the manufacturing industry, and monthly input indexes of the coal mining industry. From 1997 these indexes were compiled and published on a quarterly basis. From 2000 the ABS introduced quarterly construction industry output price indexes, services industries output price indexes, and stage of production price indexes. From the June quarter 2001 a number of Producer Price Index industry publications were amalgamated into a single publication, Producer Price Indexes, Australia.

An industry approach to defining and weighting the Producer Price Indexes was adopted from the September quarter 2012 as a result of the Producer and International Trade Price Indexes Review. This approach replaced the product approach. As a consequence, the PPIs are compiled using weights and prices for products used by, or produced by, businesses classified to industries as defined in the Australian and New Zealand Standard Industry Classification. The titles of the indexes were also changed to reflect the industry approach.

More information on the outcome and implementation of the review of the Producer and International Trade Price Indexes can be found in the Information Paper: Outcome of the Review of the Producer and International Trade Price Indexes, 2012 and Information Paper: Implementation of the Review of the Producer and International Trade Price Indexes, 2012.

In December 2019 the ABS discontinued the Stage of Production (SOP) series and instead moved to publishing only the Final Demand (excluding exports) series. The SOP indexes included (Preliminary, Intermediate, and Final demand). The discontinuation resulted from a review undertaken by the ABS in consultation with key users. The review identified more detailed analysis and coverage of industry indexes was more desired than SOP outputs. The ABS agreed to focusing efforts towards enhancing industry indexes, expanding coverage, and completing a weighting review of the PPI's.

The Import Price Index and Export Price Index are annually re-weighted chained Lowe indexes. This method of weighting was introduced for the September quarter 2000 and replaced the 'fixed-base' method of weighting in which the weighting patterns were updated infrequently (generally once every 5 or 10 years).

In March quarter 2022 the ABS re-weighted PPI indexes in line with the 2018/19 Australian National Accounts: Input-Output tables. Included in the re-weight were the Final demand, Input to the Manufacturing, Output of the Manufacturing, Output of the Services, and Division B Output of the mining indexes. Excluded from the re-weight were the Construction industries and Input to the Coal mining index. Weighting patterns of the PPIs are updated infrequently (generally once every 5 or 10 years).

Purpose

The principal purpose of the Producer and International Trade Price Indexes is to measure price change by industry to support the compilation of the Australian National Accounts and the Balance of Payments.  This requires that their compilation be on a basis coherent with the frameworks underlying those statistics (Australian System of National Accounts and Balance of Payments and International Investment Position Manual Sixth Edition, 2008) and informs many aspects of the current methodology of both the Producer and International Trade Price Indexes.

In the compilation of the Australian National Accounts and the Balance of Payments, components of the Producer and International Trade Price Indexes are primarily used as deflators to produce Chain Volume Measures.

The Producer and International Trade Price Indexes are also used:

Scope

The scope of both the Producer and International Trade Price Indexes is primarily linked to the principle purpose of both statistical releases; the compilation of Australian National Accounts and the Balance of Payments.

An understanding the economic principles and framework of both the Australian National Accounts and the Balance of Payments will allow users to fully understand the true scope of the Producer and International Trade Price Indexes in both theory and practice. This detail is available on the next page, The Australian System of National Accounts.

The Australian System of National Accounts

The Australian System of National Accounts (ASNA) is a systematic framework of statistics providing a wide range of information about the economy and its components. At their summary level, the accounts reflect key economic flows: production, income, consumption, investment and saving. At their more detailed level, they are designed to present a statistical picture of the structure of the economy and the detailed processes that make up domestic production and its distribution.

The Input-Output Framework

The Input-Output (I-O) tables form an integral part of the ASNA. They present a comprehensive picture of the supply and use of all products in the economy, and the incomes generated from production. They also provide a much more detailed disaggregation of gross domestic product than is available in the National Income, Expenditure and Production Accounts.  They provide a framework for checking the consistency of statistics on flows of goods and services obtained from quite different kinds of statistical sources - industrial surveys, household expenditure surveys, investment surveys, foreign trade statistics, etc. In national accounting and economic analysis two kinds of I-O tables are referred to:

  • Supply and Use (S-U) tables; and
  • I-O tables, including symmetric I-O tables (product by product or industry by industry matrices which combine supply and use into the one table, with identical classifications of products or industries applied to both rows and columns).

The S-U tables form the starting point for constructing I-O tables. Both the S-U tables and I-O tables provide a means of undertaking detailed analysis of the process of production and the use of goods and services (i.e. products), and of the income generated in that production.

Supply-use framework

In Figure 2.1 below, an example of the composition of the supply-use (S-U) tables that underpin the Input-Output (I-O) tables is presented. The S-U framework comprises of two tables 'supply' and 'use'. The supply table shows the total supply of products from domestic and foreign producers that are available for use in the domestic economy. The use table presents the use of this supply by industries as intermediate inputs and by final users.

  • Within supply is industry, and beneath this is output. Products under output are farmer to grain, baker to bread, and hospital to health services. These all make up total output (A). Also under supply are taxes/subsidies, margins, and imports.
  • Supply equals use. Within use is industry, and beneath this is intermediate input. Products under intermediate input are fertiliser to farmer, flour to baker, and pharmaceuticals to hospital. These all make up total intermediate input (B). Also under use is final demand. Beneath final demand are government, households, capital, exports, and inventories.
  • Gross value added (production) equals total output minus total intermediate input, or A minus B.
  • A minus B equals gross value added income. This includes compensation of employees, other net taxes on production, and gross operating surplus

Figure 2.1 Supply-use tables - framework for the economy

Figure shows an example of the composition of the Supply-Use tables that underpin the Input-Output tables is presented, and the table consists of two sections – ‘Supply’ and ‘Use’.
Within supply is industry, and beneath this is output. Products under output are farmer to grain, baker to bread, and hospital to health services. These all make up total output (A). Also under supply are taxes/subsidies, margins and imports. Supply equals use. Within use is industry, and beneath this is intermediate input. Products under intermediate input are fertiliser to farmer, flour to baker, and pharmaceuticals to hospital. These all make up total intermediate input (B). Also under use is final demand. Beneath final demand are government, households, capital, exports, and inventories. Gross value added (production) equals total output minus total intermediate input, or A minus B. A minus B equals gross value added income. This includes compensation of employees, other net taxes on production, and gross operating surplus.

Presenting the Input-Output Tables

The Input-Output (I-O) tables present a comprehensive picture of the supply and use of all products in the economy, and the incomes generated from production.

They provide a framework for checking the consistency of statistics on flows of goods and services obtained from quite different kinds of statistical sources - industrial surveys, household expenditure inquiries, investment surveys, foreign trade statistics, etc. The Australian System of National Accounts (ASNA), and the I-O tables in particular, serves as a coordinating framework for economic statistics, both conceptually for ensuring the consistency of the definitions and classifications used and as an accounting framework for ensuring the numerical consistency of data drawn from different sources. The I-O framework is also appropriate for data estimation purposes, and for detecting weaknesses in data quality and estimation. By providing information on the structure of, and the nature of product flows through the economy, the I-O tables assist in the decomposition of transactions into prices and volumes for the calculation of an integrated set of price and volume measures. As an analytical tool, input-output data are conveniently integrated into macroeconomic models in order to analyse the link between final demand and industrial output levels.

Input-Output tables can be presented in either basic prices or purchasers’ prices, and the valuation basis for products is an important factor dependent upon which section of the supply-use framework the products are situated.

If users are looking at a use matrix within an I-O table, for the intermediate inputs matrix, industries appear across columns and products across rows. In the intermediate inputs matrix, each cell indicates the amount of a product purchased by each industry as an intermediate input into the industry’s production process.  Within the final demand matrix, products are presented in the rows, and final demand categories (rather than industries) valued at purchasers' prices appear across the columns. The tables below are valued at basic and purchasers’ prices with Output indexes I-O framework at basic prices (Table 2.2) and Input indexes I-O framework at purchasers’ prices (Table 2.3). 

The 'Supply' table of the Input-Output tables

If looking at a supply matrix within an Input-Output table, the domestic output matrix forms the main body of the table. In this matrix, industries appear across columns and products across rows, and each cell indicates the amount of each product that is produced domestically by each industry at basic prices. Total domestic supply by commodity (valued at basic prices) presents the sum of the domestic output and imports. Imports are valued at domestic port value, that is, free on board, which is equivalent to the importer’s customs frontier price. An example of the supply 'output' table is demonstrated in Table 2.2 below.

The 'Use' table of the Input-Output tables

Table 2.3 is an industry-level use table in the supply-use framework. This table comprises the intermediate inputs matrix, final demand matrix, and value-added matrix. The structure of the use table shows the use of products by industries and by final users as well as the value added by industry at purchasers’ prices. Valuation in purchasers’ prices shows inputs to industries and final uses at values that reflect the actual cost to the user of the product. These costs include the costs of transporting the product to the user in addition to any wholesale and retail mark-ups incurred while bringing the product to market.

The intermediate inputs matrix forms the central part of the use table. This represents expenditure of products by industry that are used as an intermediate input into the industry’s production process. These products are valued at purchasers’ prices, meaning that taxes, transportation costs, and wholesale and retail trade margins are embedded in the total along with the underlying value of the product purchased. No distinction is made in the use table between imports and domestically produced output.

The final demand matrix within the ‘Use’ table presents expenditure-side components of GDP, including household and government final consumption expenditures, gross final capital formation, change in inventories and exports.
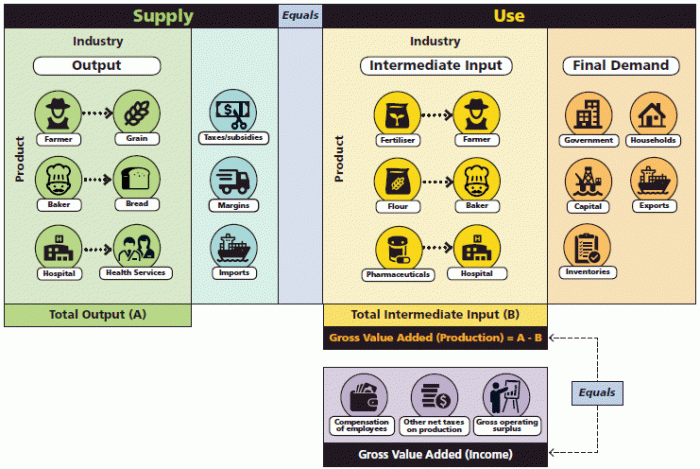
Table 2.2 Output indexes, PPI and ITPI coverage, Input-Output framework at basic prices

Table 2.2 Output indexes, PPI and ITPI coverage, Input-Output framework at basic prices
Looking across the rows of a table at purchasers’ prices, the margin elements are included in the values of the flows of all the products which attract the margin; on the other hand, in a table at basic prices, the margin product flows (e.g. retail trade, road freight, etc.) are shown separately in their own right against the appropriate industry (e.g. transport). Note that as per the 2008 SNA definition of basic prices, transport costs are included in basic prices of other products in those cases where the transport service is not separately invoiced. The I-O Output table consists of the following rows: Intermediate Inputs: Agriculture, forestry & fishing Mining Manufacturing Electricity, gas, water & waste services Construction Wholesale trade Retail trade Accommodation & food services Transport, postal & warehousing Information media & telecommunications Financial & insurance services Rental, hiring & real estate services Professional, scientific & technical services Administrative & support services Public administration & safety Education & training Health care & social assistance Arts & recreation services Other services Primary Inputs: Wages, salaries & supplements Gross operating surplus Commodity taxes (net) Indirect taxes n.e.c (net) Sales by final buyers And the following columns: Intermediate demand: Agriculture Mining Manufacturing Electricity etc Construction Services Final demand: Intermediate use (sub-total) Final consumption expenditure – private Final consumption Expenditure - government Gross fixed capital expenditure – private enterprises Gross fixed capital expenditure – public enterprises Gross fixed capital expenditure – general government Increases in stocks Exports of Goods and Services Final Demand (subtotal) Total supply (grand total) The maximum extent of PPI & ITPI coverage is Intermediate demand.

Table 2.3 Input indexes, Price index coverage, Input-Output framework at purchasers' prices

Table 2.3 Input indexes, Price index coverage, Input-Output framework at purchasers' prices.
There are two alternative treatments of imported products in the tables: direct allocation and indirect allocation. Direct allocation of imports involves allocating all imports directly to the industries which use them. All flows recorded in quadrants 1 and 2 refer only to the use of domestic products, and consequently quadrant 1 does not reflect the technological input structure of the industry. Indirect allocation of imports involves first recording all imports as adding to the supply of the industry to which they are primary and then allocating this supply along the corresponding row of the table to using industries. The result is that flows in quadrants 1 and 2 contain imported and domestically produced products without distinction. Quadrant 1 then better reflects the technological input structure of the industry and quadrant 2 better reflects the product composition of final demand. The I-O Input table consists of the following rows: Intermediate Inputs: Agriculture, forestry & fishing Mining Manufacturing Electricity, gas, water & waste services Construction Wholesale trade Retail trade Accommodation & food services Transport, postal & warehousing Information media & telecommunications Financial & insurance services Rental, hiring & real estate services Professional, scientific & technical services Administrative & support services Public administration & safety Education & training Health care & social assistance Arts & recreation services Other services Primary Inputs: Wages, salaries & supplements Gross operating surplus Commodity taxes (net) Indirect taxes n.e.c (net) Sales by final buyers And the following columns: Intermediate demand: Agriculture Mining Manufacturing Electricity etc Construction Services Final demand: Components of Final Demand (consumption, investment, inventories & exports) Domestic supply: Agriculture Mining Manufacturing Electricity etc Construction Services Total supply (grand total) The maximum extent of PPI & ITPI coverage is Intermediate demand, Imports and Final demand

Supply and use of products in aggregate

At the most aggregate level, the supply and use of products in the National Accounts is the macroeconomic identity equating total supply with total use. Total Supply is the sum of outputs, imports, margins and net taxes (taxes less subsidies on products). Total Use is the sum of intermediate consumption, final consumption of households and governments, capital formation, changes in inventories, and exports.

Gross Domestic Product
There are three approaches which can be used to measure Gross Domestic Product (GDP):

  1. The income approach - involves summing net factor incomes, consumption of fixed capital (depreciation) and taxes less subsidies on production and imports
  2. The expenditure approach - involves summing all final expenditures, changes in inventories and exports less imports of products
  3. The production approach - involves taking the value of products produced by an industry (i.e. output) and deducting the cost of products used up by the industry in the production process (i.e. intermediate consumption) and adding the result across all domestic industries. Taxes less subsidies are added on products if output is valued at basic prices, as recommended in the Australian System of National Accounts (ASNA).

GDP is internationally recognised as the central National Accounts aggregate for measuring national economic performance. It is a measure of production, as distinct from final demand. It measures the value added by the productive activity carried out by all the unit’s resident in an economy. Compiling indexes for tracking the relative change in GDP and its components that can be attributed to price and volume change is one of the primary objectives for ABS Price Indexes.

The individual elements in the value aggregate equation represent detailed product flows that are classified into categories of transactions.

There are two defining aspects of recording transactions: timing and valuation.

Timing of transactions covered

To associate each transaction with a date, the National Accounts use an accrual basis for accounting as outlined in the ASNA. Accrual accounting records flows at the time economic value is created, transformed, exchanged, transferred or extinguished. This means that flows that imply a change of ownership are entered when the change occurs, services are recorded when provided, output at the time products are created and intermediate consumption when materials and supplies are being used.

Valuation

There are two valuation principles in the National Accounts, one for suppliers and one for users. For suppliers, transactions in products are to be valued at basic prices. The basic prices is the price per unit of product receivable by the producer. As the producer does not receive taxes (if any) on products but does receive subsidies (if any) on products, taxes on products are excluded from the  basic price, while subsidies on products are included. Subsidies artificially reduce the sale price, so they are included in the  basic price to obtain a measure of the true value of products produced. Taxes on products, if included, would artificially increase the price and so are excluded. Separately invoiced transportation charges paid by consumers, or any distribution margins added by other, retail/wholesale service producers are also excluded from the basic price. On the other hand, the user, as purchaser, pays all of these charges, and users’ purchases are therefore valued at purchasers’ prices, which add taxes net of subsidies on products and margins for included transportation, insurance, and distribution services to the basic price.

Accordingly, output and imports are valued at basic prices, to which are added taxes less subsidies on products (net taxes) and margins to arrive at total supply. The components of total uses (including both final expenditure and intermediate consumption) are valued at purchasers’ prices. This is interpreted for the final consumption of households and government. For capital formation expenditures, the notion of purchasers’ prices also includes the costs of setting up fixed capital equipment. For exports, purchasers’ prices include export taxes net of subsidies, according to the free on board value at the Australian customs frontier.

Comparing basic and producers' prices

The Australian System of National Accounts (ASNA) uses two kinds of output prices, basic price and producers' price.

The basic price is the amount receivable by the producer from the purchaser for a unit of a product produced as output, minus any tax payable, plus any per unit subsidy receivable on that unit as a consequence of its production or sale. It excludes any transport charges invoiced separately by the producer. However, delivery charges that are not separately invoiced are included in the basic price.

Example of a basic price:

Basic price = the amount received by the producer from the purchaser plus any subsidies received on a product.

Includes:

  • subsidies on products
  • other taxes on production (for example, carbon tax)

Excludes:

  • taxes on products (for example, GST, excise)
  • other subsidies on production
  • retail and wholesale margins
  • insurance and transport charges separately invoiced.

The producers’ price is the amount receivable by the producer from the purchaser for a unit of a product produced as output, including any tax that is incorporated within the sales price and excluding any subsidy that reduces the sales price, on that unit as a consequence of its production or sale. It excludes any transport charges invoiced separately by the producer but includes delivery charges not separately invoiced.

Example of a producers’ price:

Producers’ price = the amount received by the producer from the purchaser

Excludes:

  • deductible taxes on products (for example, GST) invoiced to the purchaser and subsidies on products¹
  • retail and wholesale margins
  • insurance and transport charges separately invoiced.

The producers’ price and the basic price are two measures of output prices (that is, prices receivable). They differ in the way they treat non-deductible taxes on products, and producers’ subsidies on products.

Example of comparison between producers’ price and the basic price:

Producers’ price = Basic Price

  • plus (Producers’) non-deductible taxes on products
  • minus (Producers’) subsidies on products.

Neither the producers’ nor the basic price includes any amounts receivable in respect of consumption taxes, such as the Goods and Services Tax, or similar deductible taxes. The difference between the two is that to obtain the basic price, any other tax payable per unit of output is deducted from the producers’ price while any subsidy receivable per unit of output is added.

In the context of the Australian PPIs, the output price indexes measure changes in basic prices. Output is recorded at basic prices; any tax on the product actually payable on the output is treated as if it were paid by the purchaser directly to the government instead of being an integral part of the price paid to the producer. Any subsidy on the product is treated as if it were received directly by the purchaser and not the producer. The basic price measures the amount retained by the producer and is, therefore, the price most relevant for a producer's decision-making.

Footnotes

  1. The Goods and Services Tax (GST) is excluded from all the prices recorded in the PPI because it is deductible on business to business transactions.

Use of price indexes in National Accounts component aggregates

In the Australian economy, millions of economic transactions take place every day involving the production and sale of goods and services (products). The monetary value of each of these transactions is a product of the quantity produced or sold at a price per unit. In a particular period, the total value of all transactions taking place in an economy is simply the sum of the individual transaction values in that period. This is referred to as the current price value.

The calculation of Gross Domestic Product (GDP) using the income approach is compiled only in current prices and does not directly utilise price indexes; proxy volume estimates are produced for this approach using the implicit price deflator from the expenditure account (the implicit price deflator is detailed in Chapter 4 General Compilation Methodology, National Accounts and Balance of Payments - Derived Measures).

The suite of ABS Price Indexes used in compiling the Australian National Accounts are not the only mechanisms used to derive volume measures. Other techniques include direct volume measurement and the use of quantity revaluation (i.e. multiplying current period quantities by a reference period unit value) in calculating volumes of homogeneous export products such as wheat and coal). Quantity revaluation can be seen as conceptually consistent with the action of deflation using average unit values as opposed to price indexes. Average unit values can differ to equivalent price indexes due to changes in quality and composition.

In some circumstances price indexes are combined to produce aggregate deflators (for example, combining a Wage Price Index component with a Producer Price Index component). These composite measures are required when the value aggregate from the Australian National Accounts has a broader scope than the contributing price indexes.

For a more detailed explanation of these concepts, see Australian System of National Accounts: Concepts, Sources and Methods.

‘Gross Industry’ versus ‘Net Industry’ approach to defining scope

The compilation of Australian National Accounts is conceptually done on a ‘Gross Industry Basis’, and this means that the scope of data collection includes all transactions that occur within an industry and transactions between that industry and other intersecting industries.  For example, transactions captured for a motor vehicle manufacturing gross industry index includes both the sales of the parts (this includes sales of parts to other businesses within the same industry) and the sales of the finished cars, even though the price change of the parts would be included in the price change of the finished cars.

An alternative approach to the ‘Gross Industry Basis’ approach is the ‘Net Industry Approach’ which restricts the scope of collection to transactions that occur within the industry, and in effect, exclude intra-industry transactions in a manner similar to a set of consolidated accounts of a group of enterprises.

The PPIs are recorded on a ‘Gross Industry Basis’ to ensure consistency with the Australian System of National Accounts compilation processes.

Input and Output price indexes

Input price indexes

The valuation basis for transactions covered by an input price index is purchasers’ prices.

Purchasers’ prices are inclusive of non-deductible taxes on products, and transport and trade margins (that is, the prices recorded in the index should be the actual price paid by the user which relates to the price of products delivered into store, delivered on site, etc.).

Input price indexes measure the average change in the prices of products used in the production process. These products or intermediate inputs to the production process are products produced elsewhere in the domestic economy or are imported. Primary inputs such as land, labour and capital are excluded from the Producer Price Indexes.

Output price indexes

The preferred valuation basis for the transactions covered by an output price index is at basic prices, although purchasers’ prices may be used when valuation at basic prices is not feasible.

Both basic and producer prices are prices that exclude transport and trade margins. The distinction between basic and producer prices relates to the treatment of taxes and subsidies on products are:

  • basic prices are prices before taxes on products are added and subsidies on products are subtracted.
  • purchasers’ prices include, in addition to basic prices, taxes less subsidies on products (excluding value added taxes. The point at which prices are measured is ex-factory, ex-farm, ex-service provider, etc.).

The main difference between basic and producer prices is generally any per unit subsidy that the producer receives. However, on occasions producer prices may have to be used when information on subsidies is not available. In most instances, producers in the Australian economy do not receive subsidies, in which case the producer prices and basic prices will be the same.

The suite of ABS output price indexes measure the prices received by producers irrespective of whether their products are sold on the domestic market or as exports.

Import and export prices

Both the Import Price Index and the Export Price Index are valued using a free on board (f.o.b.) pricing basis. The value of products measured on an f.o.b. basis includes all production and other costs incurred up until the products are placed on board the international carrier for either export. For imports, freight and insurance charges involved in shipping goods from foreign to Australian ports are excluded from the prices used in the index, as are Australian import duties and taxes. Similarly, exports are priced on a f.o.b. basis at the main Australian ports of export. Exports are exempt from taxes on products.

Coverage

While coverage of goods producing industries is relatively comprehensive, the coverage of services industries is being progressively improved for both the Producer and International Trade Price Indexes. The expansion of new and emerging industries in both the Producer and International Trade Price Indexes is a key objective for the ABS to ensure both publications continue to effectively support the compilation of Australian National Accounts and Balance of Payments.

Non-market goods and services

Non-market activities involve products produced by non-profit institutions serving households (NPISHs) or government that are supplied free, or at prices that are not economically significant, to other institutional units or the community as a whole. These comprise both non-market services provided to individuals (such as health and education services) where a specific transaction can be identified but there is no economically significant price; as well as collective services (such as public administration and defence) where no individual transactions can be identified as the services are consumed by the entire population, indirectly, continuously and largely involuntarily. For more information on non-market activities refer to the Australian System of National Accounts: Concepts, Sources and Methods.

Non-market activities have been historically excluded from the scope of Producer Price Indexes due to the fact that no market transaction takes place and therefore no change in transaction price can be measured. For this reason, most countries define non-market activities as falling outside the scope of Producer Price Indexes.

The Information Paper: Outcome of the Review of the Producer and International Trade Price Indexes, 2012 states that the basis of PPIs and ITPIs are to capture price movements for all products represented in the Input-Output (I-O) framework. Therefore, non-market activities should be captured. Where the non-market activity resembles a market activity (for example, education), the market price index may serve as a proxy for a non-market price movement

However, some non-market activity where market equivalents are unavailable (for example, national defence) is valued at production cost, and there is no basis for constructing an explicit price index. The ABS will investigate how to reflect products such as non-market prices (as represented in the Australian National Accounts) within the Producer Price Index release.

Classification

Classifications are a set of defined groupings or categories, based on common relationships, into which all members of statistical units can be divided or arranged. These groupings or categories can be ordered systematically and must be mutually exclusive and exhaustive.

The classification structure forms the index structure and determines which products from which industries of the economy are needed to construct price indexes. Further, the classification serves as the basic language allowing sources of value data and price indexes to have a direct concordance.

Classifications enable an exact definition of which products are to be included in an index, and provide a meaningful and cohesive structure for reporting on price movements for different subsets of the price basket.

The ABS uses many international and local classification systems.

In the price index context, the availability of value data will dictate the lowest level of detail that might be possible. Although a classification may be conceived according to economic theory or user requirements using a top-down approach, in application the ABS collects data about individual products and then aggregates them according to the classification structure (i.e. a bottom-up approach).

In application, products used in the compilation of the Producer and International Trade Price Indexes can be classified according to more than one classification structure.

Please refer to Chapter 2, General Methodology of this release for detailed information on the current classification systems used in the compilation of the Producer and International Trade Price Indexes.

Deflator used for Australian National Accounts and Balance of Payments

PPIs and ITPIs are used to deflate values of a number of components in the Australian National Accounts, including industry inputs and outputs, sales, capital expenditure and inventory data to produce chain volume measures. The deflation process is integral to the compilation of Gross Domestic Product (GDP) and its components. In addition, ITPIs are used in the compilation of Balance of Payments Chain Volume Measures.

Price deflation is achieved by dividing the current price value for a period (quarter or year) by a measure of the price component (usually in the form of a price index) for the same period. This technique revalues the current price value in the prices of a base period (in the Australian volume measures this is generally the previous year)¹.

Revaluation of the current period values using earlier period prices is defined in the following format:

\(\frac{V^t}{\big(\frac{P^t}{P^{t-1}}\big)}=P^{t-1}Q^t\)

  \(\Delta Q=\frac{P^{t-1}Q^t}{P^{t-1}Q^{t-1}}\)

Where \(V\) refers to value, \(P\) refers to price, \(Q\) refers to quantity (or in National Accounts terminology, volume), and the superscripts \(t \space t-1\) refer to current and previous periods respectively.

More information on the use of price indexes in the production of the Australian National Accounts can be found in Australian System of National Accounts: Concepts, Sources and Methods and Information Paper: Australian National Accounts, Introduction of Chain Volume and Price Indexes.

Short-term indicator of inflationary trends

While PPIs are of value in their own right, their use is enhanced when presented in the Final Demand framework. Final Demand measures the price change of products (goods and services) consumed with no further processing. For example, sugar cane is a preliminary product and used as an input into the production of raw sugar. In turn raw sugar is an intermediate product which is then used to produce the final product, refined sugar. Final Demand captures final products destined for final consumption, with no further processing. 

An Illustration of the Final demand is presented below. The two examples show the three stages: preliminary, intermediate, and final for sugar and bread.

Final Demand

Illustration of the Final demand
This image illustrates two examples for the three stages: preliminary products, intermediate products, and final products: 1. Sugar cane is a preliminary product and used as an input into the production of raw sugar. In turn raw sugar is an intermediate product which is then used to produce the final product, refined sugar. 2. Wheat is a preliminary product and used as an input into the production of flour. In turn flour is an intermediate product which is then used to produce the final product, bread.

Escalation clauses within contracts

Price indexes are also often used in contracts by businesses and government to adjust payments and/or charges to take account for changes in the prices of products. A PPI offers an independent indicator of the change in prices of the product under contract. Indexation is common in long-term contracts.

IMPORTANT: While the ABS recognises that the price indexes it produces are used in this way, the ABS neither endorses nor discourages such use. The ABS does not advise, comment or assist in preparing or writing contracts. See Appendix 1 for a discussion on the ABS policy concerning the use of price indexes for contract indexation purposes.

International organisations

The ABS provides Australian PPIs and ITPIs to a range of international agencies, including the International Monetary Fund (IMF) and the Organisation for Economic Co-operation and Development (OECD) to enable economic monitoring and international comparisons. The provision of PPIs and ITPIs to the IMF also fulfils Australia’s obligations as part of the IMF Special Data Dissemination Standards (SDDS). The SDDS set out criteria concerning the statistics to be produced, their periodicity, release procedures etc. A brief overview of these standards can be found on the IMF Dissemination Standards Bulletin Board.