Wage Price Index: Concepts, Sources and Methods
Provides comprehensive information about the Wage Price Index (WPI) including concepts underlying the index and the data sources and methods used
Contents
Chapter 2 - Purposes and uses of the Wage Price Index
Chapter 3 - Historical background
Chapter 4 - Price index theory
Chapter 5 - Coverage and classifications
Chapter 7 - Weights and their sources
Chapter 10 - Wage Price Index calculation in practice
Chapter 11 - Re-referencing and linking price indexes
Chapter 12 - Outputs and dissemination
Chapter 13 - The System of Price Statistics
Previous catalogue number
This release previously used catalogue number 6351.0.55.001.
Chapter 1 - Introduction
Aim of this publication
1.1 The Wage Price Index (WPI) is an important economic indicator. It measures changes in the price employers pay for labour due to market factors. The WPI is compiled by the ABS for quarters ending in March, June, September and December each year. The quarterly index numbers are published approximately seven weeks after the end of each quarter in the publication Wage Price Index, Australia (cat. no. 6345.0).
1.2 This publication provides information about the concepts, sources and methods used to compile the WPI. Specifically, it provides information on:
- purposes and uses of the WPI
- historical background
- price index theory
- coverage and classifications
- sampling
- weights and their sources
- price collection
- quality change
- WPI calculation in practice
- re-referencing and linking price indexes
- outputs and dissemination
- the system of price statistics in the ABS
This publication is intended for users who wish to gain a deeper understanding of the index.
Information about the Wage Price Index
1.3 Wage Price Indexes (WPIs) were first produced by the ABS in the December quarter 1997. In the September quarter 2004, the inclusion of non-wage indexes complimented the existing suite of WPIs and were combined to create Labour Price Indexes (LPIs). In March 2012 ABS program reductions led to the non-wage and LPI indexes being discontinued, with the September quarter 2011 representing the last in the series. This version of the Concepts, Sources and Methods publication focuses on information pertaining to WPIs. More information on the LPIs can be found in the Labour Price Index: Concepts, Sources and Methods, 2004 (cat. no. 6351.0.55.001).
How to contact the ABS regarding this publication
1.4 The ABS intends to update this publication periodically. Individual chapters will be updated on an ongoing basis but updates to the whole PDF version of the document will only take place biennially. The ABS would welcome comments from the users of statistics covered in this publication. You may direct your comments or questions to:
Wage Price Index Section
Australian Bureau of Statistics
Reply paid K881
Perth WA 6842
by telephone: (08) 93605151
or by email: wage.price.index@abs.gov.au
Chapter 2 - Purposes and uses of the Wage Price Index
Introduction
2.1 This chapter discusses the purposes and uses of the Wage Price Index (WPI).
What the Wage Price Index measures
2.2 The WPI measures changes in the price employers pay for labour that arise from market factors. Specifically, the WPI measures changes in the price of wages and salaries. Wages and salaries reflect payments in cash or kind that are made at regular intervals (e.g. weekly, monthly) and include: piecework payments; enhanced or special allowances for working overtime or unsocial hours (e.g. nights, weekends); regular supplementary allowances (e.g. housing allowances, allowances to cover the cost of travel to and from work); payments for employees away from work for short periods (e.g. holidays) but not including absences for sickness or injury; and bonus and incentive payments. A full definition of wages and salaries is provided in paragraph 7.44 of the System of National Accounts [see Australian National Accounts: Concepts, Sources and Methods, Edition 1 2012 (cat. no. 5216.0)].
2.3 The WPI is a Laspeyres-type index covering wage and salary costs. It measures the change in the price between the current period and the price at a given base period with the quantity and quality of labour services being held constant.
2.4 To ensure that the quantity and quality of labour services are held constant, changes in the composition of the labour force, hours worked, or changes in characteristics of employees (e.g. work performance) are all excluded from the index.
2.5 Four sets of indexes are compiled. These are:
- ordinary time hourly rates of pay excluding bonuses
- ordinary time hourly rates of pay including bonuses
- total hourly rates of pay excluding bonuses
- total hourly rates of pay including bonuses.
Uses of the Wage Price Index
2.6 The primary use of the WPI is as a deflator in the preparation of the National Accounts. This use is described in more detail in Chapter 13.
2.7 The WPI informs wages policy in Australia and is considered by Fair Work Australia when determining award wages.
2.8 The WPI is also used to monitor inflationary pressure in the economy and determine macro economic performance. For example, the WPI is one of the sources used by the Reserve Bank of Australia when reviewing monetary policy.
2.9 The WPI may also be used in indexation arrangements in business contracts, where the WPI may account for inflation of the wage component of costs. For more information on using price indexes in contracts, refer to Use of Price Indexes in Contracts which is available on the ABS website.
Chapter 3 - Historical background
Introduction
3.1 The history of Australian Bureau of Statistics (ABS) collections that have been used to measure the price of labour are outlined in this chapter.
Award Rates of Pay Indexes
3.2 The Award Rates of Pay Indexes (ARPI) series was produced from the early 1950s to 1997 and was published in Award Rates of Pay Indexes, Australia (cat. no. 6312.0). ARPI was designed to measure changes in award rates of full-time adult wage and salary earners.
3.3 The series was published on a monthly basis and measured minimum award rates of pay for adult employees covered by awards. It did not measure relative levels of award rates of pay between states and industries and excluded the effect of compositional change in awards, occupations and industries over time.
3.4 Changes to the Australian Industrial Relations environment (see paragraphs 3.19 to 3.30) meant that from the 1980s onwards, awards were becoming less dominant in setting the pay of employees. As a consequence, the ARPI series began to apply to a diminishing proportion of the labour market, and was discontinued in 1997.
Wage Cost Index and Labour Price Index
3.5 In response to the diminished relevance of the ARPI series, the Wage Cost Index (WCI) was introduced in 1997. It was produced on a quarterly basis and was published in Wage Cost Index, Australia (cat. no. 6345.0). The WCI produced four main indexes. These were:
- ordinary time hourly rates of pay excluding bonuses
- ordinary time hourly rates of pay including bonuses
- total hourly rates of pay excluding bonuses
- total hourly rates of pay including bonuses.
3.6 Whilst all four indexes tracked changes in the price of labour in the Australian labour market, the indexes that included bonuses reflected changes in the quality of work performed. It is for this reason that only the indexes excluding bonuses can be considered "pure price indexes". That is, they measure changes in the price of labour and are unaffected by changes in the quantity and quality of work performed.
3.7 The WCI measured changes in hourly wage and salary rates arising from a range of sources including: award variations; enterprise and workplace agreements; centralised wage fixation; individual contracts; and informal arrangements. The index followed pay movements in jobs, regardless of whether remuneration was set by award or through some form of non-award agreement.
3.8 The WCI was disaggregated by the following classifications:
- Broad institutional sector - Public / Private, Standard Institutional Sector Classification of Australia (SISCA), 1998 (cat. no. 1218.0)
- Industry division, Australian and New Zealand Standard Industrial Classification (ANZSIC), 1993 (cat.no. 1292.0)
- State and Territory, Australian Standard Geographical Classification (ASGC), 1996 (cat. no. 1216.0)
- Occupation, Australian Standard Classification of Occupations (ASCO), 1997 (cat. no. 1220.0).
3.9 The survey focused exclusively on wage and salary rates until the June quarter 2002, when the scope was increased to incorporate the collection of non-wage costs. The information was first published in the September quarter 2004 and resulted in four non-wage indexes being released. These were:
- Payroll tax
- Workers' compensation
- Employer contributions to superannuation
- Annual leave and Public holidays
3.10 These indexes were combined with the total hourly rates of pay excluding bonuses index and the total hourly rates of pay including bonuses index to produce composite or total labour price indexes. Both the non-wage and total labour price indexes were released on a financial year frequency. For reasons outlined in paragraph 3.6, only the Labour Price Index excluding bonuses could be considered a "pure price index" .
3.11 The increase in scope was reflected by a change in the collection's name from the Wage Cost Index to the Labour Price Index (LPI). The change of name also helped to identify the publication as one of the price indexes produced by the ABS. The catalogue number remained as 6345.0.
Change to classifications
3.12 In the September quarter 2008, the last occupation based indexes were released. After consultation with users and stakeholders it was found that the occupation based indexes were of lower priority than the industry series. Discontinuing these indexes allowed the work program to focus on various projects aimed at optimising the quality of the more heavily used industry series.
3.13 In the September quarter 2009, the collection adopted the revised, ANZSIC 2006 industry classification. To assist users with the change in classification, the complete time series for published data (i.e. from the September quarter 1997) were made available on the ABS website, on an ANZSIC 2006 basis. At the same time, the updated institutional standard from the 2008 Standard Economic Sector Classification of Australia (SESCA) was also applied.
3.14 The Australian Standard Geographical Classification (ASGC) was used by the ABS for the collection and dissemination of geographically classified statistics until July 2011. From 2011 onwards the ABS has adopted a new statistical geography classification called the Australian Statistical Geography Standard (ASGS).
Wage Price Index
3.15 In 2012, due to work program reductions, the ABS discontinued non-wage and labour price indexes. The last data in these series can be found in the September quarter 2011 edition of Labour Price Index, Australia (cat. no. 6345.0).
3.16 To represent the reduced scope of the collection, the name of the series was changed to the Wage Price Index (WPI) from the September quarter 2012. This publication continues to be produced on a quarterly basis and retains the original catalogue number.
3.17 The WPI produces four main indexes. These are:
- ordinary time hourly rates of pay excluding bonuses
- ordinary time hourly rates of pay including bonuses
- total hourly rates of pay excluding bonuses
- total hourly rates of pay including bonuses.
3.18 The WPI is disaggregated by the following classifications:
- Broad institutional sector (Public / Private), SESCA, 2008 (cat. no. 1218.0)
- Industry division, ANZSIC, 2006 (cat.no. 1292.0)
- State and Territory, ASGS, 2011 (cat. no. 1270.0.55.001).
Australian industrial relations and pay setting environment
3.19 Governments have regulated the Australian labour market since colonial times. An awards system was originally introduced in the late 1800s to prevent and settle disputes arising between employers and employees who could not reach agreement on terms of employment.
3.20 Prior to the 1980s, the Australian industrial relations environment was a highly centralised system. From the 1980s onwards, the Australian industrial relations system had become characterised by more decentralised arrangements for labour-employer bargaining. As a consequence of decentralisation, the magnitude and timing of pay changes became less homogenous across the labour market, and lead to collections, such as ARPI, becoming less relevant. In recognition of the changing industrial relations environment, the WPI was developed. The WPI utilises sampling methodology which provides a representative selection of jobs across the Australian economy. This ensures that the WPI is sensitive to pay changes that occur across the various segments of the labour market.
3.21 From 1991 the Australian Industrial Relations Commission (AIRC) introduced a series of bargaining principles (the Restructuring and Efficiency Principle, the Structural Efficiency principle, and the Enterprise Bargaining Principle) which provided a framework for decentralised bargaining and workplace reform.
3.22 Two key pieces of Federal legislation were introduced in the 1990s. The Industrial Relations Reform Act 1993 encompassed provisions to facilitate enterprise bargaining in non-unionised workplaces. The opening up of collective bargaining to workers not represented by unions meant that wages and employment conditions could be changed without unions being directly involved in negotiations. Further labour market reforms were undertaken through the Workplace Relations Act 1996 which allowed the development of individual worker agreements (Australian Workplace Agreements) as well as continuing collective worker agreements (Certified Agreements) and prohibited unions intervening in non-union agreements. The legislation also facilitated the simplification of awards. At the same time, industrial reform took place at the State level aimed at encouraging decentralised bargaining and workplace reform.
3.23 In the 1990s, the method of wage determination moved away from industry-based awards whereby all employees in a particular industry were covered by the same wages and employment conditions. In place of these awards, more diverse agreements were set up to cover the pay and conditions under which employees worked.
3.24 By May 2002, 20% of employees had their pay set at exactly the applicable award rate of pay, 38% had their pay set in a collective agreement, 39% had their pay set in an unregistered individual agreement and 2% had their pay set by a registered individual agreement (Employee Earnings and Hours, 2002 (cat. no. 6306.0)).
3.25 Work Choices legislation came into effect in March 2006. The Work Choices legislation made use of the corporations power of the Commonwealth to establish a national industrial relations system covering approximately 80% of workers. As well as significantly increasing the scope of the national industrial relations system, and setting minimum conditions, Work Choices streamlined Certified Agreements and Australian Workplace Agreements (AWAs).
3.26 The Australian Fair Pay Commission was established as part of Work Choices to set the Federal Minimum Wage. This replaced the National Wage Cases at the AIRC that previously set the minimum wage.
3.27 By May 2006, the proportion of employees with their pay set by a registered individual agreement had risen to 3% due to the effect of AWAs, those with their pay set exactly at the award rate of pay had dropped to 19%, those with pay set by collective agreement had risen to 41% and those with pay set by unregistered individual agreement had dropped to 32% (Employee Earnings and Hours, 2006 (cat. no. 6306.0)).
3.28 With a change in government in 2007, the first changes made to industrial relations in 2008 related to the Workplace Relations Amendment (Transition to Forward with Fairness) Act 2008. These amendments banned the creation of new AWAs, established a temporary employment instrument known as Individual Transitional Employment Agreements (ITEAs), introduced a no-disadvantage test, and began a round of award modernisation. These transitional arrangements were in place until 2010 and the process of award modernisation led to a decrease in the number of awards from over 1,500 to 122.
3.29 In 2009, the federal government introduced the Fair Work Act 2009. Fair Work Australia (FWA) is the national workplace relations tribunal created under the new legislation. It replaced the AIRC and also performs functions previously performed by Workplace Australia and the Australian Fair Pay Commission. FWA also sets the minimum wage and employment conditions.
3.30 By May 2010 only 15% of employees had their pay set exactly at the award rate, collective agreements accounted for 43% of pay setting of employees and the number of employees with pay set by an individual agreement had risen to 37% (Employee Earnings and Hours, 2010 (cat. no. 6306.0)).
Historical WPI
3.31 Graph 3.1 shows wage inflation since the September quarter 1998 when the first through-the-year percentage changes were published. It compares the quarterly percentage changes in the total hourly rates of pay excluding bonuses in original terms to the through-the-year trend movement.
Chapter 4 - Price index theory
Introduction
4.1 This chapter describes the price index theory underpinning the WPI. A more comprehensive exploration of price index theory can be found in corresponding chapters of Consumer Price Index: Concepts, Sources and Methods, 2011 (cat. no. 6461.0).
4.2 As the name indicates, the WPI is a price index. Price indexes provide a convenient and consistent way of presenting price movement information for items. In the WPI, the items of interest are jobs. However, the general term "item" is used throughout the chapter as it is consistent with general price index theory.
4.3 An index number on its own has little meaning. The value of a price index stems from the fact that index numbers for any two periods can be used to directly calculate price change between those periods. For example, the WPI All sectors Australia index number of 110.5 in the December quarter 2011 compared to the index number of 106.6 in the December quarter 2010 informs the user that Australian wage prices have risen by 3.7% in the 12 month period described (ie [110.5 - 106.6]/106.6 x 100).
The concept of a price index
Comparing prices
4.4 There are many situations where there is a need to compare two (or more) sets of observations on prices. For example, a business may want to compare the price of labour today with that from an earlier period. An employer might want to compare the increase in wages in their organisation with those across the industry. An economist may be interested in understanding wage pressures across the economy.
4.5 In some situations the price comparisons might only involve a single item. Here it is simply a matter of directly comparing the two price observations. In other circumstances the required comparison is of prices across a range of items. In this instance a method is required for combining the prices allowing for the fact that they have many different tasks or quantities of measurement. This is where price indexes play an extremely useful role.
The basic concept
4.6 Price indexes such as the WPI enable prices for a common item or group of items to be compared at different points in time. In order to compare the sets of prices it is necessary to designate one set the ‘reference’ set and the other the ‘comparison’ set. By convention, the reference price set is used as the base (or first) period for constructing the index and is given an index value of 100.0. For example, suppose for a single item the average of prices in set 1 was $15 and for set 2 it was $30. Designating set 1 as the reference set gives an index of 200.0 (30/15×100) for the comparison set while designating set 2 as the reference set gives an index of 50.0 (15/30×100) for the comparison set.
4.7 The most common comparison is between sets of prices at two points in time (temporal indexes). The points in time can be adjacent (this quarter and the previous quarter) or many periods apart (this year and ten years earlier). Typically the method is to nominate one set of prices as the reference period and to revalue the quantities of items purchased in the base period by prices in the second (or comparison) period. The ratio of the revalued comparison period to the value of the reference period provides a measure of the price change between the two periods.
4.8 The handling of quantity changes that occur in response to changes in relative prices is fundamental to price index construction. Changes in the relative importance of items being priced can have a significant effect on index movements.
Major index formulas
4.9 In presenting index number formulas a simple starting point is to compare two sets of prices. Consider price movements between two time periods, where the first period is denoted as period 0 and the second period as period t (period 0 occurs before period t). In order to calculate the price index, the quantities need to be held fixed at some point in time. The initial question is what period should be used to determine the quantities. The options are to use:
(i) The quantities of the first (i.e. earlier) period.
This approach answers the question ‘how much would it cost in the second period, relative to the first period, to purchase the same quantities of items as purchased in the first period’. Estimating the cost in the second period’s prices simply requires multiplying the quantities of items purchased in the first period by the prices that prevailed in the second period. A price index is obtained from the ratio of the revalued cost using the second period prices to the cost in the first period. This approach was proposed by Laspeyres in 1871 and is referred to as a Laspeyres price index. It may be represented, with a base of 100.0, as:
\((4.1) \space I_{Lt} =\frac{\sum{p_{it}}q_{i0}}{\sum{p_{i0}}q_{i0}} \times 100\)
where:
\(p = price \\ q = quantity \\ i = item. \)
(ii) The quantities of the second (or more recent) period.
This approach answers the question ‘how much would it have cost in the first period, relative to the second period, to purchase the same quantities of items as purchased in the second period'. Estimating the cost in the first period simply requires multiplying the quantities of items purchased in the second period by the prices prevailing in the first period. A price index is obtained from the ratio of the cost in the second period to the revalued cost using the first period’s prices. This approach was proposed by Paasche in 1874 and is referred to as a Paasche price index. It may be represented, with a base of 100.0, as:
\((4.2) \space I_{Pt} =\frac{\sum{p_{it}}q_{it}}{\sum{p_{i0}}q_{it}} \times 100\)
(iii) A combination (or average) of quantities in both periods.
This approach tries to overcome some of the inherent difficulties of using quantities of items fixed at either point in time. In the absence of any firm indication that either period is the better to use as the base or reference, then a combination of the two is a sensible compromise. In practice this approach is most frequent in:
a) the Fisher Ideal price index, which is the geometric mean of the Laspeyres and Paasche indexes:
\((4.3) \space I_{Pt} =(I_{Lt}I_{Pt}) ^{\frac{1}{2}}\)
b) the Törnqvist price index, which is a weighted geometric mean of the price relatives where the weights are the average shares of total values in the two periods, that is:
\((4.4) \space I_{Tt}=\prod_\limits{i}\big(\frac{p_{it}}{p_{i0}}\big)^{s_{i}}\)
where \(s_{i}=\frac{1}{2}\big(e_{i0}/\sum e_{i0}+e_{i1}/\sum e_{i1}\big)\) is the average of the expenditure shares for the \(i^{th}\) item in the two periods.
4.10 The Fisher Ideal and Törnqvist indexes are often described as ‘symmetrically weighted indexes’ because they treat the weights from the two periods equally.
4.11 All price indexes in the ABS use the Laspeyres price index formula. This is largely because the weights used are held fixed at some earlier base period. On the other hand the Paasche, Fisher Ideal and Törnqvist formulas all require current period weights. Timely information of this nature is often very difficult to obtain.
4.12 It should be noted that the different index formulas produce different index numbers and thus different estimates of price movement. Typically the Laspeyres formula will produce a higher index number than the Paasche formula, with the Fisher Ideal and the Törnqvist index numbers falling between the two. In other words the Laspeyres index will generally produce a higher measure of price increase (or lower decrease) than the other formulas and the Paasche index a lower measure of price increase (or larger decrease).
4.13 Only the Laspeyres price index formula will be considered from this point. Further information regarding price index theory can be found in Consumer Price Index: Concepts, Sources and Methods, 2011 (cat. no. 6461.0).
4.14 The Laspeyres formula above is expressed in terms of quantities and prices. In practice, quantities might not be observable or meaningful. Thus in practice the Laspeyres formula is typically estimated using expenditure shares to weight price relatives - this is numerically equivalent to the formula (4.1) above.
4.15 To derive the price relatives form of the Laspeyres index, multiply the numerator of equation (4.1) by \(\frac{p_{i0}}{p_{i0}}\)and rearrange to obtain:
\((4.5) \space I_{t} = \sum \frac{p_{it}}{p_{io}}\big( \frac{p_{i0}q_{i0}}{\sum p_{i0}q_{i0}}\big)\times 100\)
where the term in parentheses represents the expenditure share of item \(i\) in the reference (or, more commonly labelled, base) period. Let:
\((4.6) \space w_{i0} = \frac{p_{i0}q_{i0}}{\sum p_{i0}q_{i0}}\)
then the Laspeyres formula may be expressed as:
\((4.7) \space I_{it}=\sum w_{i0} \big( \frac{p_{it}}{p_{i0}}\big)\times 100\)
where \(\frac {p_{it}}{p_{i0}}\)is the price relative for the \(i^{th}\) item
4.16 The important point to note here is that if price relatives are used then value (or expenditure) weights must also be used. On the other hand, if prices are used directly rather than in their relative form, then the weights used must be quantities.
| Price₀ | Quantity₀ | Expenditure₀ | Expenditure shares₀ | Price relatives | |
|---|---|---|---|---|---|
| Item | p ᵢ₀ | q ᵢ₀ | e ᵢ₀ | w ᵢ₀ | p ᵢ₀/p ᵢ₀ |
| 1 | 2.50 | 2 000 | 5 000 | 0.4310 | 1.0000 |
| 2 | 3.00 | 500 | 1 500 | 0.1293 | 1.0000 |
| 3 | 4.50 | 200 | 900 | 0.0776 | 1.0000 |
| 4 | 1500.00 | 2 | 3 000 | 0.2586 | 1.0000 |
| 5 | 30.00 | 40 | 1 200 | 0.1035 | 1.0000 |
| Total | 11 600 | 1.0000 | |||
| Priceₜ | Quantityₜ | Expenditureₜ | Expenditure sharesₜ | Price relatives | |
| Item | p ᵢₜ | q ᵢₜ | e ᵢₜ | w ᵢₜ | p ᵢₜ/p ᵢ₀ |
| 1 | 2.75 | 2 000 | 5 500 | 0.4532 | 1.1000 |
| 2 | 4.00 | 450 | 1 800 | 0.1483 | 1.3333 |
| 3 | 6.50 | 130 | 845 | 0.0696 | 1.4444 |
| 4 | 1000.00 | 3 | 3 000 | 0.2472 | 0.6667 |
| 5 | 33.00 | 30 | 990 | 0.0817 | 1.1000 |
| Total | 12 135 | 1.0000 | |||
| Index numbers | |||||
| Index formula | Period 0 | Period t | |||
| Laspeyres | 100.0 | 104.5 | |||
The following illustrates the Laspeyres index number calculation:
\(Laspeyres = 100.0 \times [(0.4310 \times 1.1000) + (0.1293 \times 1.3333) + (0.0776 \times 1.4444) \space + \)
\( (0.2586 \times 0.6667) + (0.1035 \times 1.1000)]. \)
Generating index series over more than two time periods
4.17 Most users of price indexes require a continuous series of index numbers at specific time intervals. There are two options for applying the Laspeyres formula when compiling a price index series:
(i) select one period as the base and separately calculate the movement between that period and the required period, which is called a ‘fixed base’ or ‘direct’ index;
(ii) calculate the period to period movements and 'chain' these (i.e. calculate the movement from the first period to the second and the second to the third, with the movement from the first period to the third obtained as the product of these two movements).
4.18 The calculation of direct and chain indexes over three periods (0, 1, and 2) using observations on items as used in Table 4.1 is shown in Table 4.2. The procedures can be extended to cover many periods.
| Item | Period 0 | Period 1 | Period 2 |
|---|---|---|---|
| Price ($) | |||
| 1 | 2.50 | 2.75 | 3.50 |
| 2 | 3.00 | 4.00 | 4.50 |
| 3 | 4.50 | 6.50 | 7.50 |
| 4 | 1 500.00 | 1 000.00 | 1 000.00 |
| 5 | 30.00 | 33.00 | 40.00 |
| Expenditure share | |||
| 1 | 0.4310 | 0.4532 | |
| 2 | 0.1293 | 0.1483 | |
| 3 | 0.0776 | 0.0696 | |
| 4 | 0.2586 | 0.2472 | |
| 5 | 0.1035 | 0.0817 | |
| Index numbers | |||
| Index methodology | |||
| Period 0 to 1 | 100.0 | 104.5 | |
| Period 1 to 2 | 100.0 | 117.0 | |
| Direct | 100.0 | 104.5 | 123.7 |
| Chain | 100.0 | 104.5 | 122.3 |
In this example, the Laspeyres Chain Index for period 2 is calculated as follows:
\(Index_{t=2} = (104.5/100) \times (117.0/100) \times 100 \\= 122.3.\)
The approach used in the Wage Price Index
4.19 In the discussion above it was shown how various price index formulae reflect different options as to the period in which quantities are determined.
4.20 The WPI utilises the Laspeyres index methodology since it is not practical to calculate current weights every period, as is required by other methods.
4.21 The weights for the WPI are updated regularly to reflect changes in the composition of jobs and indexes produced with the new weights are chain linked to those produced with the earlier weights.
4.22 This chapter has outlined the general price theory. The remainder of this Concepts, Sources and Methods publication is dedicated to showing how these concepts are practically applied to the WPI.
Chapter 5 - Coverage and classifications
Introduction
5.1 This chapter describes the target population for the WPI and defines the statistical units surveyed in the WPI.
Target population
5.2 The target population for the WPI is all employing organisations in Australia (private and public sectors) excluding:
- Enterprises primarily engaged in Agriculture, forestry or fishing
- Private households employing staff
- Foreign embassies, consulates, etc.
5.3 Enterprises primarily engaged in Agriculture, forestry and fishing activities are excluded because a very high proportion of agricultural enterprises have no employees. It would be disproportionately costly to survey a sufficient number of these enterprises to obtain a sample of jobs that is large enough to adequately represent this industry. In addition, the highly seasonal nature of activities in this industry would make it difficult to track jobs over time.
5.4 Private households employing staff and foreign embassies, consulates, etc. cannot be included because they are out of scope of the ABS Business Register from which the WPI sample of businesses is selected.
Scope
5.5 A change to WPI coverage in the December quarter 2009 resulted in businesses with 5 or less employees (referred to as micro-businesses) being excluded from the collection. An internal ABS review determined that the size and frequency of pay changes in micro-businesses were similar to businesses with five employees or more. Effectively, micro-businesses could be excluded from the survey without adversely affecting measures of price change. These businesses are still considered within scope of the target population and continue to be represented in WPI outputs via their inclusion in the expenditure weights.
Treatment of businesses as statistical units
Statistical units
5.6 The ABS uses an economic statistics units model based on the ABS Business Register to describe the characteristics of businesses, and the structural relationships between related businesses. The units model is also used to break groups of related businesses into relatively homogeneous components that can provide data to the ABS.
5.7 The units model allocates businesses to one of two sub-populations. The vast majority of businesses are in what is called the Australian Tax Office (ATO) Maintained Population, while the remaining businesses are in the ABS Maintained Population. Together, these two sub-populations make up the ABS Business Register population.
ATO Maintained Population
5.8 Most businesses and organisations in Australia need to obtain an Australian Business Number (ABN), and are then included on the ATO’s Australian Business Register. Most of these businesses have simple structures and in such cases the unit registered for an ABN will satisfy ABS statistical requirements. For these businesses, the ABS has aligned its statistical units structure with the ABN unit. The businesses with simple structures constitute the 'ATO Maintained Population'.
ABS Maintained Population
5.9 For the population of businesses where the ABN unit is not suitable for ABS statistical requirements, the ABS maintains its own units structure through direct contact with each business. These businesses constitute the 'ABS Maintained Population'. This population consists typically of large, complex and diverse businesses. The statistical units model described below has been introduced to cover such businesses.
Enterprise Group
5.10 This is a unit covering all the operations in Australia of one or more legal entities under common ownership and/or control. It covers all the operations in Australia of legal entities which are related in terms of the current Corporations Law (as amended by the Corporations Legislation Amendment Act 1991), including legal entities such as companies, trusts, and partnerships. Majority ownership is not required for control to be exercised.
Enterprise
5.11 The enterprise is an institutional unit comprising (i) a single legal entity or business entity, or (ii) more than one legal entity or business entity within the same Enterprise Group and in the same institutional sub-sector (i.e. they are all classified to a single Standard Economic Sector Classification of Australia sub-sector). For more details refer to Standard Economic Sector Classifications of Australia (SESCA), 2008 (cat. no. 1218.0).
Type of Activity Unit (TAU)
5.12 The TAU comprises one or more business entities, sub-entities or branches of a business entity within an Enterprise Group that can report production and employment data for similar economic activities. When a minimum set of data items are available, a TAU is created which covers all the operations within an industry sub-division and the TAU is classified to the relevant sub-division of the ANZSIC industry classification (see Australian and New Zealand Standard Industrial Classification (ANZSIC), 2006 (cat. no. 1292.0)). Where a business cannot supply adequate data for each industry, a TAU is formed which contains activity in more than one industry sub-division.
5.13 For more information on the economic statistics units model, refer to Information Paper: Improvements in ABS Economic Statistics [Arising from the New Tax System], 2002 (cat. no. 1372.0).
5.14 For units from the ATO Maintained Population, the statistical unit is the ABN unit. For units from the ABS Maintained Population, the statistical unit is the ABN unit/TAU in each state of operation. Where organisations are unable to provide data at the TAU/state level, special reporting units are created to collect information from the level within the organisation structure at which data are available. These special reporting units comprise either an aggregation of TAU/state units into larger units or a disaggregation into smaller units. In cases where a TAU/state unit is disaggregated into numerous similar small units, a sub-sample of these units is selected in order to reduce the reporting load on the providers.
Job coverage
5.15 When a statistical unit (as defined by the TAU/State model) is selected in the survey, it is required to provide a selection of jobs. A job is defined in paragraph 19.29 of the System of National Accounts [see Australian National Accounts: Concepts, Sources and Methods, Edition 1 2012 (cat. no. 5216.0)] as a work agreement (either written or verbal) between an employer and an employee. A distinction is made between an employee and job as an individual can have multiple sources of income and therefore the number of jobs in an economy can exceed the number of persons employed. As will be seen in Chapter 9, the distinction is particularly important for the WPI, as employees can move between jobs and can vary in the labour service they would provide. The WPI avoids such fluctuations by following the same jobs (rather than employees) over time.
5.16 All jobs in the target population of employers are in scope of the WPI, except the following:
- Australian permanent defence force jobs
- Non-salaried directors
- Proprietors/partners of unincorporated businesses
- Persons paid by commission only
- Working proprietors/owner managers of Pty Ltd companies
- Employees on workers’ compensation who are not paid through the payroll
- ‘Non-maintainable’ jobs (i.e. jobs that are expected to be occupied for less than six months of a year)
- Jobs for which wages and salaries are not determined by the Australian labour market (e.g. most employees of Community Development Employment Programs, or jobs where the remuneration is set in a foreign country).
5.17 As such, full-time, part-time, permanent, casual, managerial and non-managerial jobs are in scope of the WPI. Costs incurred by businesses for work undertaken by self-employed persons such as consultants and subcontractors are out of scope of the WPI, as they do not relate to employee jobs. Workers paid commission without a retainer are also excluded, as a large number of such workers operate in a similar fashion to self-employed persons.
Classifications
5.18 The WPI uses the Australian and New Zealand Standard Industrial Classification (ANZSIC), 2006 (cat. no. 1292.0) to classify the industry of organisations selected for the survey.
5.19 The broad institutional sector i.e. public and private sector breakdown for the WPI follows the Standard Economic Sector Classification of Australia (SESCA), 2008 (cat. no. 1218.0).
5.20 State and territories are classified by the Australian Statistical Geography Standard (ASGS) (cat. no. 1270.0.55.001).
Chapter 6 - Sampling
Introduction
6.1 This chapter describes the sampling methods and approach to updating the sample in the WPI.
Sampling methods
6.2 A two-stage sampling methodology is used to generate a sample of employee jobs for the WPI. The first stage selects a sample of businesses whilst in the second stage a sample of employee jobs are selected from within these businesses.
6.3 In the first stage of sampling, approximately 3,000 private and public sector businesses are selected from the ABS Business Register. These businesses are selected by stratifying the target population of businesses by state/territory, sector (private/public), industry division and business size and selecting a random sample from each strata. For a number of complex organisations further sampling is undertaken to simplify reporting arrangements.
6.4 In the second stage of sampling, businesses selected in the first stage are asked to select a sample of jobs from their payrolls using instructions provided by the ABS. The number of selections depends on the total number of jobs in the business, but is limited to a maximum of ten jobs per business. Approximately 18,000 jobs are selected.
6.5 The WPI uses probability sampling at both stages. Probability sampling means that each unit (i.e. business or job) has an equal chance of selection. Other price indexes produced by the ABS (including the Consumer Price Index and the Producer Price Index) are based on purposive samples which use selections based on knowledge or judgement of the index.
Sample refresh
6.6 For effective and efficient ongoing index construction, it is important that a high proportion of the initial sample of businesses is retained in subsequent quarters, and that the same jobs within those businesses stay in the sample where possible. However, to ensure its continued relevance, the survey sample is refreshed annually. This ensures that the sample remains representative of the Australian labour market. Refreshing the sample also allows the ABS to control the length of time that businesses are included in the sample. By controlling the length of time businesses are included in the survey the ABS can ensure that the reporting burden placed on businesses is kept to a minimum.
6.7 The sample selection methodology used to refresh the sample of businesses in the survey is referred to as the 'Rotating Panel Methodology'. In this methodology, the survey population is initially broken into five equal population panels. The sample is refreshed from within only one population panel for each annual update. All new businesses commencing operations during the course of a year are included in the next population panel to be refreshed, and therefore have a chance of being selected at the next annual update, ensuring the index reflects changes to the population of businesses.
6.8 Between each annual refresh of the business sample, a small number of jobs will be lost from the survey sample because of the closure of some businesses. In addition, some jobs in continuing businesses will be replaced in the sample because of restructuring and other job changes. These small sample losses do not affect the index as the jobs lost from the sample are represented by other similar jobs in the sample through adjustments to the sampling weights.
6.9 In addition to the closure of businesses, if a job ceases or changes dramatically, it will become impractical to follow the same job over time. When this occurs the provider is asked to select another job to take its place using instructions provided. This ensures that the number of selected jobs remains representative of the Australian labour market.
Calculation of sampling weights
6.10 Sampling weights are calculated for each contributing job. Jobs in the WPI are assigned sample weights according to the number of similar units they represent within a strata. The procedure for assigning a sample weight to a job takes place at the business and job level. Total sample weight is determined by multiplying business and job weights together; the role of sample weight in contributing to aggregate data is described in Chapter 10. The following paragraphs describe how job and business weights are calculated.
6.11 Business (or unit) level weights are calculated at the first stage of sampling. They represent the number of similar businesses a unit (business) represents in a particular strata. These weights are calculated annually and applied in the December quarter, by dividing the number of businesses in a particular strata on the survey frame by the number of businesses in that strata in the survey sample.
6.12 A second stage of sampling arises with the occasional sub sampling of reporting splits within businesses. These splits are created to ease the burden of reporting for providers. Weights for this stage of sampling will depend on the method of sampling used.
6.13 The third and final stage of sample weighting occurs at the job level. These weights are calculated by dividing the agreed number of jobs reported on by a particular unit by the total number of persons employed by that business. As such, job weights describe the number of jobs in a business represented by a particular job. Total employment figures are updated in the September quarter of each year, and job weights are updated based on this in the December quarter.
6.14 The first, second and third stage weights are multiplied together to produce a final sample weight. This sample weight indicates how many jobs a sampled job represents in the Australian economy.
Chapter 7 - Weights and their sources
Introduction
7.1 Weighting practices vary at different levels of the WPI. WPI expenditure weights are a measure of the relative importance of each elementary aggregate (EA), based on employers' expenditure on wages and salaries. Below the EA level, sample weights applied to each job on the WPI survey questionnaire indicate the number of jobs in the Australian labour market a particular sampled job represents. This chapter describes the procedures that are typically followed in updating the WPI expenditure weights. For more information on WPI sample weights refer to Chapter 6.
Expenditure weight theory and sources
7.2 The Laspeyres index methodology requires that prices in each period are compared to those in a given base period. To ensure the index remains relevant, expenditure weights need to be updated to reflect changes in expenditure patterns. This process is referred to as reweighting. Expenditure weights for the WPI are reweighted every two years following the release of data from the Survey of Employee Earnings and Hours (EEH). This update occurs in the December quarter.
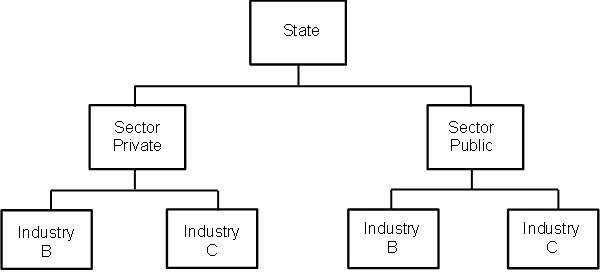
7.3 EEH is designed to provide detailed statistics on the composition and distribution of earnings and hours paid for by employers. Information is collected about the characteristics of employers, such as state/territory, industry and sector, and their employees. The WPI expenditure weights for each EA are derived using this information. EAs are the finest aggregations of jobs for which expenditure shares (referred to in the WPI as expenditure weights) are available. EAs represent groups of jobs within the same state/territory, sector and industry. Each selected job in the sample is assigned to a specific EA based on characteristics of the employing organisation (state/territory, sector and industry). The structure of the elementary aggregates used in the WPI is shown in Diagram 7.1 below.
7.1 Wage Price Index EA structure
7.4 The 2010 EEH has been used for the December quarter 2011 update. Appendix 1 shows the current distribution of employers' expenditure on wages and salaries.
7.5 When the expenditure weights are updated, it does not follow that the published index numbers will recommence at 100.0. Instead, the series based on the old expenditure weights and that based on the new weights are linked to form a continuous series via an arithmetic calculation, which is referred to as chaining (see Chapter 11). Following the introduction of the new weights, price movements (based on a comparison between the current and previous quarter prices) are applied to the expenditure weights to construct Value Aggregates (VAs). More detail on this process can be found in Chapter 10.
7.6 Ideally, the WPI expenditure weights should be as up to date as possible and be broadly representative of employers' expenditure pattern on wages and salaries that might be expected over the life of the index series. However, new estimates from EEH are not available each year so updated expenditure weights are calculated by revaluing the previous expenditure weights using current annual price movement data. In effect, this process maintains the quantities underlying the weights from the earlier period.
Chapter 8 - Price collection
Introduction
8.1 This chapter describes the data collection processes in use for the WPI.
Data collection processes
8.2 Information for the WPI is collected using quarterly mail-out, mail-back questionnaires.
8.3 When a business is first selected in the survey, detailed pricing specifications are collected for each of the randomly selected jobs. These specifications (job position number, title, tasks, grade, location, etc.) enable the same jobs to be identified in subsequent quarters. Employers providing data for the WPI have the option of reporting either the ordinary time hourly rate of pay or the annual salary for each selected job. Where an annual salary is reported, information about the usual or standard weekly hours for the job is used to convert it into an hourly rate of pay. Other information relating to the jobs is also collected including:
- details about pay changes during the reference quarter
- details about pay change mechanisms (e.g. Fair Work Australia or Modern award, collective agreement or salary review)
- details of overtime provisions
- details of any bonuses, commissions or incentive payments paid during the reference quarter
- any additional information about jobs that have unusual pay or working arrangements.
This additional information assists in understanding the nature of pay changes as they occur and to ensure that only pure price changes are reflected in the index.
8.4 When a job is paid by piece rates, i.e. paid a set amount per unit produced, an hourly rate is determined after consultation with the business contact about the rate per piece and the average number of pieces per hour. The average hourly rate is calculated when the job is first selected and it becomes part of the pricing specifications for the job and is priced from quarter to quarter. In subsequent quarters, any changes to the piece rate are collected, so that the percentage change is calculated and applied to the previous quarter's hourly rate.
8.5 The ABS takes a number of steps to ensure that data from the same jobs are collected each quarter, and that any changes in price for the job between quarters relate to pure price change. Where necessary, ABS survey staff contact businesses by telephone and seek clarification from the data provider on information supplied on the form. This contact with businesses enables survey staff to determine whether the change in price was due to factors other than market forces, such as a change in the pricing specification, changes in the characteristics of the job occupant, or a new occupant being in the job.
8.6 Sometimes it is not possible to collect data for all of the selected jobs. Some jobs may be temporarily vacant or the required information is simply not provided by the employer (although this is rare). There are a few options available to deal with temporarily missing observations. These include:
- repeating the previous period's price of the item
- imputing a movement for the item based on the price movement for all other items in the sample
- using the price movement from another price sample.
8.7 The procedure most commonly used in the WPI is to impute a movement for the missing job based on the price movements of the other jobs in the sample. The implicit assumption behind this procedure is that if it had been possible to collect the price of this job, its price would have changed in line with similar jobs. In most cases, this is a reasonable assumption and will provide an acceptable outcome for the index. However, this method is inappropriate when a job has no close substitutes. In these cases, a more appropriate method of imputation is to repeat the previous price.
8.8 Rigorous quality assurance processes are applied to the WPI data. These procedures are in place to ensure that the price change data supplied by businesses are accurate, and that the index numbers that are produced reflect changes in the real world. More detail on the types of price changes that are subject to these processes are provided in Chapter 9.
Transaction prices
8.9 A transaction price is the value placed on an item (agreed upon by seller and buyer) at the point of transaction. In the case of the WPI, transaction prices are the actual wage and salary payments made to the job occupants in the survey reference period rather than nominal or list rates (e.g. award or book rates) for the job concerned.
Chapter 9 - Quality change
Introduction
9.1 Price indexes aim to measure pure price change over time. For the WPI this is achieved by ensuring that identical jobs are priced from one period to the next. This is referred to as pricing to constant quality. This is difficult to do and in practice changes in the nature of jobs occur frequently as the characteristics of the job occupant change over time or the range of duties performed changes. These changes are considered to be quality changes. For price index purposes, it is necessary to remove any change in price attributable purely to the change in quality from the inflationary movement in the price. The following chapter describes the quality adjustments made within the WPI.
Ordinary time earnings
9.2 Ordinary time hourly rates of pay data are collected quarterly in the WPI. Ordinary time payments are collected for each sampled job and include the following:
- Award, agreed or over-award payments
- Casual loading
- Value of any salary sacrificed
- Retainers
- Piecework payments
- Higher duties allowances which relate to the selected jobs
- Fixed and regular taxable allowances
- Payment for leave taken during the pay period (e.g. sick leave, annual leave).
9.3 The following are specifically excluded from ordinary time payments:
- Shift allowances and shift penalty payments
- Reimbursements and non-taxable allowances
- Taxable allowances that are not fixed and regular (e.g. variable travel allowance)
- Leave loading
- Severance, termination and redundancy payments
- Employer contributions to superannuation funds
- Value of any payments in kind that cannot be salary sacrificed.
Price movements
9.4 Pure price movements are allowed to contribute to the ordinary time price. These movements will include: those due to inflation; cost of living; enterprise or agency agreements; award rises; minimum wage rises; individual contracts (both formal and informal); and salary reviews.
9.5 Elements that are excluded from changes in the ordinary time price are those that relate to changes in the quality or quantity of work performed. Quality changes within a job can occur in a number of ways including:
- changes in the level of performance of the occupant
- changes in the age, grade or level of qualification of the occupant
- changes in the duties required to perform the job.
A range of procedures have been developed to quality-adjust the data collected to ensure only pure price changes are reflected in the indexes.
9.6 Only those jobs that exist in both the current and the previous quarter (i.e. matched jobs) contribute to the index calculations. Jobs are matched by collecting detailed job specifications and ensuring job occupants do not deviate from these specifications over time. When an employee moves out of the sampled job, the WPI will continue to collect information about the job, rather than the employee.
9.7 Where a job has ceased and no other jobs with these specifications exist in the business, a new (or replacement) job is selected at random from the employer payroll. When initialising these new jobs, current and previous quarter base hourly rates are obtained to ensure a price change can be measured and the job contributes to the index in the quarter it is initialised.
Salary sacrifice
9.8 A feature of the labour market which is becoming more common is the use of salary sacrificing. Salary sacrifice arrangements are voluntary agreements in which the employee foregoes part of their salary or wages in return for benefits of a similar cost to the employer. The amount sacrificed can vary at the employee's discretion within guidelines set by the employer. The arrangement is generally intended to be cost-neutral to the employer and advantageous to the employee. Salary sacrifice arrangements can change and the cash component of the salary for a job may fluctuate between adjacent quarters even when there has been no change in the cost to the employer.
9.9 In deriving the price of ordinary time hourly rates both the cash and non-cash elements of flexible salary packages are included. The price movements in wage and salary rates would be distorted if just the cash component was included as the relationship between the cash and non-cash components can change based on an individual employee's circumstances.
Substitution effects
9.10 With the introduction of enterprise bargaining in Australia it has become common for benefits such as allowances, leave entitlements or fringe benefits to be traded off to obtain greater pay increases. These benefits are rolled into ordinary time or base pay. These trade-offs are generally price-neutral to the employer and therefore do not reflect changes in the price of the job in the labour market. Accordingly changes of this nature do not affect the ordinary time hourly rates of pay indexes. For example, an employee may choose to trade-off a non-cash component of their salary package (e.g. annual leave) for an increased cash component. In such a case, there would be no change recorded in the wage price index.
9.11 One exception to this is the shift of payments from overtime to ordinary time. The ordinary time rates of pay index shows the impact of these changes.
Performance related pay changes
9.12 Occasionally pay rate changes are partially the result of an individual's work performance, i.e. the pay change reflects more than pure price change in the labour market. For a small proportion of such jobs, it may not be possible to completely quantify the effect work performance has had on remuneration.
9.13 When the quality (i.e. performance related) and pure price components of the pay changes cannot be separately identified, the entire increase is allowed to contribute to the wage price indexes. It is expected that over time the job occupant will change, resulting in a subsequent fall in the price of the job due the lower quality (i.e. performance or experience) of the new employee. This decrease in the price of the job will also contribute to the index, counterbalancing the increase shown earlier, and in effect removing the performance component over time. While there may be some upward bias in the price rise during the tenure of a given employee, this treatment should minimise any bias in the long term. This treatment is considered preferable to the alternative of removing all pay movements where there is a quality component which would create a downward bias in the index.
9.14 Jobs where individual work performance is a factor in remuneration generally have unstructured or informal pay setting mechanisms i.e. an unregistered individual agreement. Remuneration is usually the result of negotiation between the employer and the employee with the level of pay generally being reviewed annually.
Overtime
9.15 Overtime is often worked irregularly and may be infrequent. Different hours of overtime will be worked in different jobs each week. Not all job occupants will be eligible to work overtime and not all occupants who are eligible will have been paid overtime in any particular period. For those who do, there is a broad range of scenarios and arrangements under which overtime might be paid. These arrangements are usually based on peaks and troughs in the operations of a business.
9.16 To overcome the problem of irregular or fluctuating overtime hours and to enable overtime to be priced to a constant quantity and quality, standard overtime hours for a job are defined as the number of overtime hours actually paid for in the reference week of the first quarter the job is included in the survey. Therefore not all jobs where the occupant is eligible for overtime will have overtime priced in the total hourly rates of pay indexes. This reflects the fact that overtime is not worked by all job occupants who are eligible to work overtime in a given week.
9.17 Overtime rates are updated annually in the December quarter to reflect the number of overtime hours worked and average penalty rate for this period. These changes are reflected in the index, where constant quantity and quality are maintained. This updating occurs to ensure the level of overtime used in the index is up to date.
Overtime price movements
9.18 The overtime rates are derived in the first quarter a job is included in the survey. Progressively the overtime rates are updated with changing overtime hours worked, changes in the eligibility of the occupant to work overtime and where there are changes to the actual overtime provisions, i.e. the overtime rates of pay for particular patterns of hours worked.
9.19 Apart from the changes identified above, the overtime hourly price would also change with a change in the ordinary time hourly price. This is because the overtime hourly price is based on the ordinary time hourly price.
9.20 Overtime rates or eligibility may change when pay is reviewed for a job, for example when new individual contracts or collective agreements are struck. In such cases, the overtime rates and the overtime weekly standard hours are updated at the time this occurs to reflect this change, which flows into the calculation of total hourly rates of pay.
9.21 When there are substitutions in remuneration between overtime and ordinary time payments, the ordinary time rates of pay index shows the impact of these changes.
Bonuses, commissions and incentive payments
9.22 Bonuses, commissions and incentive payments fluctuate from quarter to quarter, as they generally relate to the productivity of either the individual in the job or the organisation as a whole. Bonuses, commissions and incentive payments may be paid to employees in addition to regular wage or salary payments, and may be paid on a regular basis e.g. weekly, quarterly or annually, or on an ad hoc basis (e.g. staff suggestion bonuses). For ease of reference the term 'bonuses' encompasses bonuses, commissions and incentive payments.
9.23 Data on bonuses are collected on the following basis:
- where the bonuses are paid with a weekly, fortnightly, monthly, or quarterly frequency, the most recent payment to the employee is collected
- where the bonuses are paid biannually, annually or with other frequency, the full amount paid in the quarter is collected (i.e. the total paid since the previous quarter's survey reference date).
Such data enable an hourly rate for bonuses, commissions and incentive payments to be calculated.
9.24 Bonuses exclude the cost of retainers and piece work payments which are included in the calculation of the ordinary time hourly rate.
Price movements
9.25 The hourly price for bonuses is derived from the total of all bonus payments for all frequencies, without separating quality changes from pure price changes. Since no attempt is made to remove quality from the price of bonuses, the indexes which include bonuses are not pure price indexes.
Chapter 10 - Wage Price Index calculation in practice
Introduction
10.1 The WPI has been described as a basket of jobs to which employers pay wages and salaries each quarter. As wages and salaries change from one quarter to the next, so too will the total price of the basket.
10.2 The wage price indexes encompass cash payments to employees and include ordinary time earnings, overtime earnings, and bonus, commission and incentive payments, together with the value of any salary sacrificed.
10.3 Price indexes are compiled for the following four wage components:
- ordinary time hourly rates of pay excluding bonuses
- ordinary time hourly rates of pay including bonuses
- total hourly rates of pay excluding bonuses
- total hourly rates of pay including bonuses.
10.4 The wage price indexes can be thought of as being constructed in five major steps:
(i) collecting price data
(ii) deriving a final price for each of the four wage components for each job
(iii) calculating the weighted average prices for each elementary aggregate (EA)
(iv) calculating price relatives and using these to update value aggregates
(v) calculating index numbers.
10.5 Step (i) was outlined in Chapter 8. This chapter provides a description of the other four steps
Derivation of final prices
10.6 The process to derive a final price for each of the four wage components is outlined below. To help explain the process, consider an example job that is paid weekly and has the following attributes:
Ordinary time hourly rate of pay = $10
Weekly ordinary time standard hours = 38
Weekly overtime standard hours = 2
Ordinary time hourly rate of pay (OTHRP)
10.7 The price of ordinary time hourly rate of pay, excluding bonuses, for each job is simply the base hourly rate. This is referred to as OTHRP and using the example above is $10.
Ordinary time hourly rate of pay including bonuses (OTHRPIB)
10.8 The hourly bonus price is derived from bonus payment, the frequency of the bonus payment and standard ordinary time hours (unless the frequency of the bonus is the same as the wage and salary payments in which case ordinary time hours for the period are used). For bonuses paid less frequently than quarterly, e.g. annual bonuses, the hourly bonus price is carried forward to subsequent quarters until the next such payment is due.
10.9 Our example job is paid a weekly bonus of $152 and this is converted to a hourly bonus price of $4 since the job has weekly ordinary hours of 38.
10.10 To calculate a price inclusive of bonuses, the derived hourly bonus price is added to the ordinary time hourly rate of pay:
(10.1) OTHRPIB = OTHRP + B
where B is the hourly price of bonuses.
10.11 Substituting for our example job:
OTHRPIB = $10 + 4
= $14
Total hourly rate of pay (THRP)
10.12 The difference between the price for ordinary time hourly rate of pay and the price for total hourly rate of pay is overtime. The pattern of overtime can fluctuate, and this variation is controlled by holding overtime standard hours and the overtime provision constant. Calculation of an overtime provision factor is explained in the following paragraph.
10.13 In addition to deriving the standard overtime hours for the job, an overtime provision factor is derived from data collected in the first quarter. This factor is used to derive an average penalty rate for overtime hours worked and it represents the relationship between the hourly rates for overtime worked and ordinary time. For jobs where the occupant is not eligible to work overtime or where overtime is not being priced (i.e. overtime was not worked in the first quarter the job was included in the survey), the standard overtime hours and overtime provision factor are both set to zero. An example of the calculation used to derive the overtime provision factor is shown below:
1 hour @ $15 (time and a half) = $15
1 hour @ $20 (double time) = $20
Total overtime paid = $15 + $20 = $35
Total overtime hours = 1 + 1 = 2
Overtime hourly price = $35 / 2 = $17.50
Ordinary time hourly rate of pay = $10
Overtime provision factor = $17.50 / $10.00 = 1.75
10.14 The total hourly rate of pay is calculated by combining the overtime hourly rate with the ordinary time hourly rate. To do this, the standard weekly ordinary time and overtime hours are used to weight the wages and salary components.
(10.2) Ordinary time weight = StdHrs/(StdHrs + VStdHrs)
(10.3) Overtime weight = VStdHrs/(StdHrs + VStdHrs)
where:
StdHrs is the weekly standard ordinary time hours
VStdHrs is the weekly standard overtime hours.
10.15 Substituting for our example job at paragraph 10.13 which has a weekly overtime standard hours of 2:
Ordinary time weight = 38/(38 + 2) = 0.95
Overtime weight = 2/(38+2) = 0.05
10.16 The total hourly rate of pay excluding bonuses (THRP) is calculated as:
(10.4) THRP = (OTHRP x Ordinary time weight) + (Overtime x Overtime weight)
where:
Overtime is the overtime hourly price as described in paragraph 10.13 above.
10.17 Consider the example job at paragraph 10.13. Substituting into the equation for THRP:
THRP = ($10 x 0.95) + ($17.50 x 0.05) = $10.38
Total hourly rate of pay including bonuses (THRPIB)
10.18 The calculation for total hourly rate of pay including bonuses adds in the hourly bonus price to the equation as follows
(10.5) THRPIB = (OTHRPIB x Ordinary time weight) + (Overtime x Overtime weight)
10.19 Again using our example job at paragraph 10.13 we have
THRPIB = (($10 + $4) x 0.95) + ($17.50 x 0.05) = $14.18
10.20 To summarise using our example job, the final price for each of the four wage components are:
OTHRP = $10.00
OTHRPIB = OTHRP + B
= $14.00
THRP = (OTHRP x Ordinary time weight) + (Overtime x Overtime weight)
= $10.38
THRPIB = (OTHRPIB x Ordinary time weight) + (Overtime x Overtime weight)
=$14.18
Weighted average price
10.21 The price for a job is combined with the prices for other jobs to determine the price for each elementary aggregate (EA). EAs are the basic building block of the WPI (see paragraph 7.3). They represent a group of jobs with the same state, sector and industry characteristics. An EA price is calculated by taking a weighted average of prices for the jobs in the EA. These are referred to as the weighted average prices. The weights used take account of both the sampling weight (the population represented by the job) and weekly standard hours for each job. As each index is based on combinations of prices (i.e. ordinary time, overtime and bonus) and standard hours, the calculation of various weighted average prices differs for each index. The calculations used for each weighted average price are outlined below.
Calculation of Weighted Average Price for Ordinary Time Hourly Rate of Pay
10.22 An EA for ordinary time hourly rate of pay is calculated by taking a weighted average of prices for the jobs in the EA. It is calculated using the following method:
\((10.6) \space WtdAvP_a = \frac{\sum_\limits a(ORTHP_i\times StdHrs_i \times SampWt_i)}{\sum_\limits a(StdHrs_i \times SampWt_i)}\)
where:
WtdAvPₐ is the weighted average price for EA a
OTHRPᵢ is the ordinary time hourly rate of pay price for job i
StdHrsᵢ is the weekly standard ordinary time hours for job i
Sampwtᵢ is the sample weight for job i.
10.23 Consider an example EA, which is made up of the following jobs.
| OTHRP | StdHrs | Sampwt | |
|---|---|---|---|
| Job 1 | $18 | 40 | 200 |
| Job 2 | $15 | 20 | 300 |
| Job 3 | $25 | 38 | 150 |
10.24 Substituting the values into the above equation:
\(WtdAvP_a = \frac{($18\times40\times 200) + ($15 \times 20 \times 300) + ($25 \times 38 \times 150)}{(40 \times 200) + (20 \times 300) + (38 \times 150)}\)
=$19.11
Calculation of Weighted Average Price for Total Hourly Rates of Pay
10.25 The EA price is calculated by taking a weighted average of all the job prices in the EA. For total hourly rates of pay, the weight relating to standard hours includes both the ordinary time and overtime standard hours.
\((10.7) \space WtdAvP_a = \frac{\sum_\limits a \big[THRP_i \times (StdHrs_i + VStdHrs_i) \times SampWt_i \big]}{\sum_\limits a \big[(StdHrs_i + VStdHrs_i) \times SampWti\big]}\)
where:
WtdAvPₐ is the weighted average price for EA a
THRPᵢ is the total hourly rate of pay excluding bonuses price for job i.
Calculation of Weighted Average Price for Ordinary Time Hourly Rate of Pay Including Bonuses
10.26 The weighted average price for the index including bonuses is calculated using the same methodology as for the index without bonuses:
\((10.8) \space WtdAvP_a = \frac{\sum_\limits a (OTHPIB_i \times StdHrs_i \times Sampwt_i)}{\sum_\limits a (StdHrs_i\times Sampwt_i)}\)
where:
WtdAvPₐ is the weighted average price for EA a
OTHRIBᵢ is the ordinary time hourly rate of pay including bonuses for job i
StdHrsᵢ is the weekly standard ordinary time hours for job i
Sampwtᵢ is the sample weight for job i.
Calculation of Weighted Average Price for Total Hourly Rate of Pay Including Bonuses
10.27 Again the weighted average price for the index including bonuses is calculated using the same methodology as for the index without bonuses:
\((10.9) \space WtdAvP_a = \frac { \sum_\limits a \big [THRPIB_i \times (StdHrs_i + VStdHrs_i)\times SampWti\big]}{\sum_\limits a \big[(StdHrs_i + VStdHrs_i) \times SampWt_i\big]}\)
where:
WtdAVPₐ is the weighted average price for EA a
THRPIBᵢ is the total hourly rate of pay including bonuses for job i.
Calculation of price movements for elementary aggregates
10.28 When calculating the WPI, the Laspeyres methodology is applied. Specifically, prices are compared between the current period and the reference period. In practice, to ensure the most up to date sample (basket) of jobs is used in the calculation of the index the price movement is actually calculated between the current period and the previous period. A price relative (Pt / Pt-1) is calculated for each segment of the labour market (elementary aggregate) which compares the weighted average EA price in the current period with the weighted average EA price in the previous period. Specifically, the price relative (Pt / Pt-1) is equivalent to WtdAvPt / WtdAvPt-1 .
10.29 The estimates of price movements are used to revalue the value aggregates and to value current period prices by applying the period to period price movement to the previous periods value aggregate for each EA using the following formula:
\((10.10) \space VA_t = VA_{t-1} * (\frac {P_t}{P_{t-1}})\)
The updated value aggregate provides an estimate of the cost of acquiring the reference base quantity of the EA's jobs in the current period. Value aggregates are calculated at the EA level for each of the wage price indexes.
10.30 Table 10.2 below demonstrates the calculation of value aggregates for total hourly rates of pay for three elementary aggregates.
| Weighed Average Prices | Price Relatives | ||||||
|---|---|---|---|---|---|---|---|
| Elementary Aggregate | Expenditure Weight | P₀ | P₁ | P₂ | P₀/P₀ | P₁/P₀ | P₂/P₁ |
| 1 | 36 000 | 13.65 | 14.36 | 15.12 | 1.0000 | 1.0520 | 1.0529 |
| 2 | 25 000 | 12.89 | 15.54 | 15.63 | 1.0000 | 1.2056 | 1.0058 |
| 3 | 21 000 | 11.45 | 11.62 | 12.98 | 1.0000 | 1.0148 | 1.1170 |
| Value Aggregates | |||||||
| Elementary Aggregate | VA₀ | VA₁ | VA₂ | ||||
| 1 | 36 000 | 37 873 | 39 877 | ||||
| 2 | 25 000 | 30 140 | 30 314 | ||||
| 3 | 21 000 | 21 312 | 23 806 | ||||
Index construction
How the indexes are calculated
10.31 In the WPI, index numbers are created by comparing the current period value aggregate with the previous period value aggregate. Whilst different value aggregates are used as inputs for each of the four WPI indexes, the process is essentially the same. This is represented by the following formula:
\((10.11) \space I_t = I_{t-1} \times \frac{VA_t}{VA_{t-1}}\)
where the summation is across all EAs,
Iₜ is the index value for the current period
Iₜ₋₁is the index value for the base period
VAₜ is the value aggregate in the current period
VAₜ₋₁ is the value aggregate in the previous period.
10.32 Each index (Australia, states/territories, sector etc.) represents the amalgamation of a number of EA value aggregates. All of the various wage price indexes are calculated in this manner. Obviously, the combination of EAs and their value aggregates varies depending on the index being compiled.
10.33 The table below demonstrates the index calculation process. If we assume the NSW private sector is split into 3 EAs (1, 2 and 3), Table 10.3 outlines the calculation of the total hourly rates of pay index for the NSW private sector.
| Value Aggregates | Index | |||||
|---|---|---|---|---|---|---|
| Elementary Aggregate | VA₀ | VA₁ | VA₂ | I₀ | I₁ | I₂ |
| 1 | 36 000 | 37 873 | 39 877 | - | - | - |
| 2 | 25 000 | 30 140 | 30 314 | - | - | - |
| 3 | 21 000 | 21 312 | 23 806 | - | - | - |
| Index | 100.0 | 108.9 | 114.6 | |||
10.34 As noted above, indexes can be calculated for various combinations of state/territory, sector and industry. The specific outputs available are discussed further in Chapter 12.
Chapter 11 - Re-referencing and linking price indexes
Introduction
11.1 This chapter explains the reference periods used in the WPI and the chain linking process.
Reference periods
11.2 The following reference periods are discussed in this chapter:
- Price reference period is the period for which prices are used as denominators in the index calculation.
- Index reference period is the period for which the index is set to 100.0.
Re-referencing
11.3 The ABS changes the index reference period (a process known as re-referencing) of the WPI from time to time, but not frequently. This is because frequently changing the index reference period is inconvenient for users, and may result in the loss of some detailed historic data, especially for long series. When the WPI first commenced, the index reference period was the September quarter 1997 = 100.0. This was the first quarter for which data was available. Since the September quarter 2004, the Labour Price Index (as it was then known) used an index reference period of 2003–04 = 100.0. With the introduction of the 2006 edition of the Australian and New Zealand Standard Industrial Classification (ANZSIC), all indexes are now presented on an index reference period of 2008–09 = 100.0.
11.4 The conversion of an index series from one index reference period to another involves calculating a conversion factor using the ratio between the two series of index numbers. For example, for the total hourly rates of pay excluding bonuses index for Australia the conversion factor is calculated as follows:
The index number for 2008–09 (using an index reference period of 2003–04 = 100.0) is 121.755
The index number for 2008-09 (using an index reference period of 2008–09 = 100.0) is 100.0
Conversion factor = (100.0/121.755) = 0.8212
11.5 The conversion factors were applied to the "old" series to produce the "new" series. Table 11.1 shows the indexes on the old and new index reference periods.
| Index reference period(a) | ||
|---|---|---|
| Period | 2003–04=100.0 | 2008–09=100.0 |
| Mar qtr 2008 | 117.6 | 96.6 |
| Jun qtr 2008 | 118.7 | 97.5 |
| Sep qtr 2008 | 120.1 | 98.6 |
| Dec qtr 2008 | 121.5 | 99.8 |
| Mar qtr 2009 | 122.4 | 100.5 |
| Jun qtr 2009 | 123.1 | 101.1 |
| Financial year 2008–09 | 121.8 | 100.0 |
| Sep qtr 2009 | 124.2 | 102.0 |
| Dec qtr 2009 | 125.1 | 102.7 |
| Mar qtr 2010 | 126.2 | 103.6 |
| Jun qtr 2010 | 126.9 | 104.2 |
| Sep qtr 2010 | 128.7 | 105.7 |
| Dec qtr 2010 | 129.8 | 106.6 |
- Conversion factor: 2003–04 index reference period to 2008–09 index reference period = 100.0 / 121.775 = 0.8212.
11.6 Similar procedures are used to convert the 2008-09 index reference period back to a 2003–04 index reference period. For example, the December quarter 2010 index for the total hourly rates of pay excluding bonuses index for Australia was 106.6 which, when multiplied by the conversion factor of 1.2178 (121.775/100.0), gives an index number of 129.8 on the index reference period of 2003–04 = 100.0. It should be noted that a different conversion factor will apply for each index - that is, the factor for the total hourly rates of pay excluding bonuses index for WA will differ from the factor for the total hourly rates of pay excluding bonuses index for NSW.
11.7 Re-referencing should not be confused with re-weighting. Re-referencing does not change the relative movements between periods. However re-weighting involves introducing new weights and recalculating the aggregate index for each period which will affect the relative movements between periods.
Linking
11.8 The weights used to compile price indexes require regular updating to ensure the index remains representative. In the case of the WPI, weights need to be updated to reflect changes in the expenditure pattern of employers.
11.9 The WPI is a Laspeyres index. There are two options for updating weights. Option one, known as the the direct method, involves holding the weights constant over as long a period as seems reasonable, starting a new index each time the weights are changed. This means that a longer term series is not available. Option two is to update the weights more frequently and chain link the series together to form a long-term series. The latter is the method used for the WPI.
11.10 The difference between the two methods is explored in Table 11.2.
| Item | Period 0 | Period 1 | Period 2 | Period 3 | Period 4 |
|---|---|---|---|---|---|
| Price ($) | |||||
| Job 1 | 10 | 12 | 15 | 10 | 15 |
| Job 2 | 12 | 13 | 14 | 12 | 10 |
| Job 3 | 15 | 17 | 18 | 15 | 12 |
| Quantity | |||||
| Job 1 | 20 | 17 | 12 | 20 | 10 |
| Job 2 | 15 | 15 | 16 | 15 | 20 |
| Job 3 | 10 | 12 | 8 | 10 | 15 |
| Index Number | |||||
| Index Formula | |||||
| Laspeyres | |||||
| period 0 to 1 | 100.0 | 114.2 | |||
| period 1 to 2 | 100.0 | 112.9 | |||
| period 2 to 3 | 100.0 | 78.8 | |||
| period 3 to 4 | 100.0 | 107.5 | |||
| chain | 100.0 | 114.2 | 128.9 | 101.6 | 109.2 |
| direct | 100.0 | 114.2 | 130.2 | 100.0 | 107.5 |
11.11 In period 3, prices and quantities are returned to their index reference period values and in period 4 the index reference period prices and quantities are shuffled between items. The period 3 situation is sometimes described as time reversal and the period 4 situation as price bouncing.
11.12 The index number under direct estimation returns to 100.0 when prices and quantities of each item return to their index reference period levels; however, the chained index numbers do not.
11.13 This situation poses a quandary for prices statisticians when using a fixed weighted index. There are obvious attractions in frequent chaining; however, chaining in a fixed weighted index may lead to biased estimates. This can occur if there is seasonality or cycles in the price, and chaining coincides with the top or bottom of each cycle. For this reason it is generally accepted that indexes should not be chained at intervals less than annual.
Chapter 12 - Outputs and dissemination
Introduction
12.1 This chapter describes the WPI data published by the ABS. It also explains how to interpret index numbers, the differences between index points and percentage changes, and how to construct index series from the data. It concludes by discussing the reliability of the WPI outputs.
Published statistics
12.2 The WPI is compiled quarterly by the ABS. The survey reference date is the last pay period ending on or before the third Friday of the middle month of the March, June, September and December quarters each year. The data are typically released approximately seven weeks after the end of each quarter, in the publication Wage Price Index, Australia (cat. no. 6345.0).
12.3 The main mechanism for dissemination of ABS data is through the ABS website www.abs.gov.au. The website provides free of charge:
- the main findings from the statistical releases
- a version of the publication in PDF format which may be downloaded
- a range of time series spreadsheets containing all available indexes in Microsoft Excel format.
Output
12.4 Four sets of wage price indexes are released:
- ordinary time hourly rates of pay excluding bonuses
- ordinary time hourly rates of pay including bonuses
- total hourly rates of pay excluding bonuses
- total hourly rates of pay including bonuses.
12.5 The "headline measure" of the wage price index is the index for total hourly rates of pay excluding bonuses. Separate indexes are released for each of the above series for various combinations of state/territory, sector (private/public) and industry divisions. Estimates are published quarterly and more detailed data are available on request. Seasonally adjusted and trend data are produced for the index of total hourly rates of pay excluding bonuses for Australia, for the private and for the public sector.
Quarterly and annual data
12.6 The WPI is published on a quarterly and financial year basis. The index number for a financial year is the simple arithmetic average (mean) of the index numbers for the four quarters of that year. Index numbers for calendar years are not published by the ABS, but can be calculated as the simple arithmetic average of the quarterly index numbers for the year concerned.
Release of WPI data
12.7 It is standard ABS policy and practice to make all our statistical releases available on our website to users of our statistics, simultaneously from 11.30 am (Canberra time) on the day of their release. Prior to 11.30 am, all ABS statistics are treated as confidential and regarded as 'under embargo'.
12.8 However, given the relatively high level of interest in the WPI, it is important from a 'public good' perspective that key ministers are able to respond in an informed manner to requests from the media for early comment on the released statistics. For this purpose, a secure 'lockup' facility is provided to enable authorised government officials and ministerial staff time to analyse the released statistics and develop a briefing to be provided to relevant ministers after lifting of the embargo.
12.9 Authorised persons attending a lockup are required to remain in a secure room managed by ABS staff, and are prohibited from communicating any information from the statistical release to anyone outside the room, until the embargo is lifted. Attendees at the lockup are also required to sign security undertakings which include provision for prosecution under the Crimes Act 1914 for anyone who breaches the conditions for attending the lockup. A list of products approved for provision to authorised persons via ABS-hosted lockups is available on the ABS website on the 'Policy on Pre-Embargo Access to ABS Statistical Releases' in the 'About Us' section.
Seasonally adjusted indexes
12.10 The WPI produces an original, seasonally adjusted and trend series for the index of total hourly rates of pay excluding bonuses for Australia. Adjusted series are available for the All, Private and Public sectors.
12.11 Seasonally adjusted estimates are derived by estimating and removing systematic calendar related effects from the original series. In most economic data these calendar related effects are a combination of seasonal influences (e.g. the effect of the weather, social traditions or administrative practices) and other kinds of calendar related variation, such as the number of trading days, Easter or the proximity of significant days in the year (e.g. Christmas). In the seasonal adjustment process, both seasonal and other calendar related factors evolve over time to reflect changes in activity patterns.
12.12 The total hourly rates of pay excluding bonuses index is the only index of the WPI that is seasonally adjusted. Institutional effects largely drive the seasonality of this index. Important factors in determining this seasonality are the timing of effect of agreements, the length of these agreements, and the timing of the implementation of significant wage determinations that impact on rates of pay. A significant institutional change in wage setting arrangements can affect the relative level (or trend) and seasonality of the index.
12.13 The WPI uses a concurrent seasonal adjustment methodology to derive the adjustment factors. This method uses the original time series available at each reference period to estimate seasonal factors for the current and previous quarters. Concurrent seasonal adjustment is technically superior to the more traditional method of reanalysing seasonal patterns once each year because it uses all available data to fine tune the estimates of the seasonal component each quarter. With concurrent analysis, the seasonally adjusted series are subject to revision each quarter as the estimates of the seasonal factors are improved. In most instances, the only significant revisions will be to the combined adjustment factors for the previous quarter and for the same quarter in the preceding year as the reference quarter (i.e. if the latest quarter is Qt then the most significant revisions will be to Qt-1 and Qt-4). Seasonal patterns are also reanalysed annually to reflect known changes to regular events. This can lead to additional revisions.
ARIMA modelling
12.14 The ABS uses Auto-Regressive Integrated Moving Average (ARIMA) modelling techniques to produce seasonally adjusted estimates. ARIMA modelling is a technique that can be used to extend original estimates beyond the end of a time series. The extended values are temporary, intermediate values that are used internally to improve seasonal adjustment. They do not affect the original estimates and are discarded at the end of the seasonal adjustment process. The use of ARIMA modelling generally results in a reduction in revisions to the seasonally adjusted estimates when subsequent data becomes available. ARIMA modelling in the WPI was introduced in the June quarter 2008. For more information on the details of ARIMA modelling see the feature article 'Use of ARIMA modelling to reduce revisions' in the October 2004 issue of Australian Economic Indicators (cat. no. 1350.0).
Trend estimates
12.15 Trend is a measure of the underlying direction of a series. The ABS trend estimates for the WPI are derived by applying a 7-term Henderson-weighted moving average to all quarters of the respective seasonally adjusted indexes except the first three and last three quarters. Trend estimates are created for these quarters by applying surrogates of the 7-term Henderson weighted moving average to the seasonally adjusted indexes, tailored to each time series. In general, trend estimates give a better indication of underlying behaviour than the seasonally adjusted estimates. Please refer to the ABS information paper, A Guide to Interpreting Time Series - Monitoring Trends (cat. no. 1349.0).
Revisions
12.16 Original index numbers will be released as final figures at the time they are first published. Revisions will only occur in exceptional circumstances. Trend and seasonally adjusted indexes for some quarters will be updated as extra quarters are included in the series analysed for seasonal influences.
Interpreting index numbers
Index points and percentage changes
12.17 Movements in indexes from one period to any other period can be expressed either as changes in index points or as percentage changes. The following example illustrates the method of calculating changes in index points and percentage changes between any two periods.
Total hourly rates of pay excluding bonuses, All Sectors, Australia, Index numbers, original:
June quarter 2012 = 112.2
Less index number for June quarter 2011 = 108.2
Change in index points = 4.0
Percentage change = 4.0/108.2 x 100 = 3.7%
12.18 For most applications, movements in price indexes are best calculated and presented as percentage changes. Percentage change allows comparisons in movements that are independent of the level of the index. For example, a change of 2.0 index points when the index number is 120.0 is equivalent to a change of 1.7%. But if the index number were 80.0, a change of 2.0 index points would be equivalent to a change of 2.5%, a significantly different rate of price change. Only when evaluating change from the index reference period of the index will the points change be numerically identical to the percentage change.
12.19 The percentage change between any two periods must be calculated, as in the example above, by direct reference to the index numbers for the two periods. Adding the individual quarterly percentage changes will not result in the correct measure of longer term percentage change. That is, the percentage change between (say) the June quarter of one year and the June quarter of the following year will not necessarily equal the sum of the four quarterly percentage changes. The difference becomes more noticeable the longer the period covered, and the greater the rate of change in the index. This can readily be verified by starting with an index of 100.0 and increasing it by 10% (multiplying by 1.1) each period. After four periods, the index will equal 146.4 delivering an annual percentage change of 46.4%, not the 40.0% obtained by adding the four quarterly changes of 10.0%.
12.20 Although the WPI is compiled and published as a series of quarterly index numbers, its use is not restricted to the measurement of price change between quarters. A quarterly index number can be interpreted as representing the average price during the quarter (relative to the index reference base), and index numbers for periods spanning more than one quarter can be calculated as the simple (arithmetic) average of the quarterly indexes. For example, an index number for the calendar year 2011 is the arithmetic average of the index numbers for the March, June, September and December quarters of 2011.
Precision and rounding
12.21 The published index numbers have been rounded to one decimal place, and the percentage changes (also rounded to one decimal place) are calculated from the rounded index numbers. In some cases, this can result in the percentage change for the total level of a group of indexes being outside the range of the percentage changes for the component level indexes. Seasonally adjusted and trend quarterly estimates are calculated from unrounded original indexes. The percentage changes (rounded to one decimal place) are calculated from the rounded index numbers.
Reliability of the indexes
Sampling error
12.22 Since the index numbers of the WPI are based on information relating to a sample of employee jobs, they are subject to sampling error. That is, they may differ from figures that would have resulted had all relevant employee jobs in the labour market been included in the collection. While it is reasonably straightforward to calculate sampling errors for a level estimate such as the total number of employee jobs estimated via a sample survey, it is not so straightforward a process for the WPI which is a product of sampling and index methodologies. The ABS has not published any estimates of sampling error for the WPI.
Non-sampling error
12.23 Inaccuracies in the data may also occur because of imperfections in reporting by businesses or in processing by the ABS. Inaccuracies of this kind are referred to as non-sampling errors. Every effort has been made to reduce non-sampling error, for example:
- by careful design and testing of questionnaires and processing systems
- by providing instructions to businesses on how to select a sample of employee jobs
- by detailed checking of completed survey forms
- by instituting a range of procedures for ensuring that jobs are priced to constant quality.
Chapter 13 - The system of price statistics in the ABS
Introduction
13.1 The objective of this final chapter is to improve users' knowledge and understanding of the array of price statistics produced by the ABS, and to facilitate the selection of the most appropriate measures for particular applications, such as the analysis of inflation, indexation, and business contract adjustment.
13.2 The Wage Price Index (WPI) is part of a broader system of price statistics. There are a range of other price indexes that apply to different sectors of the economy. This chapter describes the other price measures produced by the ABS; both the direct measures of price change, and derived measures.
Principle price indexes
13.3 There are seven principle price indexes in the system of economic statistics.
(i) Wage Price Index
(ii) Consumer Price Index
(iii) Selected Living Cost Indexes
(iv) Producer Price Indexes
(v) Import Price Index
(vi) Export Price Index
(vii) House Price Index.
13.4 These are well known and closely watched indicators of macro-economic performance and the purchasing power of money. They are used as deflators in providing summary measures of the volume of goods and services produced and consumed. Consequently, these indexes are not only important tools in the design and conduct of the monetary and fiscal policy of the government, but also are of great utility in economic decisions throughout the private sector. These indexes provide an integrated and consistent view of price developments in production, consumption, and international transactions in goods and services.
Direct measures of price change
13.5 All the principle price indexes introduced above are direct measures of price change; that is, they are obtained through collecting and directly using price data. Each of the other ABS indexes is described in the following paragraphs.
Consumer Price Index (CPI)
13.6 The CPI measures quarterly changes in the price of a 'basket' of goods and services which account for a high proportion of expenditure by Australian metropolitan households.
13.7 The CPI is published quarterly in Consumer Price Index, Australia (cat. no. 6401.0).
13.8 Detailed information about the CPI can be found in Consumer Price Index: Concepts, Sources and Methods, 2011 (cat. no. 6461.0).
Selected Living Cost Indexes (SLCIs)
13.9 The ABS produces a set of quarterly living cost indexes to assess the effect of changes in prices on the out-of-pocket living expenses experienced by selected household types. The households are categorised according to their principal source of household income, which is derived from the latest Household Expenditure Survey (HES).
13.10 The household types in the scope of these indexes account for just over 90% of Australian households. The household types that have been identified as being appropriate for the construction of these indexes are:
- employee households - those households whose principal source of income is from wages and salaries;
- age pensioner households - those households whose principal source of income is the age pension or veterans affairs pension;
- other government transfer recipient households - those households whose principal source of income is a government pension or benefit other than the age pension or veterans affairs pension;
- self-funded retiree households - those households whose principal source of income is superannuation or property income and where the HES defined reference person is ‘retired’ (not in the labour force and over 55 years of age); and
- pensioner and beneficiary households - those households whose principal source of income is a government pension or benefit, the age pension or veterans affairs pension.
13.11 Results for these households are available in the publication Selected Living Cost Indexes, Australia (cat. no. 6467.0).
Producer Price Indexes (PPIs)
13.12 PPIs measure the changes in the prices of goods and services as they either leave the place of production or enter the production process. PPIs can be constructed as either an output measure or an input measure. Input PPIs measure the rate of change in the prices of goods and services purchased by the producer. Output PPIs measure the rate of change in the prices of goods and services as they leave the producer.
13.13 The PPIs are published quarterly in Producer Prices Indexes, Australia (cat. no. 6427.0).
13.14 Detailed information about the PPIs can be found in Producer and International Trade Price Indexes: Concepts, Sources and Methods, 2006 (cat. no. 6429.0) and Information Paper: Outcome of the Review of the Producer and International Trade Price Indexes, 2012 (cat. no. 6427.0.55.004).
Import Price Index (IPI)
13.15 The IPI measures the changes in the prices paid for imports of merchandise that are landed in Australia each quarter.
Export Price Index (EPI)
13.16 The EPI measures the changes in the prices received for exports of merchandise that are shipped from Australia each quarter.
13.17 The IPI and EPI are published quarterly in International Trade Price Indexes, Australia (cat. no. 6457.0).
House Price Index (HPI)
13.18 The HPI measures changes in house prices in each of the eight capital cities. The information is presented in the form of price indexes constructed separately for established houses and for project homes. The price index for established houses covers transactions in detached residential dwellings on their own block of land regardless of age. Project homes are dwellings available for construction on an existing block of land, therefore price changes relate only to the price of the dwelling.
13.19 The valuation basis of the HPI is purchasers' prices; that is, the price includes non-deductible taxes (for example GST in the case of project homes). The HPI is published quarterly in House Price Indexes, Eight Capital Cities (cat. no. 6416.0)
13.20 Detailed information about the HPI can be found in House Price Indexes: Concepts, Sources and Methods, Australia, 2009 (cat. no. 6464.0).
Derived measures of price change
National Accounts Price Indexes
13.21 The Australian System of National Accounts is a systematic framework of statistics providing a wide range of information about the economy and its components. Within the National Accounts framework are derived measures of price change, which include implicit price deflators (IPDs) and chain price indexes.
13.22 IPDs are obtained by dividing a current price value by the chain volume measure expressed in dollar terms. IPDs are derived measures (hence the term implicit) and are not normally the direct measures of price change by which current price estimates are converted to volume measures. They reflect both changes in the prices between the two periods and changes in the composition of the aggregate between those periods.
13.23 As the composition of an aggregate often changes from period to period, IPDs do not compare the price of a constant basket of goods and services between any two periods (except in comparing the index reference period with any other period). IPDs calculated from quarterly aggregates may be particularly affected by changes in the physical composition of those aggregates. As much of the quarter to quarter change in the physical composition is of a seasonal nature, IPDs derived from seasonally adjusted data are normally more reliable measures of price change than those calculated from unadjusted data. Even so, seasonally adjusting the series may not completely eliminate the effect of seasonal changes on the derived IPDs.
13.24 IPDs are available for gross domestic product; export of goods and services; imports of goods and services; and domestic final demand, and its four major components. They are published quarterly as part of Australian National Accounts; National Income, Expenditure and Product (cat. no. 5206.0), and Balance of Payments and International Investment Position, Australia (cat. no. 5302.0).
13.25 In contrast, the chain price indexes in the Australian National Accounts provide estimates of pure price changes. They are annually re-weighted, Laspeyres chain price indexes. These indexes encompass the whole of the economy.
13.26 An annually chained price index weights price changes together using the previous year's weights for each quarter of the current year. The chain price indexes are calculated from the deflators used to derive the volume estimates, weighted together in the same way and at the same level of detail as the chain volume estimates. In those cases where quantity revaluation is used to derive volume estimates, the implicit price deflator at a detailed level of disaggregation is used in constructing the chain price indexes to minimise the effect of any compositional change.
13.27 Detailed information about the Australia System of National Accounts can be found in Australian National Accounts: Concepts, Sources and Methods, Edition 1 2012 (cat. no. 5216.0).
Which price series should I use?
13.28 As described in this chapter, there are a wide range of price indexes produced by the ABS which are used for indexation, research and analysis. Although the ABS acknowledges that the various price indexes it publishes are used in indexation clauses and wage negotiation, it neither endorses nor discourages such use. The ABS has prepared information for users that sets out a range of issues that should be taken into account by parties considering an indexation clause in a contract using an ABS published price index. This paper, Use of Price Indexes in Contracts, is available on the ABS website.
13.29 The index or indexes selected will affect the price change recorded and should be chosen carefully to best represent the set of items. A description of what each price index measures is available on the ABS website which will assist in the decision of which index to use. For more information about what data is available, please contact the ABS National Information and Referral Service on 1300 135 070.
Appendix 1 - WPI weighting pattern (Appendix)
The expenditure weights for the WPI were updated in December quarter 2011. The distribution of expenditure by State and Industry is shown below. Updates take place every year in the December quarter. Weights are based on either the latest data from the biennial Survey of Employee Earnings and Hours (EEH) or, when this data is unavailable, are updated via the WPI price relatives. Refer to the latest copy of the Wage Price Index, Australia (cat. no. 6345.0) for the most up-to-date distribution.
| Private (%) | Public (%) | Total (%) | ||
|---|---|---|---|---|
| Australia by sector | ||||
| Australia | 75.6 | 24.4 | 100.0 | |
| Sector by State/Territory | ||||
| New South Wales | 33.6 | 28.9 | 32.5 | |
| Victoria | 25.3 | 20.4 | 24.1 | |
| Queensland | 18.7 | 19.5 | 18.9 | |
| South Australia | 6.3 | 7.8 | 6.7 | |
| Western Australia | 12.1 | 11.6 | 12.0 | |
| Tasmania | 1.5 | 2.8 | 1.8 | |
| Northern Territory | 1.0 | 1.9 | 1.2 | |
| Australian Capital Territory | 1.6 | 7.2 | 2.9 | |
| Australia | 100.0 | 100.0 | 100.0 | |
| Sector by broad industry division (b) | ||||
| Mining | 4.5 | (c) | 3.4 | |
| Manufacturing | 13.1 | (c) | 9.9 | |
| Electricity, gas, water and waste services | 0.8 | 4.4 | 1.7 | |
| Construction | 9.2 | (c) | 7.1 | |
| Wholesale trade | 6.7 | (c) | 5.1 | |
| Retail trade | 8.1 | (c) | 6.2 | |
| Accommodation and food services | 4.4 | (c) | 3.4 | |
| Transport, postal and warehousing | 5.0 | (c) | 5.3 | |
| Information media and telecommunications | 2.9 | (c) | 2.3 | |
| Financial and insurance services | 7.7 | (c) | 6.0 | |
| Rental, hiring and real estate services | 2.2 | (c) | 1.8 | |
| Professional, scientific and technical services | 11.1 | 2.1 | 8.9 | |
| Administrative and support services | 6.1 | (c) | 4.6 | |
| Public administration and safety | 0.9 | 33.6 | 8.9 | |
| Education and training | 3.7 | 28.6 | 9.8 | |
| Health care and social assistance | 8.4 | 21.6 | 11.6 | |
| Arts and recreation services | 1.2 | (c) | 1.2 | |
| Other services | 3.9 | (c) | 2.9 | |
| All industries | 100.0 | 100.0 | 100.0 | |
- Components may not sum to 100.0 due to rounding.
- Classified according to the Australian and New Zealand Standard Industrial Classification (ANZSIC), 2006 (cat. no. 1292.0).
- For the public sector, these industry divisions are combined and included in the 'All industries' total.
Glossary
ABS Business Register
The ABS maintained register of businesses and other organisations (government departments, non-profit organisations etc.) operating in Australia. This is used to determine the population for many ABS surveys.
Chaining
The process by which an index series based on one set of expenditure weights is 'linked' to another index series based on a different set of weights, in such a way the change in weights does not, in itself, alter the broader level of the index.
Consumer price index
A general indicator of the rate of change in prices paid by households for consumer goods and services.
Elementary aggregate
Groups of jobs with the same state/territory, sector (private/public) and industry characteristics.
Expenditure weights
A measure of the relative importance of each elementary aggregate, based on an employer's expenditure on wages and salaries. Also referred to as the expenditure share.
Index reference period
The period for which an index is given a value of 100.0.
Price index
A composite measure of the prices of a pre-defined set of items expressed relative to a defined base period.
Price movement
Changes in price levels between two or more periods. Movements can be expressed in money values, as price relatives or as percentage changes.
Price relative
A measure of price movements. The ratio of the price level in one period to the price level in another.
Pure price change
A price change unaffected by changes in the quantity and quality of the item being measured. In the case of the WPI, it is a change in price unaffected by changes in the quantity or quality of labour services.
Quality adjustment
The elimination of the effect that changes in the quality have on price in order to isolate the pure price change.
Rotating panel methodology
The sample selection methodology used to refresh the sample of businesses in the WPI survey.
Sample weight
The sample weight indicates the number of jobs in the Australian labour market a particular sampled job represents.
Wage price index
Measures changes in the price of wage expenditure. The four wage price indexes include: ordinary time hourly rates of pay excluding bonuses, ordinary time hourly rates of pay including bonuses, total hourly rates of pay excluding bonuses, and total hourly rates of pay including bonuses.
Abbreviations
| ABN | Australian Business Number |
| ABS | Australian Bureau of Statistics |
| ANZSIC | Australian and New Zealand Standard Industrial Classification |
| ARIMA | Auto-Regressive Integrated Moving Average |
| ARPI | Award Rates of Pay Indexes |
| ASGC | Australian Standard Geographical Classification |
| ASGS | Australian Statistical Geography Standard |
| ATO | Australian Tax Office |
| AWA | Australian Workplace Agreement |
| CPI | Consumer Price Index |
| EA | Elementary Aggregate |
| EEH | Survey of Employee Earnings and Hours |
| EPI | Export Price Index |
| GDP | Gross Domestic Product |
| HES | Household Expenditure Survey |
| HPI | House Price Index |
| IPD | Implicit Price Deflator |
| IPI | Import Price Index |
| ITEA | Individual Transitional Employment Agreement |
| ITPI | International Trade Price Indexes |
| SLCI | Selected Living Cost Indexes |
| LPI | Labour Price Index |
| PBLCI | Pensioner and Beneficiary Living Cost Index |
| PPI | Producer Price Index |
| SESCA | Standard Economic Sector Classification of Australia |
| SISCA | Standard Institutional Sector Classification of Australia |
| SNA08 | System of National Accounts 2008 |
| TAU | Type of Activity Unit |
| WCI | Wage Cost Index |
| WPI | Wage Price Index |