Has worker compensation reflected labour productivity growth?

This paper compares the growth in labour productivity and the growth in real hourly compensation from the period 1994-95 to 2021-22.

Released
13/12/2022

Introduction

Labour productivity measures the amount of output per hour worked. In the Australian economy over the past four decades, growth in labour productivity has been the predominant determinant of growth in real income per capita, a widely used measure of living standards¹. However, since 2012, growth in real compensation of employees has lagged behind labour productivity growth in the market sector².

This article compares the growth in labour productivity and real hourly compensation for the market sector and selected industries since 1994-95. The article uses a decomposition framework to provide insights into the factors driving the difference between growth in labour productivity and worker compensation³.

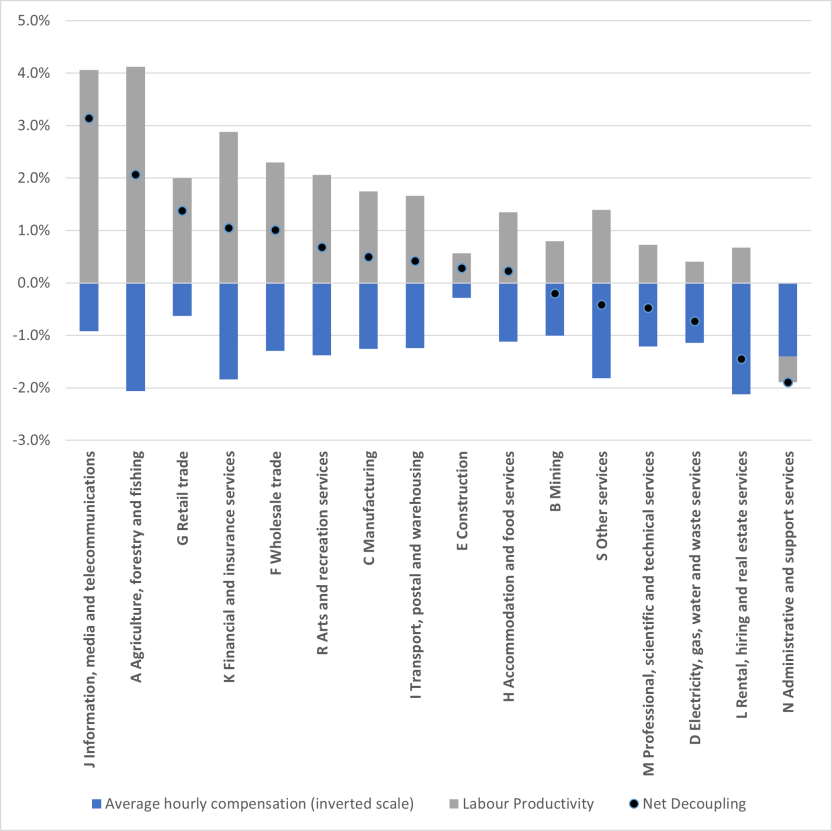
On average, between 1994-95 and 2021-22, a 1.0 percentage point increase in labour productivity has resulted in around a 0.8 percentage point rise in real worker compensation for the market sector. In addition, industries with stronger productivity growth tended to have a greater disparity between growth in labour productivity and in real compensation.

Footnotes

1. Treasury (2021)

2. The market sector comprises sixteen industries under the Australian and New Zealand Standard Industrial Classification, 2006 (ANZSIC06); that is, from ANZSIC06 Divisions A to N, plus Divisions R and S.

3. Sharpe, Arsenault and Harrison (2008)

Measures of worker compensation

Worker compensation can be measured by wage and salary payments to employees (wages) or compensation of employees. The latter is a broader measure of compensation which includes superannuation and workers compensation payments⁴. Figure 1 shows that growth in these two measures of worker compensation is very similar for the covered period. Analysis in this article uses the broader measure of compensation of employees.

Footnotes

4. Australian Bureau of Statistics (2020-21), Compensation of employees, ABS Website, accessed 1 December 2022.

Empirical Results - Market sector

Market sector – Labour productivity and compensation

Figure 2 shows the relationship between labour productivity and real hourly compensation. Hourly compensation is deflated by the Consumer Price Index (CPI) to obtain a measure of real purchasing power. The two series track each other relatively closely from 1994-95 to 2011-12. Since 2011-12, however, there has been a growing gap between the two series as real hourly compensation grew at a slower pace than labour productivity. The difference between labour productivity growth and real compensation will be referred to as “Net decoupling”.

Table 1: Growth in labour productivity & real hourly compensation (%), Market sector - by growth cycles⁵
Growth Cycle period1994-95 - 1997-981997-98 - 2003-042003-04 - 2009-102009-10 - 2017-182017-18 - 2021-22*1994-95 - 2021-22
Labour Productivity (1)  3.4  2.5  1.2  1.7  1.0  1.9
Real hourly compensation (2)  4.0  1.3  1.6  1.1  0.1  1.4
Net Decoupling (1 - 2)  -0.6  1.2  -0.4  0.6  0.9  0.5

 *The 2017-18 to 2021-22 cycle may now be complete, although another year of data is required for confirmation

Footnotes

5. See Estimates of Industry MFP - Frequently asked questions for detailed use of productivity growth cycles.

Table 1 presents growth rates in labour productivity, real compensation and net decoupling over the market sector’s productivity growth cycles. The market sector experienced high labour productivity growth during the late 1990’s and early 2000’s. Microeconomic reforms beginning in the 1980’s led to innovation across many market sector industries. Real compensation outpaced labour productivity for the 1994-95 to 1997-98 growth cycle. However, in the subsequent growth cycle (1997-98 to 2003-04) real compensation lagged labour productivity growth.

Real compensation grew faster than productivity during the 2003-04 to 2009-10 growth cycle. This period was characterised by high mining commodity prices, which had an adverse impact on aggregate labour productivity, while contributing positively to worker compensation⁶.

Between 2017-18 and 2021-22, real compensation declined in half of the market sector industries. The Construction, Retail trade, Accommodation and food services, and Arts and recreation industries all recorded falls in real compensation, largely driven by COVID-19 induced restrictions. At the same time, these industries experienced growth in labour productivity. As a result, decoupling of 0.9% was observed for the period.

Footnotes

6.  Topp et al (2008)

Contributors to growth in real worker compensation

An analytical framework following Sharpe, Arsenault and Harrison (2008) has been used to quantify factors contributing to real hourly compensation. Several factors can contribute to growth in real compensation including changes in labour’s terms of trade, labour productivity and labour income share (see Appendix for detailed description).

 *The 2017-18 to 2021-22 cycle may now be complete, although another year of data is required for confirmation

Figure 3 shows that labour productivity was the largest contributor to growth in real worker compensation across growth cycles. On an annual basis, a one percentage point (ppt) increase in labour productivity translates to around a 0.8 ppt rise real compensation over the time series.

The labour income share contributed 0.6 ppts towards the 4.0 ppts growth in real compensation, between 1994-95 to 1997-98. During this period, twelve of the sixteen market sector industries experienced an increase in labour income share. Expanding services and recreation activity, particularly within the Retail trade and Accommodation and food services industries drove the increase in labour income share. However, the labour income share remained flat or declined in subsequent periods, contributing negatively to real compensation growth. 

Labour’s terms of trade measures the difference in changes in the output deflator and a consumer price deflator (i.e., the CPI). If the prices of outputs produced by workers rise faster than the prices of goods and services consumed, workers compensation is expected to grow faster than the consumer prices. This results in an improvement in labour’s terms of trade. Figure 3 shows that labour’s terms of trade improved for the periods of 2003-04 to 2009-10 and 2017-18 to 2021-22, supported by favourable output prices for the mining industry. As a result, changes in labour’s terms of trade contributed positively to growth in real compensation for these periods.

Empirical Results - Industries

Selected industries – labour productivity and compensation

Between 1994-95 and 2021-22, ten of the sixteen market sector industries experienced net decoupling. Decoupling across the industries averaged 0.4% per annum, with Information, media and telecommunications experiencing the largest average annual decoupling of 3.1%. Conversely, Administrative and support services saw real compensation outpacing labour productivity by 1.9% per year.

Figure 4: Average Annual Net Decoupling – Market Sector Industries

Industry Net Decoupling (Largest to smallest)

Information, Media, and Telecommunications

Footnotes

7. Productivity growth cycles for individual industries may not coincide with market sector growth cycles. For simplicity and to compare with the market sector, market sector growth cycle periods have been applied to industries.

Labour productivity is the largest contributor to growth in real compensation for Information, media and telecommunications. Growth in labour productivity exceeded the growth in real compensation in every growth cycle, driving the strong decoupling within the industry. This was evident particularly between 1997-98 to 2003-04 as annual labour productivity growth surged 7.2%, while real compensation grew just 2.0%.

Changes in labour’s terms of trade have been a consistent detractor from real compensation over the period, detracting 3.1 percentage points on an annual basis. This can be attributed to strong innovation driving falling industry output prices. Through the time series, the CPI consistently outpaced growth in the prices of goods and services produced by the industry, indicating falling labour’s terms of trade.

The labour income share has declined or remained flat through most of the time series. However, between 2009-10 and 2017-18, the industry experienced expansion through growth in online platforms and increased contractual work. This contributed to the rise in labour income share, which contributed 3.1 percentage points towards the growth in hourly compensation.

Mining

Footnotes

7. Productivity growth cycles for individual industries may not coincide with market sector growth cycles. For simplicity and to compare with the market sector, market sector growth cycle periods have been applied to industries.

Labour’s terms of trade has been the largest contributor to real compensation in Mining. The role of labour’s terms of trade was most evident for the growth cycle, 2003-04 to 2009-10, and between 2017-18 and 2021-22. The strength in this component was supported by high global prices for Mining outputs. The favourable prices enabled real worker compensation to grow despite declines in labour productivity over the cycles.

Despite strong contributions from the terms of trade, growth in real compensation over the whole period remained relatively subdued. This is because positive contributions from the labour’s terms of trade were partly offset by large falls in Mining’s labour income share. As the industry was benefiting from high commodity prices, a higher proportion of the industry income was distributed to capital owners. The industry saw declines in labour income share throughout the entire time series, which were reflected in negative contributions of this component to real worker compensation.

Conclusion

In summary, over recent years, there has been some decoupling between labour productivity and real hourly compensation in the market sector in Australia. On average, between 1994-95 and 2021-22, a 1.0 ppt increase in labour productivity resulted in roughly a 0.8 ppt rise in real compensation provided to workers. Industry net decoupling tended to be inversely related to the industry’s labour’s terms of trade contribution to real compensation. Industries that experienced higher rates of decoupling were associated with falling output prices relative to CPI and also tended to have stronger labour productivity growth.

Appendix – Concepts and definitions

Net decoupling: measures the difference between the growth in labour productivity and the growth in average compensation deflated using the Consumer Price Index (CPI).

Labour productivity: is defined as a ratio of output to labour input, that is, the amount of output produced for an hour of work.

Labour income share: refers to the share of income attributed to labour as a proportion in total income. When labour productivity increases, part of the productivity benefits goes to worker and part of them go to capital owners.  If a higher proportion of these gains are allocated to capital, the labour share in total income decreases. Consequently, workers obtain a smaller rise in compensation for their productivity improvements which generates a productivity-pay gap (Ashwell, 2021).

Labour’s terms of trade: measures the difference between the price changes for items workers consume relative to items which they produce (Sharpe, Arsenault and Harrison, 2008). This term is obtained by comparing the changes in an output deflator and a measure of consumer price deflator (i.e., the CPI). If the prices of goods and services which workers are producing are rising slower than those they are consuming, then compensation growth is expected to lag the cost of living, making these workers worse off.

References

Ashwell, J., 2021. A Strengthening Position at the Bargaining Table? Understanding the Productivity-Median Wage Gap in Canada, 1976-2019. CSLS Research Reports 2021-09, Centre for the Study of Living Standards.

Sharpe, A., Arsenault, J.-F., & Harrison, P. 2008. Why Have Real Wages Lagged Labour Productivity Growth in Canada? International Productivity Monitor, 17(Fall), 16-27

Topp, V., Soames, L., Parham, D. and Bloch, H. 2008, Productivity in the Mining Industry: Measurement and Interpretation, Productivity Commission Staff Working Paper, December.

Treasury, 2021. 2021 Intergenerational Report – Australia over the next 40 years. June 2021.

Estimates of Industry Multifactor Productivity, 2020-21 financial year | Australian Bureau of Statistics (abs.gov.au)

Back to top of the page