The Rise of Big Data and Integrated Data Assets
EY Conference ‘What not to ignore in ‘24.’
Dr David Gruen AO
Australian Statistician
Friday 23 February 2024
Introduction
Thank you Cherelle for the invitation to present at your conference today.
I have lived in Sydney for a couple of extended periods of my life and it is a beautiful part of the world. I take this opportunity to thank the Traditional Custodians of this land who have cared for it over millennia. I pay my respects to their Elders and acknowledge members of the Aboriginal and Torres Strait Islander community attending today.
For at least the past couple of decades, we have seen an explosion in the availability of data and in the range of data sources that can be analysed. This is largely because of the digital revolution – with almost all digital platforms generating a stream of data in their wake. Data professionals are increasingly accessing these data and using them to derive insights of value both privately and for public policy purposes.
The ABS is making more and more use of these data. Being able to access and use data for policy development and efficient service delivery has become a prominent part of the successful operation of the public service.
Today I will talk about two developments that are having a profound impact on the capacity of analysts to do sophisticated data analysis. These developments are the rise of big data and of integrated data assets. I will talk specifically about the ABS – not because we are the only ones involved in these developments but because I know them best.
Big Data
People have been talking in general terms about ‘big data’ for ages; today I want to give you some specific examples of the value of big data in providing impressively detailed information of relevance to public policy.
Let me begin with Single Touch Payroll (STP). The Australian Tax Office (ATO) receives payroll information from employers with STP-enabled payroll software each time the employer runs their payroll. The extensive coverage of the STP system means these data cover more than 10 million employees – not quite every employee in the country, but close!
The arrival of the COVID-19 pandemic in early 2020 made access to this rich vein of near real-time information an urgent priority. The ATO expedited access, and the ABS began receiving these data in early April 2020.
Regular access to this new source of labour market data led to a new regular statistical publication – Weekly Payroll Jobs and Wages in Australia.
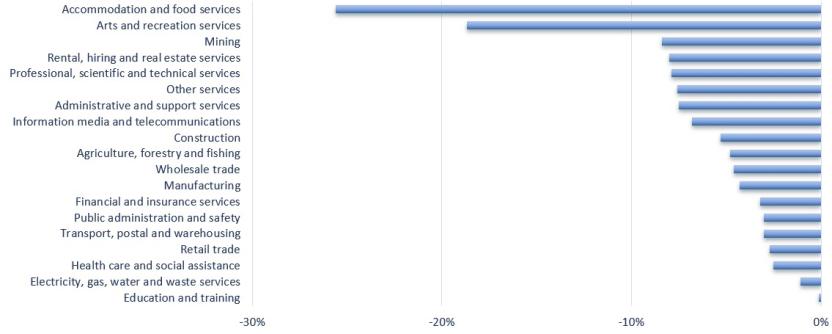
To give you a sense of the information that can be gleaned from this new data source, figure 1 below shows results from the first issue of this new publication, released on 21 April 2020. It shows the dramatic collapse in jobs across the Australian economy over the three weeks from mid-March 2020 – and the extent to which the collapse was concentrated in the Accommodation and food services and Arts and recreation services sectors.
Figure 1: Change in jobs between 14 March and 4 April 2020, by industry
Image

Description
This figure was from the first issue of the Weekly Payroll Jobs and Wages in Australia publication which was released on 21 April 2020, and highlights the change in jobs between 14 March and 4 April 2020 by industry.
The huge quantity of data available from STP enables insights to be derived across a range of dimensions that could not be derived from a sample. Often the difference in scale between ‘big data’ and a survey sample is striking. In this case, more than 10 million employees are covered by STP data while the ABS monthly labour force survey covers roughly 50,000 people. [1]
In many ways, access to STP data taught the ABS new ways of doing things. Given the scale and complexity of the STP data, it made sense to ingest and analyse them using cloud computing services rather than our existing computer systems. And that is the new model for accessing public and private sector big data assets.
The pandemic increased policymakers’ appetite for insights into the economy that were available in close to real time. With household consumption making up about 50% of GDP, improving the timeliness and coverage of indicators of household consumption was well worth doing.
In February 2022, the ABS released the first monthly household spending indicator using aggregated, de-identified credit and debit card transactions data from Australia’s major banks. The indicator provides more than twice the coverage (68 per cent) of the components of household consumption than the monthly Retail Trade survey (30 per cent). [2]
Additionally, the ABS began publication of a monthly CPI indicator series in October 2022 to complement the quarterly CPI. Until recently, producing an Australian monthly CPI would have been prohibitively expensive. Enhancements to the quarterly CPI, using new data sources, have reduced data collection costs and made it possible to produce a more frequent measure of household inflation. In particular, the use of scanner data and web-scraping (automated) data collection techniques provide high frequency data at a lower cost.
On the rise of big data, I’ll give one further example to illustrate what is now possible. This example is based on a joint ABS-RBA study on rents.
The study used a new dataset which provided rent data for about 600,000 rental properties across both regional and capital cities in Australia. Rent data on these 600,000 properties is updated monthly. With that much data, it is possible to provide extremely detailed information on developments in the rental market.
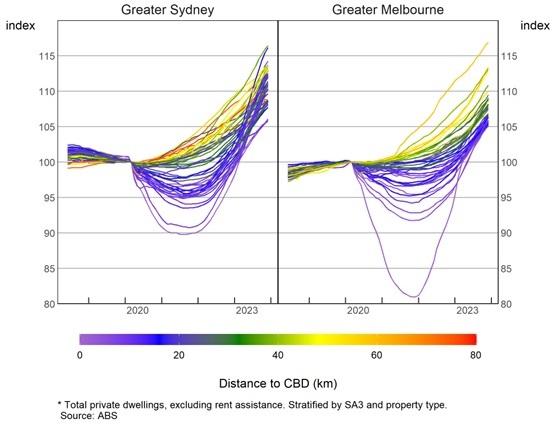
Figure 2 below (updated from the published study) shows rental prices over the past six years by distance from the CBD in Sydney and Melbourne. There is a lot of information on that slide; it is worth spending some time understanding it.
Figure 2: Rent Price Indices* by capital city SA3; March 2020=100
Image

Description
This figure was updated from the published joint ABS-RBA study on rents and highlights the rental prices over the past six years by distance from the CBD in Sydney and Melbourne.
The broad outlines of the price developments in Australia’s two largest cities are remarkably similar. With the arrival of COVID-19 in March 2020, there were big falls in market rents close to the CBD (lines in blue) but not further out in the suburbs (lines in yellow and red). The near-to-CBD rental price falls began to reverse in 2021 and have now more than fully unwound their earlier falls. The contrast with the outer suburbs is striking indeed.
Let me conclude this discussion with two caveats. Firstly, having access to big datasets does not automatically translate to more accurate insights. Big datasets can be unrepresentative of the relevant population and, in some celebrated cases, wildly inaccurate conclusions have been drawn from big datasets that were unrepresentative in some important respect. [3]
Secondly, notwithstanding the promise of big data and the benefits it can bring, surveys will continue to play an important role. Surveys have the benefit of being designed to be representative and seeking exactly the information that analysts require. These benefits will continue to be critical in many circumstances.
Integrated Data Assets
Let me turn now to integrated data assets. Here the Australian statistical landscape is changing rapidly. Investment in the safe and secure linkage of administrative data is becoming increasingly important to provide the evidence base for policy, community-level insights, and program evaluation.
Datasets are ‘integrated’ when they are linked together so that analysts can study several aspects of individuals’ (or individual businesses’) behaviour together. The ABS hosts two large integrated data assets – the Person-Level Integrated Data Asset (PLIDA) and the Business Longitudinal Analysis Data Environment (BLADE). Both assets have grown substantially over the past several years. The arrival of COVID-19 generated a series of urgent public policy questions that could be tackled only using these integrated data assets.
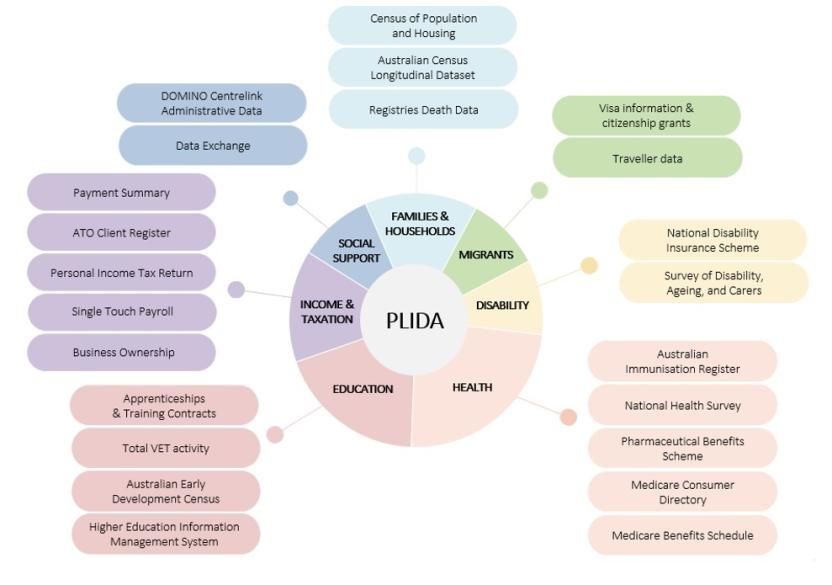
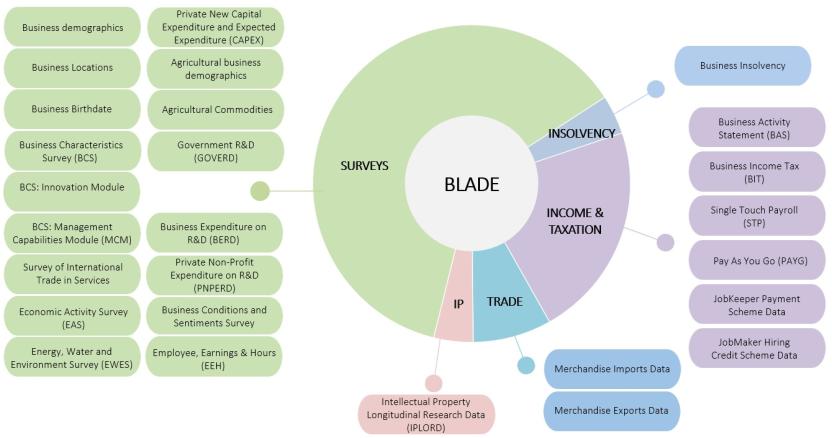
Figures 3 and 4 below show the datasets that are currently included in PLIDA and BLADE. As the slides make clear, these two integrated data assets now include an impressive number of datasets that provide information on many aspects of individuals’ and businesses’ lived experience.
Figure 3: Person-Level Integrated Data Asset (PLIDA) Datasets
Image

Description
This figure outlines the all the datasets included in the Person-Level Integrated Data Asset (PLIDA). PLIDA is a secure data asset combining information on health, education, government payments, income and taxation, employment, and population demographics (including the Census) over time. It provides whole-of-life insights about various population groups in Australia, such as the interactions between their characteristics, use of services like healthcare and education, and outcomes like improved health and employment.
Figure 4: Business Longitudinal Analysis Data Environment (BLADE) Datasets
Image

Description
This figure outlines all the datasets included in the Business Longitudinal Analysis Data Environment (BLADE). BLADE is an economic data tool combining tax, trade and intellectual property data with information from ABS surveys to provide a better understanding of the Australian economy and businesses performance over time.
These integrated datasets therefore provide the opportunity for analysts to tackle public policy problems across multiple dimensions. It is incumbent on the hosts of these data assets, in this case the ABS, to ensure they are hosted securely with well-developed protocols to ensure that individuals’ and businesses’ private information is protected and is not compromised.
There are currently about 500 active research projects on ABS integrated data assets. The 1,700 analysts working on these projects come from Commonwealth government departments and agencies, State government departments and agencies, universities, and thinktanks like the Grattan Institute and e61.
Finally, let me give an example of a study that uses integrated data to answer important public policy questions. This study uses a link between PLIDA and the Australian Immunisation Register – a dataset that contains details of all Australians vaccinated against COVID-19 and when they were vaccinated.
The study followed 3.8 million Australians aged 65 and over in 2022 to examine the relationship between mortality for this older age group and vaccination status.
The study provided insights about the impact of vaccine boosters on mortality rates. It demonstrated that in early 2022, a 65+ year old person having had three COVID-19 vaccinations – with the third dose administered within the previous three months – had a COVID-19 mortality that was reduced by 93 per cent relative to a comparable unvaccinated person. 93 per cent is an extremely large fall in mortality.
The study also demonstrated how vaccine effectiveness wanes over time. It showed that people who received their most recent booster within the previous three months had a much larger reduction in mortality (by around 20 percentage points) than people whose latest booster had been more than six months ago. It remained true that being vaccinated reduced mortality significantly relative to the unvaccinated but the level of protection was noticeably higher for those who had had a recent booster.
For our purposes here, the point I want to highlight, as with the earlier example with rents, is there are enormous benefits in being able to examine outcomes from such a large sample. A sample of 3.8 million does not include every 65+ year old Australian in 2022, but it is close. The benefit of working with an integrated data asset is that it enables more complex public policy questions to be answered than would be possible analysing a single dataset.
In particular, careful evaluations of public policy are often possible with big data and integrated data assets. There will always be a role for randomised control trials but a wide range of public policy interventions will be able to be evaluated using these new data assets.
Conclusion
In conclusion, I hope I have given you a sense of the progress being made in developing and accessing big data and integrated data assets.
Over time, these data assets should greatly expand the opportunity for analysts, both within government and beyond, to do high-quality empirical research and evaluations of programs and thereby to improve the information base on which future public policy is formulated.
Thank you.
Footnotes
[1] STP has now moved into a second phase of development. STP Phase 2 includes more detailed breakdowns of people’s earnings, differentiates between the different types of payments they receive, and provides more information on the nature of jobs (for example, whether they are full-time or part-time, or casual or non-casual jobs, etc). By the middle of next year, employers of most employees across Australia will report to the ATO via STP Phase 2. The ABS looks forward to accessing this information in the future.
[2] I am grateful to Australia’s major banks for their goodwill making these data available to the ABS. With further enhancements planned to the monthly household spending indicator, the ABS will cease publication of Retail Trade in August 2025.
[3] See, for example, Bradley, V.C., Kuriwaki, S., Isakov, M., Sejdinovic, D., Meng, Z.-L. and Flaxman, S. (2021), Unrepresentative big surveys significantly overestimated US vaccine uptake. Nature, 600 (7890), 695-700.