Visualising Data
Data Explorer user guide
The interface to the ABS data API is provided via Data Explorer. Data Explorer has been designed to allow users to rapidly locate and retrieve data.
Released
27/09/2021
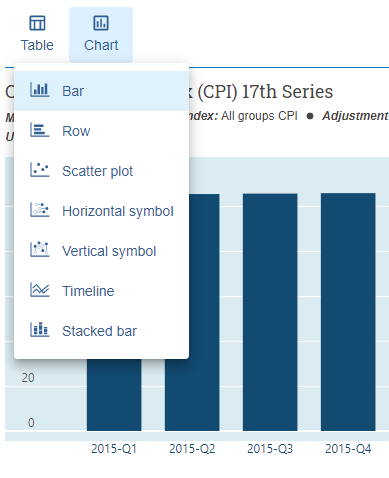
Other than the default Table view, you can visualise data in Data Explorer using the Chart function.
Click Chart above your table title and then select the chart you wish to view.
Use the filter menu to select the data you wish to visualise.
The Customise menu provides options to customise the look and functionality of your chart. This includes chart size, axis values and highlighting data.
You can download your chart as a picture using the Download button.
Click the "You did not get the expected chart?" link below your chart to get chart-specific help in Data Explorer.