Data Explorer user guide
User assistance for Data Explorer, a free online tool which allows you to search, explore and manipulate detailed ABS statistics
About the Beta
ABS Data Explorer is in Beta. Performance and availability may be impacted during periods of high use. The ABS monitors the service and will work to resolve any issues as soon as possible.
If you have feedback or questions, please contact the Data Explorer team.
Introduction
Data Explorer is an free online tool that presents data in a searchable, flexible and dynamic way. It is an interactive web browser interface where you can view, query and download data.
Data Explorer allows you to:
- Search and discover detailed ABS statistics
- Filter and customise data to your own requirements
- Generate custom tables and charts
- View valuable metadata alongside the data
- Export data in a range of formats such as Excel and CSV
- Bookmark and share your custom data tables
- Automatically generate Application Programming Interface (API) calls to pull data into your own system
Datasets are loaded as soon as possible after their 11:30am release on the ABS website.
However, data in Data Explorer may not necessarily be the most up to date. You are advised to check the ABS website (abs.gov.au) for the latest data.
Accessibility
Data Explorer includes support for assistive technology such as screen readers. The "enable/disable accessibility support" button activates this feature. The button is located in the top right of the screen and should be read first by screen readers.
About the data
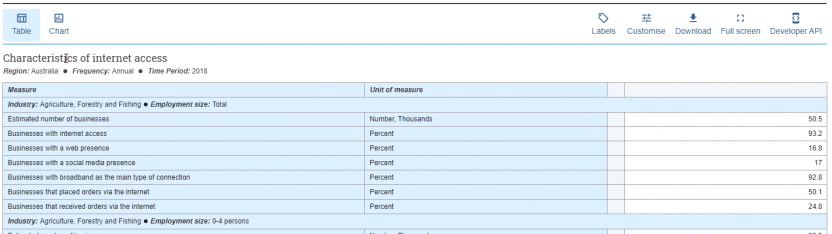
Data Explorer organises data in the form of dataflows. Each dataflow is a multi-dimensional dataset. Dimensions are axes on which the data is described. For example: time, frequency and region.
Every dimension contains a pre-defined list of items, called dimension members. In the Time dimension, for example, the dimension members are the different time periods.
Data Explorer also includes metadata to provide additional information about the data you are viewing. This includes the unit of measure (e.g. Australian dollars), unit multiplier (e.g. thousands) and cell-level annotations (e.g. revised or not available).
Finding data
User assistance for Data Explorer, a free online tool which allows you to search, explore and manipulate detailed ABS statistics.
There are two methods for finding data using Data Explorer:
- Search for data by entering keywords in the search field
- Browse for data by expanding a topic under the Browse by option
Searching for data
To search for data using a keyword:
- Enter a keyword in the search field
- Use the enter key or select the arrow in the search block
- All datasets containing that keyword will be displayed

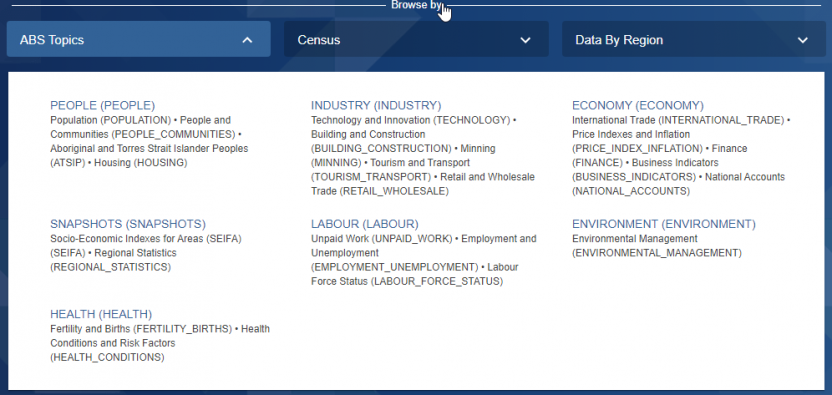
Browsing for data
To browse for data using the 'Browse by' section, select a topic dropdown:
- The topic will be expanded to show sub-topics
- Select a sub-topic
- All dataflows relating to that topic will be displayed
- Select a dataset from the result to open the selection
Filtering the results
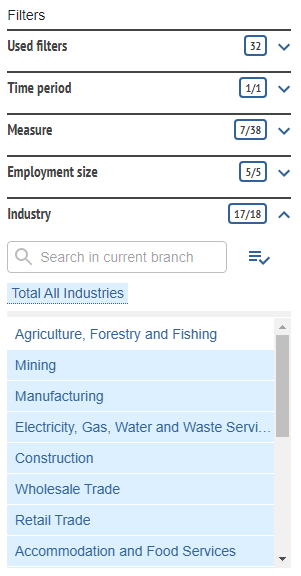
Once you have your browse or search results, you can more specifically locate what you want using filters on the left of the screen:
- Use the down arrows to expand and make a selection. For example, under Region, you could filter on a state to only view results that include data for that state
- You can search within each of these filters and apply as many filters as you want
- To remove a filter, expand 'Used filters' at the top of the menu and click to remove one or all filters
- Your results will be automatically updated when you add or remove filters
- To view data, simply click the dataflow title in search results
- Any additional filters you selected will be automatically applied when you view the data, for example, if you filtered on a state then only data for that state will be displayed

Please see Updates page in the API User Guide for more information on recently added data.
Exploring and downloading data
User assistance for Data Explorer, a free online tool which allows you to search, explore and manipulate detailed ABS statistics.
Filtering the data
When you open a dataflow it will display a default view of data, use the Filter menu on the left of the screen to allow you to change your data selection
Each section of the filter menu is a dimension in the dataflow. Each dimension has one or more dimension members.
Select or unselect dimension members to choose what data is included in your table.
- Use the down arrows to expand the display of available members for each dimension in the Filter menu
- Click a dimension member to add it to the filter list, click it again to remove it from the filter
- If no members are selected for a dimension then the filter will include all members by default
- You can search within a dimension to find specific dimension members, this is particularly useful for large dimensions
- Use bulk selection to select multiple items at once. You can select an entire level of the dimension hierarchy. You can also select all currently displayed dimension members, for example, all results from a search
- Your view of data will automatically update every time you change the filter
- Use the Time Period filter to choose what reference periods to include in your table
Used Filters, at the top of the Filter menu, shows all currently applied filters. You can quickly remove some or all filters for each dimension here.
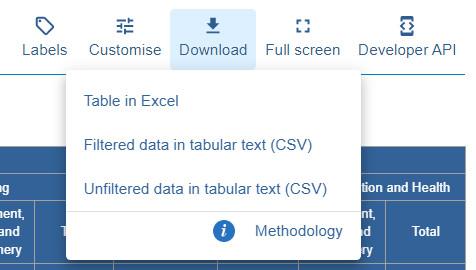
Downloading data
You have three options for downloading data from Data Explorer; Excel, filtered CSV and unfiltered CSV.
- Table in Excel - download an Excel XLSX file with the exact view of data from your Data Explorer table.
- Filtered data in tabular text (CSV) - download a comma separated variable (CSV) file with the data from your Data Explorer table
- Unfiltered data in tabular text (CSV) - download a comma separated variable (CSV) file with all data for the selected dataflow. Note, this may fail for some large datasets, see troubleshooting.
The Download menu also includes a Methodology link to view further information about the data such as how it was collected and processed.
Customising the data view
The interface to the ABS data API is provided via Data Explorer. Data Explorer has been designed to allow users to rapidly locate and retrieve data.
To customise your table layout, select the Customise button at the top of the table display. You can drag dimensions between Columns, Row sections and Rows. You can also choose to view Time Periods in ascending or descending order.
A preview of your table is displayed. Click Apply layout to update any customisation changes to your data table.
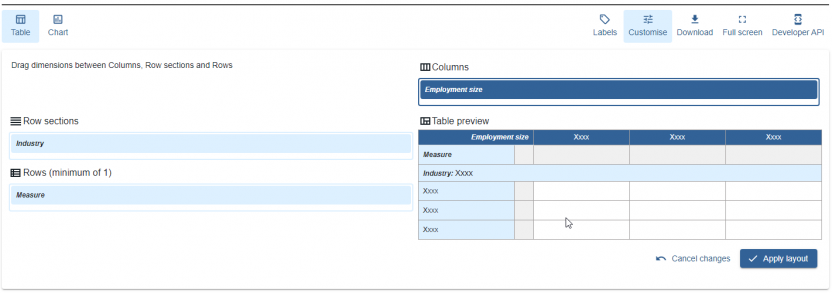
Change table layout
Move the column header to either a Row section or a Row.
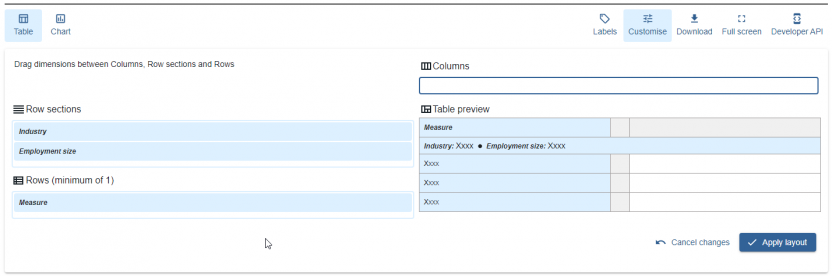
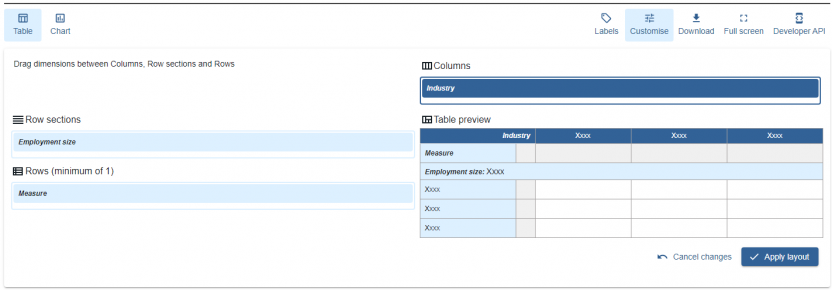
Move the Row section to the Columns. For example, in the image below we moved the Industry from the Row section to the Columns.
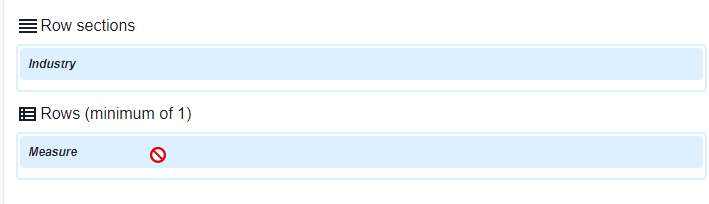
If a selection cannot be moved you will see the red warning symbol.
Apply your changes and return to the newly customised table.
Generating API Calls
The interface to the ABS data API is provided via Data Explorer. Data Explorer has been designed to allow users to rapidly locate and retrieve data.
All statistics in Data Explorer are also available via Application Programming Interface (API). The ABS Data API enables fast access to ABS statistics by using machine to machine 'API calls'. These calls return statistics in a machine friendly format so that you can integrate data into your own systems as they are released.
Data Explorer automatically generates an API call for the data selected in your table. Select Developer API to the top right of screen to view API calls for your selection. The Data query will return the exact data from your Data Explorer table. The Structure query will return structural metadata for the dataflow you are viewing.
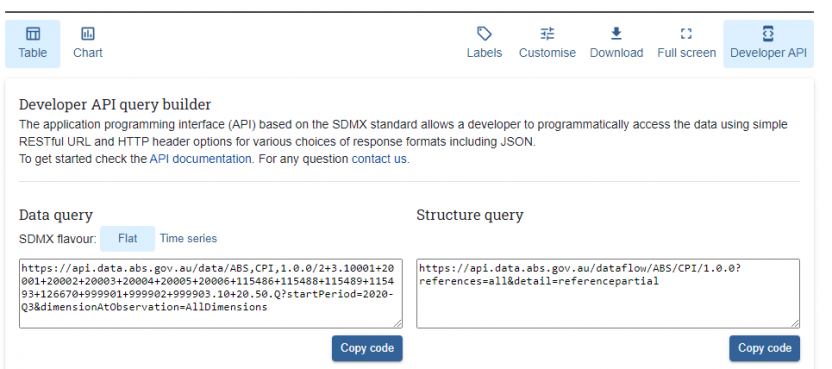
The ABS Data API can provide data in XML, JSON and CSV format.
Troubleshooting
The interface to the ABS data API is provided via Data Explorer. Data Explorer has been designed to allow users to rapidly locate and retrieve data.
Data Explorer is not supported in some older web browsers, such as Internet Explorer.
Functionality
Empty table cells or missing rows and columns
Data Explorer cannot display more than 8,000 data points in a table. If you exceed this limit, some cells in the table may appear empty, even though data is available. Or the table may not include all rows or columns. A warning symbol next to the title will inform you if you exceed the 8,000 data point limit.
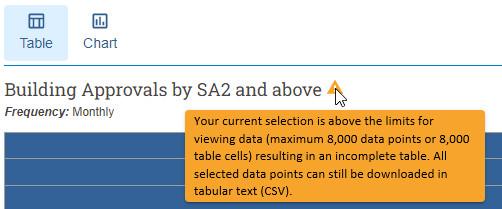
We recommend using filters to reduce your data selection to below 8,000 data points. Use the Filter menu on the left to select less data, for example, reduce the number of time periods or geographic regions selected. More information on Filtering the data section of this guide.
Alternatively, you can download all selected data points as a CSV file. Click Download, then “Filtered data in tabular text (CSV)”. You can also download the full dataset as a CSV by clicking “Unfiltered data in tabular text (CSV)”.
Download unfiltered CSV fails for very large datasets
Download unfiltered data in tabular text (CSV) does not work if the dataflow has a very large amount of data. This is a known system limitation we are working to resolve. For affected datasets, a link to "Download all data as CSV" is available under the Download button.
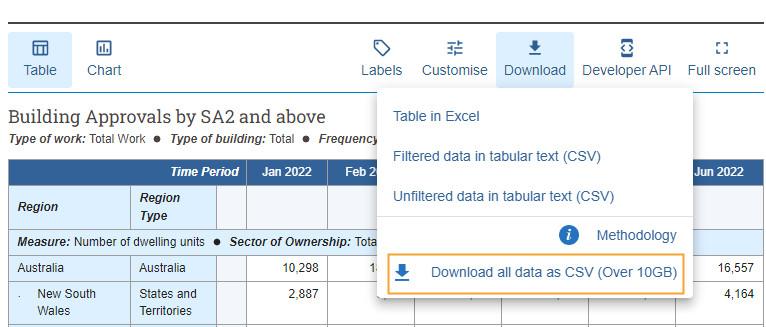
Alternatively, you can use filters to select a subset of all data and then download filtered data in tabular text (CSV). More information on Filtering the data section of this guide.
Product limitations
We do not currently load new datasets or update existing data series immediately following their 11:30am release on the ABS website. Therefore, data in Data Explorer may not necessarily be the most up to date. Please check the ABS website (abs.gov.au) for the latest data and always check the Time Period in Data Explorer. We will release the new data to Data Explorer as soon as possible after it is released on the ABS website.