MAIN FEATURES
Between 2017 and 2018:
- The number of people living in Australia's Greater Capital Cities increased by 307,800 (or 1.9%).
- The number of people living outside capital cities increased by 83,200 (1.0%).
- Capital city growth accounted for 79% of Australia's total population growth.
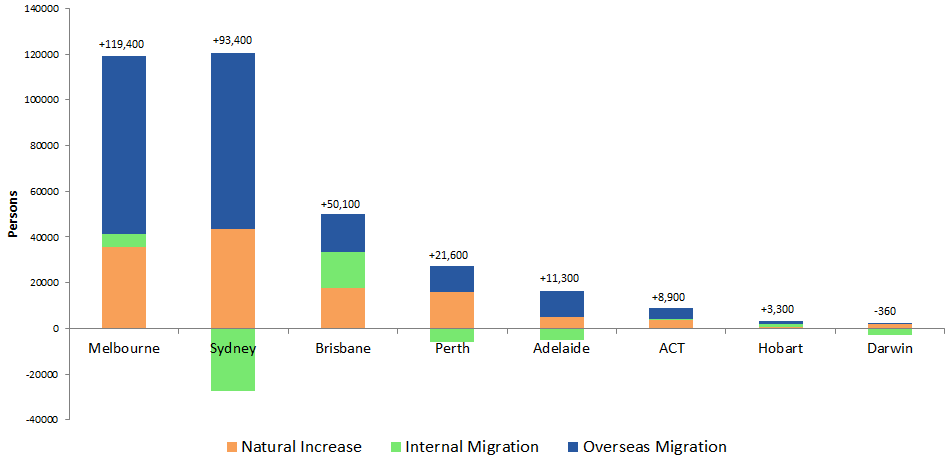
- The capital city with the largest increase in population was Melbourne (119,400 people), followed by Sydney (93,400) and Brisbane (50,100).
- The fastest growing city was Melbourne (2.5%), ahead of the Australian Capital Territory (2.2%) and Brisbane (2.1%).
- The only capital city to have a decline in population was Darwin, down by 360 people (-0.2%).
ESTIMATED RESIDENT POPULATION, States and Territories - Greater Capital City Statistical Areas (GCCSAs) |
|
 | | ERP AT 30 JUNE | POPULATION CHANGE |
| | 2018 | 2017-2018 |
| GCCSA | no. | no. | % |
|
| NSW | | | |
| Greater Sydney | 5 230 330 | 93 411 | 1.8 |
| Rest of NSW | 2 757 911 | 26 894 | 1.0 |
| Total | 7 988 241 | 120 305 | 1.5 |
| Vic. | | | |
| Greater Melbourne | 4 963 349 | 119 421 | 2.5 |
| Rest of Vic. | 1 497 326 | 19 648 | 1.3 |
| Total | 6 460 675 | 139 069 | 2.2 |
| Qld | | | |
| Greater Brisbane | 2 462 637 | 50 120 | 2.1 |
| Rest of Qld | 2 548 579 | 33 467 | 1.3 |
| Total | 5 011 216 | 83 587 | 1.7 |
| SA | | | |
| Greater Adelaide | 1 345 777 | 11 339 | 0.8 |
| Rest of SA | 390 645 | 1 160 | 0.3 |
| Total | 1 736 422 | 12 499 | 0.7 |
| WA | | | |
| Greater Perth | 2 059 484 | 21 582 | 1.1 |
| Rest of WA | 535 708 | -583 | -0.1 |
| Total | 2 595 192 | 20 999 | 0.8 |
| Tas. | | | |
| Greater Hobart | 232 606 | 3 346 | 1.5 |
| Rest of Tas. | 295 595 | 2 445 | 0.8 |
| Total | 528 201 | 5 791 | 1.1 |
| NT | | | |
| Greater Darwin | 148 564 | -355 | -0.2 |
| Rest of NT | 98 763 | 165 | 0.2 |
| Total | 247 327 | -190 | -0.1 |
| | | |
| ACT | 420 960 | 8 935 | 2.2 |
| Australia(a) | | | |
| Greater Capital City | 16 863 707 | 307 799 | 1.9 |
| Rest of Australia | 8 129 153 | 83 201 | 1.0 |
| Total | 24 992 860 | 391 000 | 1.6 |
|
(a) Includes Other Territories.
DRIVERS OF CAPITAL CITY POPULATION GROWTH
In 2017-18:
- Most of Melbourne's population growth (65%) was due to net overseas migration, natural increase accounted for 30% and net internal migration 5%.
- While net overseas migration added 77,100 people to the population in Sydney, the city recorded a net internal migration loss, meaning 27,300 more people left Sydney to move to other parts of Australia than arrived from other parts of the country.
- Net overseas migration, net internal migration and natural increase each accounted for around one-third of Brisbane's population growth.
- Perth also recorded a net internal migration loss (-5,800 people), while natural increase added 16,000 people to the city's population and net overseas migration added 11,400.
- For Adelaide, population gains from natural increase (4,800 people) were more than offset by a net internal migration loss (-5,100), while net overseas migration added 11,600 to the city's population.
- In the ACT, 54% of population growth was attributed to net overseas migration, 40% to natural increase and 6% to net internal migration.
- Net overseas migration contributed to 45% of Hobart's population growth, compared to 38% from net internal migration and 18% from natural increase.
- Darwin experienced a net internal migration loss of 2,800 people, which offset gains made from natural increase (1,800) and net overseas migration (640), contributing to an overall population decline for the city.
Figure 1. COMPONENTS OF POPULATION CHANGE, Greater Capital Cities, Australia, 2017-18
AUSTRALIA'S LARGEST AND FASTEST GROWING AREAS
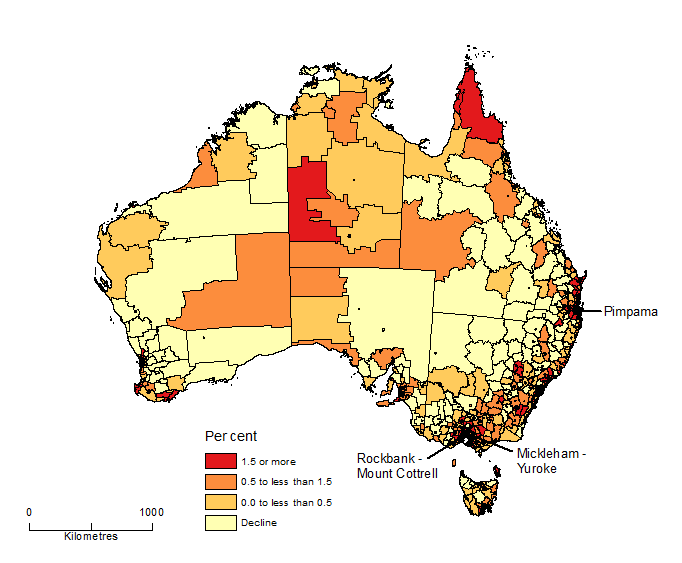
Largest growth areas: The Statistical Level Area 2 (SA2) of Cranbourne East in Melbourne's outer south-east (up by 7,300 people), followed by the outer Sydney suburbs of Riverstone - Marsden Park (5,000) in the north-west and Cobbitty - Leppington (4,500) in the south-west.
Fastest growth areas: Rockbank - Mount Cottrell (59%) in Melbourne's outer west, followed by Mickleham - Yuroke (52%) in Melbourne's outer north.
Regional growth areas: Outside of the capital cities, Pimpama, on Queensland's Gold Coast, was both the largest and fastest growing area in Australia (up by 3,700 people, or 29%).
SA2s WITH LARGEST AND FASTEST POPULATION GROWTH |
|
| | ERP AT 30 JUNE | POPULATION CHANGE |
| | 2018 | 2017-2018 |
| NATIONAL RANK & SA2(a) | SA4 | no. | no. | % |
LARGEST GROWTH |
|
| 1 Cranbourne East | Melbourne - South East | 41 381 | 7 251 | 21.2 |
| 2 Riverstone - Marsden Park | Sydney - Blacktown | 26 630 | 5 008 | 23.2 |
| 3 Cobbitty - Leppington | Sydney - South West | 26 918 | 4 463 | 19.9 |
| 4 Melbourne | Melbourne - Inner | 49 097 | 3 770 | 8.3 |
| 5 Pimpama | Gold Coast | 16 134 | 3 674 | 29.5 |
| 6 Tarneit | Melbourne - West | 43 403 | 3 660 | 9.2 |
| 7 Rouse Hill - Beaumont Hills | Sydney - Baulkham Hills and Hawkesbury | 27 828 | 2 672 | 10.6 |
| 8 Truganina | Melbourne - West | 30 249 | 2 616 | 9.5 |
| 9 Mickleham - Yuroke | Melbourne - North West | 7 361 | 2 525 | 52.2 |
| 10 Jimboomba | Logan - Beaudesert | 31 156 | 2 489 | 8.7 |
FASTEST GROWTH(b) |
|
| 1 Rockbank - Mount Cottrell | Melbourne - West | 6 455 | 2 405 | 59.4 |
| 2 Mickleham - Yuroke | Melbourne - North West | 7 361 | 2 525 | 52.2 |
| 3 Pimpama | Gold Coast | 16 134 | 3 674 | 29.5 |
| 4 Riverstone - Marsden Park | Sydney - Blacktown | 26 630 | 5 008 | 23.2 |
| 5 Palmerston - South | Darwin | 4 947 | 878 | 21.6 |
| 6 Cranbourne East | Melbourne - South East | 41 381 | 7 251 | 21.2 |
| 7 Cobbitty - Leppington | Sydney - South West | 26 918 | 4 463 | 19.9 |
| 8 Wollert | Melbourne - North East | 13 723 | 2 220 | 19.3 |
| 9 Greenway | Australian Capital Territory | 2 439 | 387 | 18.9 |
| 10 Coombs | Australian Capital Territory | 2 940 | 461 | 18.6 |
|
(a) National Rank based on population change between June 2017 and June 2018. See paragraphs 41 and 42 of the Explanatory Notes.
(b) Excludes SA2s with less than 1,000 people at June 2017. |
POPULATION CHANGE BY SA2, Australia
- 2017-18
 Quality Declaration
  Print Page
 Print All