TASMANIA
In 2017-18:
- The number of people living in Greater Hobart increased by 3,300 (1.5%), while the number living outside the capital city increased by 2,400 people (0.8%).
- Greater Hobart's growth rate remained unchanged from 2016-17.
Largest growth areas: The Statistical Areas Level 2 (SA2s) of Newnham - Mayfield, a suburb of Launceston, and Sorell - Richmond in Hobart's north-east (both up by 230 people).
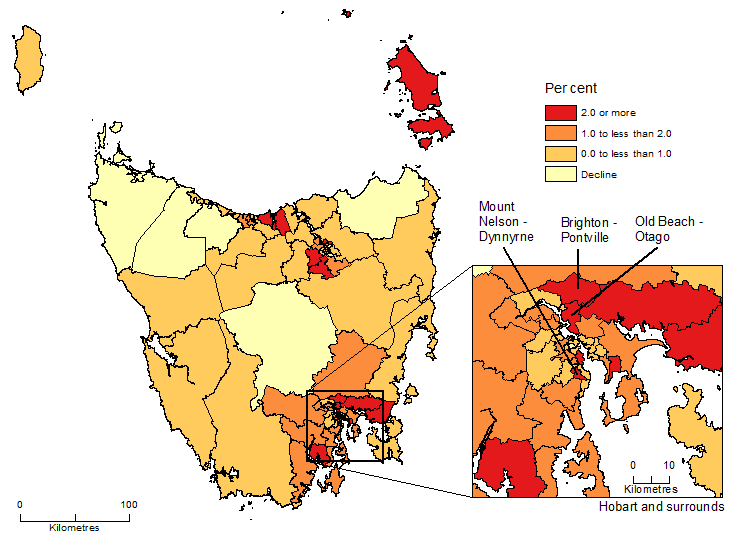
Fastest growth areas: Mount Nelson - Dynnyrne (3.9%), to the south of Hobart's central business district, followed by Old Beach - Otago (3.8%) on Hobart's eastern shore.
SA2s WITH LARGEST AND FASTEST POPULATION GROWTH, Tasmania |
|
 |  | ERP AT 30 JUNE | POPULATION CHANGE |
 |  | 2018 | 2017-2018 |
| SA2 | SA3 | no. | no. | % |
LARGEST GROWTH |
|
| Newnham - Mayfield | Launceston | 9 500 | 227 | 2.4 |
| Sorell - Richmond | Sorell - Dodges Ferry | 8 997 | 226 | 2.6 |
| Howrah - Tranmere | Hobart - North East | 10 944 | 202 | 1.9 |
| Kingston Beach - Blackmans Bay | Hobart - South and West | 10 899 | 197 | 1.8 |
| Mount Nelson - Dynnyrne | Hobart Inner | 5 146 | 194 | 3.9 |
| Kingston - Huntingfield | Hobart - South and West | 11 839 | 186 | 1.6 |
| Brighton - Pontville | Brighton | 5 831 | 178 | 3.1 |
| Rokeby | Hobart - North East | 6 475 | 176 | 2.8 |
| Hobart | Hobart Inner | 8 497 | 174 | 2.1 |
| Port Sorell | Devonport | 6 089 | 173 | 2.9 |
FASTEST GROWTH(a) |
|
| Mount Nelson - Dynnyrne | Hobart Inner | 5 146 | 194 | 3.9 |
| Old Beach - Otago | Brighton | 4 693 | 171 | 3.8 |
| Brighton - Pontville | Brighton | 5 831 | 178 | 3.1 |
| Hadspen - Carrick | Meander Valley - West Tamar | 3 461 | 101 | 3.0 |
| Port Sorell | Devonport | 6 089 | 173 | 2.9 |
| Longford | North East | 4 254 | 120 | 2.9 |
| Cygnet | Huon - Bruny Island | 4 586 | 128 | 2.9 |
| Rokeby | Hobart - North East | 6 475 | 176 | 2.8 |
| Sorell - Richmond | Sorell - Dodges Ferry | 8 997 | 226 | 2.6 |
| Newnham - Mayfield | Launceston | 9 500 | 227 | 2.4 |
|
| (a) Excludes SA2s with less than 1,000 people at June 2017. |
POPULATION CHANGE BY SA2, Tasmania - 2017-18

 Quality Declaration
  Print Page
 Print All