Survey of Income and Housing, User Guide, Australia
Describes the definitions, concepts, methodology and estimation procedures used in the Survey of Income and Housing.
Introduction
The purpose of this guide
This User Guide publication contains details about the Survey of Income and Housing (SIH) conducted in 2019–20. It includes information about the purpose of the survey, the concepts and contents, and the methods and procedures used to collect the data and derive the estimates. The publication also outlines the differences between the 2019–20 survey and earlier SIH surveys. Its purpose is to help users of the data understand the nature of the surveys, and the potential of these surveys to meet user needs.
The 2019–20 SIH collected information from a sample of 15,011 households over the period July 2019 to June, 2020.
Main purposes of the survey
The SIH is a household survey which collects information on sources of income, amounts received, household net worth, housing, household characteristics and personal characteristics. The principal objective of the survey is to facilitate the analysis and monitoring of the social and economic welfare of Australian residents in private dwellings. The main users are government and other social and economic analysts involved in the development, implementation and evaluation of social and economic policies.
Income and wealth data are used by economic and social analysts and policy makers to:
- understand the distribution of economic resources among private households in Australia
- identify households most at risk of experiencing economic hardship
- understand the effects of taxation and income support systems on the well-being of people and households.
Housing data are used for:
- housing affordability studies
- analysis of housing occupancy, including levels of home ownership and housing utilisation
- comparison of the housing costs by tenure type.
History of collection
The SIH was conducted annually from 1994–95 to 1997–98, and then in 1999–2000, 2000–01 and 2002–03. Commencing in 2003–04 the SIH has been conducted every two years and is integrated with the Household Expenditure Survey (HES) every six years.
Previous surveys of household income were conducted by the Australian Bureau of Statistics (ABS) in 1979, 1982, 1986 and 1990. These surveys were generally conducted over a two-month period, compared to a twelve-month period for the SIH. The SIH also included improvements to the survey weighting and estimation procedures, changes to the scope and coverage of household income and changes to interviewing methods.
Comprehensive household wealth data has been collected in every cycle of the SIH since 2003–04, except for 2007–08.
The 2009–10 and 2015–16 SIH and HES also included an additional sample of metropolitan households whose main source of income was a government pension or allowance to support the compilation of the Pensioner and Beneficiary Living Cost Index (PBLCI). From 2009–10, the SIH continues to include an additional sample of households outside of greater capital city areas to support housing indicators in regional areas.
Post-release changes
19 December 2022:
- Corrections to the data item list in conjunction with the re-issue of the basic and detailed Microdata products
13 July 2022:
- Minor corrections to data item list in conjunction with the basic Microdata release
1 July 2022:
- Minor corrections to data item list
10 May 2022:
- Additional datacube added to the data downloads section (Data Comparability between SIH and other ABS Sources)
- Typographical error fixed in Superannuation section
- Formatting errors fixed in Data collection and processing section
- Typographical errors fixed in Classifications and standards section
- Added hyperlinks in Historical information section
- Added CAWI to the Abbreviations section
- Added hyperlinks to the Wealth Comparison section
Income
The measurement of income in the ABS Survey of Income and Housing
The Survey of Income and Housing (SIH) collects detailed income information from each household member (15 years and over) through personal interview. Household income consists of all current receipts, whether monetary or in kind, that are received by the household or by individual members of the household, and which are available for, or intended to support, current consumption.
Income includes receipts from:
- employee income (whether from an employer or own incorporated enterprise), including wages and salaries and other receipts from employment, income provided as part of salary sacrifice and/or salary package arrangements, and non-cash benefits provided by employers
- profit/loss from own unincorporated business (including partnerships)
- net investment income (interest, rent, dividends, royalties)
- government pensions and allowances (includes pensions and allowances from Commonwealth and State and Territory governments as well as pensions from overseas)
- private transfers (e.g. superannuation, workers' compensation, income from annuities, child support, and financial support received from family members not living in the same household).
Household income excludes receipts from:
- capital transfers such as inheritance, lump-sum retirement benefits, life insurance claims (except annuities), compensation (except for foregone earnings), loan repayments
- certain current transfers offset against expenditures (for example, lottery and other gambling winnings, non-life insurance claims)
- receipts that result from a reduction in net worth (for example, sale of assets, withdrawals from savings, and loans obtained)
- holding gains/losses resulting from changes in the value of financial and non-financial assets and liabilities (for example, the value of shares held).
The various components of income are included below in 'Components of income'.
More information on the conceptual definition of household 'income' can be found in the publication Standards for Income Variables, June 2015 (cat. no. 1287.0).
Private, gross, disposable and final income
Private income
Private income comprises all current income receipts excluding government pensions and allowances.
The treatment of overseas pensions varies. Where 'private income' and 'government pensions and allowances' are presented the overseas pensions are included in 'government pensions and allowances'. In comparison, where 'private income (including imputed rent)' and 'social assistance benefits in cash' are presented the overseas pensions are included in the 'private income (including imputed rent)'. This is because 'social assistance benefits in cash' refers only to Australian government pensions and allowances.
Gross income
Gross income is the sum of the income from all sources before income tax and the Medicare levy have been deducted. Prior to 2005–06, Family Tax Benefit (FTB) was paid through the tax system or as a lump sum and was excluded from gross income for practical reasons. Since 2005–06 these payments have been included in gross income.
Disposable income
Disposable income is the income available to a person or household after income tax, Medicare levy and Medicare levy surcharge (if applicable) have been deducted. Disposable income better represents the economic resources available to meet the needs of households than gross income. The Medicare levy surcharge has been calculated and deducted from gross income in the calculation of disposable income since the 2007–08 cycle of SIH.
Income tax liability is estimated for all households using taxation criteria for the relevant financial year and the income and other characteristics of household members reported in the survey (such as private health insurance fund membership).
Prior to 2005–06 the derivation of disposable income also included the addition of Family Tax Benefit (FTB) paid through the tax system or as a lump sum by Centrelink since for practical reasons it was not included in the gross income estimates. From 2005–06 to 2013–14, FTB amounts were modelled for some households where those amounts were not reported by the respondents. However, from 2015–16, the introduction of a new model for micro-editing government payments includes modelling of FTB values. These have been utilised where the reported amount was missing, significantly above the maximum eligible amount or where other payments, related to FTB, were reported by survey respondents, such as single parents with children under 8 years who receive Parenting Payment. More information about the effect of this change is available in the 'Data collection and processing' chapter of this publication.
Note that while child support and other transfers from other households are included in the income of the households receiving the transfers, they are not deducted from the incomes of the households making the transfers when deriving disposable income.
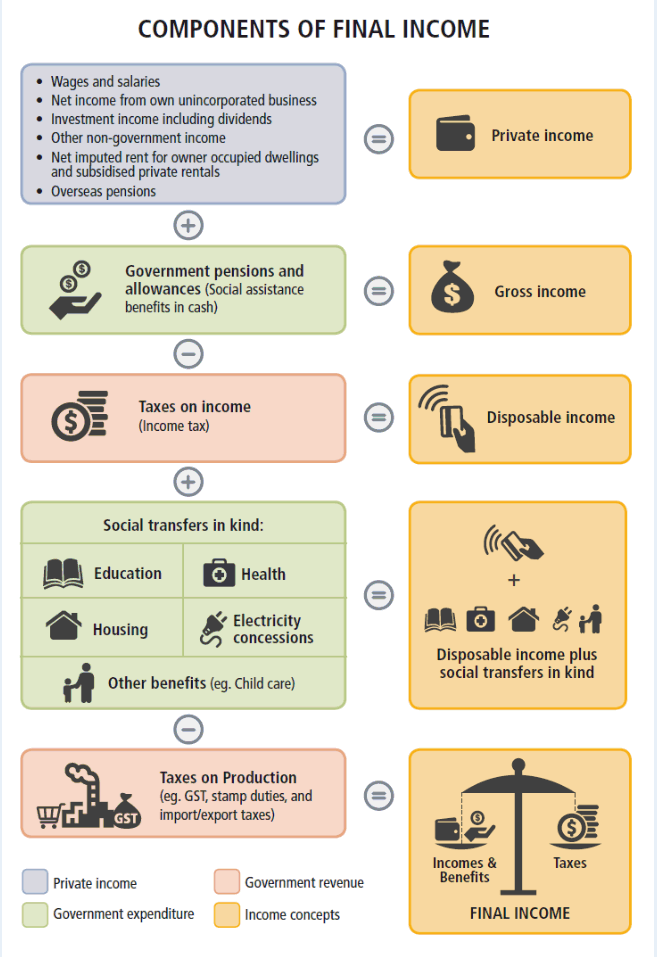
Final income
Final income is the most extensive concept of household income produced by the ABS. Final income is equal to household disposable income plus social transfers in kind, less taxes on production (such as the GST, duties on imports, and fuel and tobacco excise). Final income can only be calculated using data from the Household Expenditure Survey (HES) as taxes on production are estimated for individual households based on their purchase of goods and services and cannot be calculated in 2019–20. The HES is conducted every six years for a sub-sample of households.
Final income shows the full effect of taxation (income taxes and taxes on production) and government expenditure (cash payments and in kind transfers) on the distribution of income among private households in Australia.
More detail on the components of final income are available in the publication Government Benefits, Taxes and Household Income, Australia, 2015–16 (cat. no. 6537.0).
1. Diagram 1 - Income concepts and components
Current, annual and weekly income
Current and annual income
Current income is the income received by respondents at the time when survey information is collected from them. This is the main measure of income included in published output from the SIH.
For employees and recipients of government pensions and allowances such as Centrelink payments, current income is generally based on their most recent payment, as long as it is their usual payment. Additional questions are used to obtain information about receipts which may not have been included in the most recent payment. For employees, information is collected on irregular overtime, bonuses and non-cash benefits. For recipients of government pensions and allowances, information is collected on reductions to payments due to lump sum advances, and less frequent payments such as the Carer Supplement.
Annual income provides a somewhat longer term perspective of income, providing data about income obtained from all sources over the whole year. It has the advantage of being less sensitive to short term variations in income, such as a person having little or no current income during a short period of unemployment and for which they have adequate resources from past employment to avoid economic hardship. However, annual income has the potential to be limited in its relevance to the current situation of respondents, especially when analysing the combined income of a household which gained or lost adult members during the course of the year. There are also practical difficulties in collecting annual income, for example where respondents have had short periods of time in different jobs, or have received Centrelink payments for short periods of time, they may not accurately recall each of these sources of income.
Weekly income
Income is collected using a number of different reporting periods, such as the whole financial year for own unincorporated business and investment income, and the usual payment for a period close to the time of interview for wages and salaries, other sources of private income and government pensions and allowances. The income is divided by the number of weeks in the reporting period to derive weekly income. Estimates of weekly income from the SIH does not, therefore, refer to a specific week within the reference period of the survey.
Equivalised disposable household income (EDHI)
A major determinant of economic wellbeing for most people is the level of income that they and other family members in the same household receive. While income is usually received by individuals, it is usually shared between partners in a couple relationship and with dependent children. To a lesser extent, it may be shared with other children, other relatives and possibly other people living in the same household, for example, through the provision of free or cheap accommodation. This is likely to be the case for children other than dependents and other relatives with low levels of income of their own. Even when there is no transfer of income between members of a household, or provision of free or cheap accommodation, members are still likely to benefit from the economies of scale that arise from the sharing of dwellings. Therefore household income measures are often used for the analysis of people's economic wellbeing.
Larger households usually require a greater level of income to maintain the same material standard of living as smaller households, and the needs of adults are usually greater than the needs of children. The income estimates are therefore adjusted by equivalence factors to standardise them for variations in household size and composition, while taking into account the economies of scale that arise from the sharing of dwellings. The resultant estimates are known as equivalised disposable household income (EDHI). EDHI is calculated by adjusting disposable income by the application of an equivalence scale. This adjustment reflects the requirement for a larger household to have a higher level of income to achieve the same standard of living as a smaller household. Where disposable income is negative, it is set to zero EDHI.
When household income is adjusted according to an equivalence scale, the EDHI can be viewed as an indicator of the economic resources available to a standardised household. For a lone person household, it is equal to income received. For a household comprising more than one person, EDHI is an indicator of the household income that would be required by a lone person household in order to enjoy the same level of economic wellbeing as the household in question.
The concept of EDHI is applicable to both households and the people living in those households. That is, each person in a household has the same level of EDHI as the household itself. The difference between using households or persons as the unit of analysis is discussed in the 'Housing' section of this publication.
Published SIH output includes estimates of EDHI but not estimates of 'Equivalised gross household income', although the latter can also be produced.
Table 1 shows that a couple household with one child would need $1,800 weekly disposable income to have the same equivalised disposable household income as a lone person household with a disposable income of $1,000.
| Household composition | Equivalising factor (x) no. | Disposable income (y) $ | Equivalised disposable income (y/x) $ |
|---|---|---|---|
| Lone person | 1.0 | 1,000 | 1,000 |
| Couple only | (1 + 0.5) = 1.5 | 1,500 | 1,000 |
| Couple with one child under 15 years | (1 + 0.5 + 0.3) = 1.8 | 1,800 | 1,000 |
| Group household with three adults | (1 + 0.5 + 0.5) = 2.0 | 2,000 | 1,000 |
Equivalence scales are mainly used for household income, but can also be used for household wealth and expenditure.
Components of income
Income in the SIH is collected in separate components. This section of the publication explains the definitions used for each of those components, and also describes some components of income that are not included in the aggregate income measures included in SIH publications. Data for some of the excluded components are available from the surveys. Each of the detailed income data items and the aggregate measures of income are included in the data item list, which will be available from the 'Data Download' section of this publication.
The ABS revised its standards for household income statistics following the adoption of new international standards in 2004 and a review of aspects of the collection and dissemination of income data. Income estimates from 2007–08 applied the new income standards which are reflected in the following definitions of the components of income.
More details on the nature and impact of the change in income measures are available in Appendix 4 'Improvements to income statistics' in the Information Paper: Survey of Income and Housing, User Guide, Australia 2007–08 (cat. no. 6553.0).
Employee income
Employee income is collected in the SIH from each person aged 15 years and over who worked for an employer or in his/her own limited liability business. It comprises all payments received by individuals as a result of their current or former involvement in paid employment.
The aggregate current income estimates produced from the SIH include the usual pay that respondents received in the most recent pay period. They include wages and salaries, amounts salary sacrificed, tips, commissions, piecework payments, penalty payments and shift allowances, remuneration for time not worked (e.g. sick and holiday pay) and workers' compensation paid through the payroll. In addition, other components such as non-cash benefits, bonuses, termination payments and payments for irregular overtime worked are all included.
The aggregate annual income estimates produced from the SIH include total income from all jobs in the financial year prior to the survey. These have not been collected for output from the 2017–18 cycle of SIH onwards with the exception of business income.
Own unincorporated business income
Own unincorporated business income is collected from all persons aged 15 years and over who are working as owners or partners in unincorporated enterprises. Own business income is the share of the profit/loss of the enterprise accruing to the person. Profit/loss consists of the value of the gross output of the enterprise after the deduction of operating expenses and an allowance for depreciation of assets used in producing the output. Losses occur when operating expenses and depreciation are greater than gross receipts and are treated as negative incomes.
Since profit or loss calculations are often only made by businesses on a quarterly or annual basis, it is not possible to collect data on current income in the same way as can be done for employee income or current cash transfer income. Instead, survey respondents are requested to provide an estimate of their own business income they expect to receive in the current financial year. Responses are likely to be less accurate when collected early in the year and more accurate when collected later in the year, and there is some likelihood that responses will be too optimistic or too pessimistic, resulting in some bias in the aggregate estimate. However, this methodology gives better results than the methodology used in surveys up to and including 2002–03 that simply extrapolated reported own business income from the previous financial year onto the current period. Under the previous methodology, estimates could also have a strong downwards bias - particularly for new businesses - but could also be significantly upwardly biased if the current business circumstances had turned down from the previous year.
Investment income
Investment income includes interest and dividend income received as a result of the ownership of financial assets such as bank accounts and shares, and rent and royalty income received from the ownership of non-financial assets. From 2015–16 SIH also includes income from offset accounts, which is an estimate of the amount households saved in interest on their loans, as a component of income.
The rent component of investment income is measured on a net basis, that is, gross rent less operating expenses and depreciation allowances. Interest paid on money borrowed to purchase shares or units in trusts is also deducted from income earned from these sources giving a net income earned from such investments. All other components, for which associated expenses are normally relatively small, are on a gross basis.
Rent comprises receipts from residential properties, other than owner-occupied dwellings, and from non-residential properties. Operating expenses deducted from gross rent include a range of dwelling related expenses such as repairs and maintenance expenses, rates and interest payments. If the operating expenses plus depreciation allowances are greater than the gross rent, net rental income is negative.
Current investment income is collected by asking survey respondents for an estimate of their total expected income in the financial year, as described above for own unincorporated business income.
Government pensions and allowances
Government pensions and allowances are cash transfer payments made by government entities to persons under social security and related government programs. They are primarily paid by Centrelink or the Department of Veterans' Affairs, and include pensions paid to aged persons, benefits paid to veterans and their survivors, study allowances for students, Family Tax Benefit (FTB), etc.
Some government payments are excluded from income as they are considered to be either a reimbursement of expenditure or a capital transfer. In deciding whether a government payment should be included in income, the intent of the government payment is considered. Government payments considered to be reimbursements of expenditure, including the Medicare rebate, Child Care Subsidy, payments considered to be capital transfers are also not included as income. Examples of capital transfers include the First Home Owner Grants Scheme, as it is designed to help first home buyers purchase their own home, and the aged persons' savings bonus and self-funded retirees' supplementary bonus (paid as part of the introduction of The New Tax System in 2000–01) as they were designed to help retired people maintain the value of their savings and investments following the introduction of the GST.
The Newborn Supplement and Newborn Upfront Payment (replaced the Baby Bonus since 1 March 2014) is included as income, recognising that the intention of payment is to offset some of the extra consumption costs incurred with the birth of a child. It is paid to parents to take care of their newborn or adopted children for at least 13 weeks. This payment is included in income and paid as part of Family Tax Benefit Part A,
Paid Parental Leave, introduced on 1 January 2011, is also included as income as per the Newborn Supplement. Under the Paid Parental Leave scheme, eligible working parents can get government funded pay when they take time off from work to care for a newborn or recently adopted child. The income test for paid parental leave requires that the parent or parents earn no more than $150,000 in the year previous to the child's birth. People who meet the eligibility requirements must decide which payment, paid parental leave or Newborn Supplement, is best suited to them, as both payments cannot be received for the same child.
Dad and Partner Pay is an entitlement under the Paid Parental Leave Scheme paid directly to a working dad or partner who cares for a child born or adopted from 1 January 2013. Dad and Partner Pay up to two weeks of government-funded pay at the rate of the National Minimum Wage. The Dad and Partner Pay can be taken all at once at any time in the first year after birth or adoption.
The Energy Supplement (payment commencing 20 September 2014), formerly known as the Clean Energy Supplement, is included in income from government pensions or allowances. This tax-exempt, indexed payment is paid to pensioners, other income support recipients, families receiving Family Tax Benefit payments and Seniors Supplement recipients, provided they meet eligibility requirements.
Values of FTB paid as a lump sum and one-off payments regarded as income are annualised, that is, treated as though they were paid evenly through the year. Therefore the amount included in current weekly income is the total payment for the year divided by 52.14, the average number of weeks in a year. The payments are assigned to all respondents who would have met the eligibility criteria at the time that they were interviewed, even if the payments were only announced after the interview took place. If an annualised approach was not taken, a few respondents receiving the benefit would include a large amount in the current income, and most people eligible for the benefit would not include any payment because it was not received in the fortnight before the interview.
All pensions received from overseas are included under government pensions and allowances.
Other income
Other income includes non-government pensions such as superannuation and life insurance pensions, regular annuity benefits, private scholarships or study allowances, workers’ compensation not paid through the payroll, child support payments (non-government), income from accident/sickness insurance, and other current transfers received from family members living in other households, such as parental allowances paid to students living away from home.
Note that, while child support and financial support received from other family members not living in the same household are included in the income of the households receiving the transfers, they are not deducted from the disposable income of the households making the transfers.
Workers' compensation payments are made to injured employees to compensate for foregone earnings and to meet ongoing medical costs. While regular workers' compensation receipts have been included in previously published results, lump sum receipts were not. Commencing in the 2007–08 SIH, both forms of workers' compensation are included in the published estimates.
A cut-off has been applied to significant lump sum amounts, where it was considered likely that part of the receipt would be saved to meet future expenses, rather than to support current consumption. Two methods were applied in determining the cut-off limit. For respondents who reported some employee income, the cut-off was applied at the equivalent of three months pay, based on the greater of the respondent's reported employee income and average weekly earnings. For those reporting no employee income, the cut-off was applied at the equivalent of 52 weeks average weekly earnings.
Income tax and Medicare levy
In 2019–20, estimates of income tax, the Medicare levy and the Medicare levy surcharge relate to the liability associated with the income being reported by respondents, regardless of when it is actually paid. In other words, an accrual rather than cash-based concept is used.
Income tax is modelled for all households using the relevant taxation criteria and the income and other characteristics of household members reported in the survey.
Low and lower income households
The economic wellbeing of households with very low incomes is of particular interest to social policy researchers and analysts. The 2019–20 outputs from the SIH use the same definition of 'Low income' and 'Lower income' households that were adopted for the 2013–14 and 2017–18 SIH.
Low income households
Analysis of 'Low income' households is presented in Household Income and Wealth, Australia, 2019–20 (cat. no. 6523.0).
'Low income' definition (2013–14 SIH and onwards)
The current definition of 'Low income' households are those with incomes in the 3rd to 20th percentiles of equivalised disposable household income, that is, the lowest income quintile excluding the bottom two percentiles. Estimates for this population in the relevant data cubes are labelled 'Adjusted lowest income quintile'.
The time series data presented from 1994–95 to 2019–20 in the publication Household Income and Wealth, Australia, 2019–20 uses the updated definition.
'Low income' definition (SIH 2011–12 and previous)
Prior to the 2013–14 SIH, 'Low income' households were defined as those in the second and third deciles of equivalised disposable household income, that is, it excluded all households in the lowest income decile. Estimates for this population in the relevant data cubes in survey outputs up to 2011–12 SIH are labelled 'Second and third deciles'.
Lower income households
Analysis of 'Lower income' households is presented in the publication Housing Occupancy and Costs, Australia (cat. no.4130.0).
'Lower income' definition (2013–14 SIH and onwards)
The current definition of 'Lower income' households are those with incomes in the 3rd to 40th percentiles of equivalised disposable household income, that is, the lowest two income quintiles excluding the bottom two percentiles. This new definition covers 38% of the total population.
'Lower income' definition (SIH 2011–12 and previous)
Prior to the 2013–14 SIH, 'Lower income' households were defined as those with equivalised disposable household income between the 10th and 40th percentiles, that is, it excluded all households in the lowest income decile. This old definition therefore covered 30% of the total population.
Low economic resource households
There are many factors that influence whether people are experiencing economic hardship. People living in households with low economic resources, i.e. low income and low wealth, are considered most at risk of experiencing economic hardship, particularly if their income falls or they have substantial unexpected expenses.
The ABS has developed a low economic resource (LER) measure that includes people who are simultaneously in the lowest four deciles of both equivalised disposable household income (including private imputed rent) and equivalised household net worth. It therefore excludes people with either relatively high incomes or relatively high wealth.
The LER measure classifies around 20% of people in low income, low wealth households, although the actual proportion will vary over time as the joint distribution of income and wealth changes. It does not identify whether these people are actually experiencing economic hardship.
One of the strengths of this measure is its ability to contrast the characteristics of the LER population with those in the low income and low wealth quintiles.
2. Diagram two illustrates the relationship between income and wealth, highlighting low economic resource households.
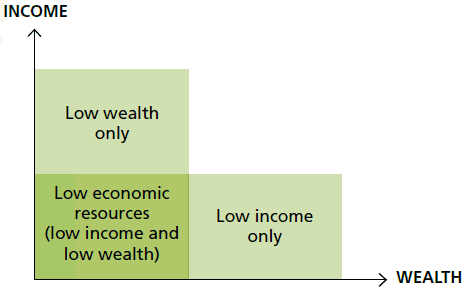
Analysis of low economic resource households is also available in the Household Economic Wellbeing 'Fact sheet 3. Low economic resource household' and the feature article 'Low Economic Resource Households' in the publication Household Income and Income Distribution, Australia, 2011–12 (cat. no. 6523.0).
Wealth or Net Worth
Wealth framework
Wealth refers to economic resources in the form of the balance of assets and liabilities held by members of a household. The value of wealth, or net worth, is measured at a point in time, and is therefore a stock concept.
Wealth data from the Survey of Income and Housing (SIH) are compiled in accordance with internationally agreed guidelines for producing micro statistics on household wealth, as reflected in the OECD Guidelines for Micro Statistics on Household Wealth (OECD, 2013). This publication provides an internationally agreed set of standard concepts, definitions and classifications for micro wealth statistics and best practice for compiling and analysing wealth statistics.
Components of wealth
Wealth is comprehensively collected in the SIH. Common assets and liabilities are collected through detailed questions, and uncommon items are able to be identified and valued through questions about 'other assets' and 'other liabilities' not otherwise identified.
Assets
An asset can be viewed as a store of value that provides a benefit or series of benefits accruing to the economic owner by holding or using the asset over a period of time. Assets may be financial or non-financial.
Financial assets include:
- accounts in financial institutions, such as bank deposits and offset accounts
- superannuation accounts
- listed and unlisted shares and trusts
- the value of own unincorporated businesses
- the outstanding value of loans made to persons in other households or to businesses.
Non-financial assets include:
- residential and non-residential properties and land, not part of an unincorporated business
- consumer durables that are used repeatedly and for more than one year, such as vehicles, household furniture and appliances, clothes and other personal items
- art work and other collectibles
- intangible fixed assets such as intellectual property and computer software.
Liabilities
A liability is established when one unit (the debtor) is obliged, under specific circumstances, to provide a payment or series of payments to another unit (the creditor). All liabilities are financial in nature, and for all financial assets held by a household there is a corresponding liability held by another party.
Liabilities are primarily the value of loans outstanding including:
- mortgages
- borrowings from other households
- investment loans
- credit card debt
- debt on other loans such as personal loans to purchase vehicles, and study loans.
In the SIH, most assets and their related liabilities are collected separately, e.g. the estimated value of dwellings (owner-occupied and other property) are collected independently of the value of loans associated with these dwellings.
Asset and liability data can be collected on a net basis rather than collecting the value of each component. For the SIH, if a survey respondent owns or partly owns a business, they are asked how much they would receive if they sold their share of the business and paid off any outstanding debts. Therefore, the value of the assets and debt held by these businesses cannot be separately reported. This is the only type of asset collected on a net basis for the SIH.
While some assets, e.g. bank accounts, are collected from each person in households selected in the SIH, other assets and liabilities are collected from the household in total, including property and loans. Therefore, it is not possible to produce person level estimates of the total assets and liabilities owned by households.
Mean values of the detailed assets and liabilities collected in the SIH are available in the publication Household Income and Wealth, Australia, 2019–20 (cat. no. 6523.0).
Derivation of wealth/net worth
Household wealth is represented by the household's net worth. Net worth is calculated as the difference between the stock of household assets and the stock of household liabilities. Net worth is positive when the value of household assets is more than the value of household liabilities. Likewise, net worth is negative when household liabilities exceed household assets.
While there may be individual ownership of assets, the benefit of asset ownership is shared at least to some extent between members of the household. Therefore, for analysis of the economic wellbeing of both individuals and households, net worth of households is most appropriate.
Equivalised net worth
Wealth is often built up during a person's working life and then used during retirement when the composition of the household might be quite different. Therefore, unlike income, the main measure of household wealth, or net worth, is unequivalised. For this reason, any wealth analysis should take into account the impact of the population's age distribution. The age at which wealth is accrued is also important - due to the impact of compound interest or compounding value over time for many assets and liabilities. For more information see the 'Income' section of this publication.
However, when wealth is being used to support current consumption, or to identify households at risk of economic hardship, household wealth should be equivalised with the same scale used to equivalise household income and consumption. Equivalised household net worth is used in the ABS low economic resource measure and, for comparison purposes, is included in a small number of tables in output from the SIH.
Low wealth households
Low wealth households are those in the bottom quintile of household net worth. This includes households with nil or negative net worth.
Debt ratios
Household debt can support the purchase of capital assets such as a dwelling or vehicle, or can provide short-term funds if a household experiences an unexpected large expense. However, high debt levels can leave households vulnerable to financial hardship if their economic circumstances change.
Analyses on debt ratios have been included in the output presented in the publication Household Income and Wealth, Australia, 2019–20. Two ratios are presented:
- debt to disposable income
- debt to assets.
Debt to disposable income ratios
Debt to income ratios focus on the ability of households to meet their ongoing obligations to service their debts, such as mortgage payments, student or car loan repayments or credit card repayments.
Debt to income ratios are calculated as: total household debt divided by annualised disposable household income. Debt to income ratios can also be calculated using gross household income.
The ABS has chosen disposable income for use in debt ratios as it is the income available to households to meet their expenditure needs after paying their tax obligations, and therefore the income available to service their debt. Households with nil and negative income are included in the ratios. For this purpose they are allocated a nominal annualised disposable income of 10 cents. Households with zero or negative debt are not included in the calculation.
Consistent with the Organisation for Economic Cooperation and Development (OECD) definition of over-indebted households, estimates have also been provided of the proportion of households with debt three or more times their income.
Debt to asset ratios
Debt to asset ratios show the proportion of a household's debt compared to the value of its assets. Households with high debts compared to their assets are considered at higher risk of financial hardship if there was a sudden change in asset values, e.g. if house prices were to fall substantially.
The debt to asset ratio has been calculated as: household total debt divided by household total assets. Households with nil or negative total assets, such as those with a business that has liabilities greater than the value of its assets, are included in the ratios. For this purpose they are allocated a nominal total asset value of 10 cents. Households with zero or negative debt are not included in the calculation.
Consistent with the OECD definition of over-indebted households, estimates have also been provided of the proportion of households with debt worth 75% or more of the value of their assets.
Changes across cycles
The value and detailed composition of the wealth of households has been collected in the SIH since 2003–04, in all survey cycles except for 2007–08.
There have been some changes between surveys to improve measures of household wealth, in particular:
- from 2009–10, the value of public unit trusts and private trusts have been collected separately (previously the value of a household's trusts were collected as a combined total)
- from 2009–10 the value of silent partnerships has been specifically collected
- from 2011–12 the value of offset accounts has been specifically collected
- from 2017–18 credit card balances were asked of all persons aged 18 years or over (previously the household spokesperson reported these balances on behalf of all members of the household)
- from 2017–18 student loan balances were asked of all persons aged 15 years and over (previously the household spokesperson reported these balances on behalf of all members of the household)
The value of children's assets has not be collected since 2011–12.
In 2011–12 SIH output, the classification of assets was changed to align with the new OECD Wealth Guidelines. The main change compared to the classification used in output from previous SIH cycles was that the value of own unincorporated business (net of liabilities) and the value of silent partnerships became financial assets whereas previously they had been treated as non-financial assets.
Prior to 2013–14, household wealth estimates were published in the publication Household Wealth and Wealth Distribution, Australia 2011–12. Since 2013–14, detailed wealth data from the SIH have been published in the publication Household Income and Wealth, Australia.
Comparison of wealth between SIH and the Australian System of National Accounts
While the concepts of net worth used in the SIH have many similarities to the household net worth definition used in the Australian System of National Accounts (ASNA), they also differ in many respects.
The SIH wealth data are collected from households and can be used to analyse the distribution of wealth across the population and to compare levels of wealth between various population subgroups. The ASNA estimates net worth by using many different data sources and provides a comprehensive picture of the household sector as a whole, presented within a national accounting framework.
A detailed comparison of SIH and ASNA net worth estimates from 2003–04 to 2017–18 is available in the 'Comparisons with Australian Systems of National Accounts (ASNA)' section of this user guide.
Housing
Housing statistics
The Survey of Income and Housing (SIH) contains a wide range of variables that directly relate to many aspects of people's housing. These include tenure, dwelling structure, and number of bedrooms. Some other housing concepts are outlined in more detail below.
Detailed housing information from the SIH are published in Housing Occupancy and Costs, Australia (cat. no. 4130.0).
Housing costs
Housing costs are regular outlays made by household members in providing shelter for themselves. The data collected on housing outlays in the SIH are limited to major outlays on housing, such as mortgage repayments, repayments of unsecured loans for housing purposes, rent, property and water rates, and body corporate fees. Only payments that relate to the dwelling occupied by the household at the time of interview are included. The ABS publication Housing Occupancy and Costs, Australia presents a measure of housing costs defined simply as the sum of rent payments; rate payments (water and general); and mortgage or unsecured loan payments (if the initial purpose of the loan was primarily to buy, add, or alter the occupied dwelling).
There are a number of limitations with the housing costs information obtained in the SIH, due to practical data collection considerations. These limitations should be especially borne in mind when comparing the housing costs of different tenure and landlord types, i.e. when comparing the costs of owner occupiers with the costs of renting households, and when comparing the costs of households renting from state and territory housing authorities with the costs of other renters.
- Some households are reimbursed some or all of their housing costs. Rent Assistance (RA), paid by the Australian Government to qualifying recipients of income support payments is an important type of reimbursement of relevance to these statistics.
- Mortgage repayments made by owners with a mortgage include both the interest component and the principal component. For some purposes it may be more appropriate to consider repayments of principal as a form of saving rather than as a recurrent housing cost, as it reflects the purchase of a housing asset by increasing the equity in the property held by the household and is an addition to the wealth of the occupants.
- A fuller measure of housing costs would include a range of outlays not collected in the SIH but which are necessary to ensure that the dwelling can continue to provide an appropriate level of housing services. These include body corporate fees, repairs, maintenance and dwelling insurance, and are costs that tend to be incurred by owner occupier households but not by renting households.
For further information on this topic, see the Housing Cost Measures appendix to the 'methodology' tab of Housing Occupancy and Costs, Australia.
Housing costs and household income
Housing costs are often a major component of total living costs. Therefore housing costs are often analysed in relation to total income, sometimes referred to as an affordability ratio. However, the quality of these measures are subject to the limitations of housing cost estimates obtained in the SIH that are described in the previous paragraph. Housing affordability ratios derived from the SIH in particular are affected by the inclusion of RA in the value of income collected.
To illustrate the issue discussed above, consider two households that are renting their dwellings. Both receive government pensions of $400 per week. One rents from a public housing authority and pays rent of $100 per week. The other pays $135 rent per week to a private landlord and receives RA of $35. In Housing Occupancy and Costs, the housing costs of the latter household would be recorded as $135 and their income would be recorded as $435. The couple renting from the public housing authority has a housing costs to income ratio of 25%. The housing costs to income ratio for the latter household would be 31%. If RA receipts are subtracted from housing costs and income, the housing costs to income ratio for the latter couple is also 25%, demonstrating that there is no substantive difference between the housing costs or income situation of the two couples. This issue is also of concern when considering changes in affordability ratios over time, since there has been a shift from providing public housing to providing RA as a means of supplying affordable housing to low income people.
While housing costs can be a major component of total living costs, the difference between the housing costs of a larger household and a smaller household would not be expected to be as great as the difference in many other costs, such as food or clothing. In other words, larger households can be expected to experience economies of scale in the supply of housing. This means that if a larger household and smaller household both have the same standard of living, it could be expected that on average the larger household will have a lower housing cost to income ratio. Therefore relatively high housing cost to income ratios are more of a concern with respect to larger households than smaller households. This should be borne in mind when comparing ratios across different household sizes.
In comparing households' housing costs with their income, it should be noted that households have a variety of housing preferences. Some people may choose to live in an area with high land values because it is close to their place of employment and therefore they have lower transport costs. Some people choose to incur relatively high housing costs because they prefer a relatively high standard of housing to other consumption or investment choices. High mortgage repayments might reflect a choice to purchase a relatively expensive home, or pay off a mortgage relatively rapidly, as a form of saving.
Housing affordability
One way of examining housing affordability is to look at households whose spending on housing is likely to impact on their ability to afford other living costs such as food, clothing, transport and utilities. A common threshold applied is the proportion of households spending more than 30% of their income on housing costs.
Higher income households have greater capacity to spend a high proportion of their income on housing without impacting their ability to meet other living costs. Accordingly, a 30% housing costs threshold is commonly applied to those households whose equivalised disposable household income falls in the bottom 40% of Australia’s income distribution, referred to as lower income households. This is commonly referred to as the '30/40 rule' of housing affordability. Lower income households that spend more than 30% of their gross income on housing costs are sometimes referred to as being in ‘housing stress’.
Some affordability measures, including the 30/40 rule, may exclude households that report nil or negative income or those reporting extremely low incomes, such as those in the bottom 2% of the equivalised disposable household income distribution, as data suggests this group includes households with temporarily low or irregular incomes, or accumulated wealth that supports their consumption.
Measures of housing affordability are often restricted to renters as this population group is of particular interest to housing policy makers. Rental Affordability, Lower Income Renter Households, National Housing and Homelessness Agreement basis' is used to calculate the official government measure of housing affordability. Among other things, this basis subtracts RA from estimates of income and housing costs, and produces a different measure to the affordability statistics published throughout the remainder of Housing Occupancy and Costs.
Cyclical housing items
Additional Housing Content Collected in 2019-20
The SIH 2019–20 included additional housing topics to enable reporting of the broader housing circumstances of households. The ABS collects additional information on housing in the SIH every six years. The additional information was collected in 2007–08 and published in Housing Mobility and Conditions, 2007–08 (cat. no. 4130.0.55.002). For 2013–14, the additional housing content was published in an additional data cube available with Housing Occupancy and Costs, Australia (cat. no. 4130.0).
ADDITIONAL TOPICS
The additional housing topics selected for inclusion in 2019–20 SIH, include:
Housing mobility:
- Number of years lived in current dwelling
- Number of times moved in last 5 years
- Structure of previous dwelling
- Geographical area of previous dwelling
- Tenure type of previous dwelling
- Previous landlord type or provider of rent free dwelling
- Reasons for last move
- Reasons likely to move in next 12 months
- Barriers to moving
Housing condition and dwelling characteristics:
- Types of major structural problems
- Number of major structural problems
- Sources of water for dwelling
- Sources of energy used in dwelling
- Satisfaction with current dwelling
Home purchase for first home buyers
- Source(s) of home deposit
- Size of home deposit
- Whether received monetary assistance to purchase dwelling
Household finances of owners with a mortgage
- Whether have refinanced loan for property in the last 2 years
- Reason(s) for refinancing
Rental arrangements and the affairs of renters
- Length of lease
- Amount of bond paid
- Whether have been refused rental accommodation in last 5 years
- Number of years that respondent has rented (in all rentals) - recent continuous
Housing utilisation
The concept of housing utilisation applied in the SIH is based upon a comparison of the number of bedrooms in a dwelling with a series of household demographics including the number of usual residents, their relationship to one another, age and sex. There is no single standard measure of housing utilisation. However, the Canadian National Occupancy Standard (CNOS) is applied in the SIH and is widely used internationally.
The CNOS is sensitive to both household size and composition. The measure assesses the bedroom requirements of a household by specifying that:
- there should be no more than two persons per bedroom
- children less than five years of age of different sexes may reasonably share a bedroom
- children less than 18 years of age and of the same sex may reasonably share a bedroom
- single household members 18 years and over should have a separate bedroom, as should parents or couples
- a lone person household may reasonably occupy a bed sitter.
The CNOS variable compares the number of bedrooms required with the actual number of bedrooms in the dwelling. Households living in dwellings where this standard cannot be met are considered to be overcrowded.
Child Care Use and Cost
Child Care Use and Cost
Many parents and caregivers across Australia utilise formal and informal child care to support labour force participation and education and training; to meet children's development needs; or to supplement care from the primary caregiver for other reasons. Recognising the increased importance of child care to support these outcomes, the Australian government subsidises child care for most households. Child care subsidies are a social transfer in kind that many parents and caregivers rely upon in order to afford the consumption of child care services.
Data on child care including usage, costs, and barriers to labour force participation due to child care related reasons were included in the Survey of Income and Housing (SIH) for the first time in 2007–08. These topics were added to the SIH to meet user requirements and provide data items examining the interactions between child care use, income and labour force participation. These data items are not intended to provide a detailed exploration of child care: this can be found in Childhood Education and Care, Australia, June 2017 and National Early Childhood Education and Care Collection: Concepts, Sources and Methods, 2013.
Data collection
Child care information was collected from households containing resident children aged 0–13 years. The information was obtained from an adult who permanently resided in the household and was deemed to be the 'best person' able to provide this information. In the majority of cases this was the child's parent, step-parent or guardian.
Questions about type(s) of child care used (formal or informal), school attendance, preschool attendance and the cost of care were asked in relation to each child aged 0–13 years in the household. If formal or informal care was used by a child in the last four weeks, further questions about the cost of care, Child Care Subsidy and hours used were asked for each episode of care (that is, each type of care for each child).
Formal and informal child care
Formal care is defined as regulated care away from the child's home. The main types of formal care are before and after school care, long day care, family day care, occasional care and vacation care.
Informal care is defined as non-regulated care, arranged by a child's parent or caregiver, either in the child's home or elsewhere. It comprises care by (step) brothers or sisters, care by grandparents, care by other relatives (including a parent living elsewhere) and care by other (unrelated) people such as friends, neighbours, nannies or babysitters. It may be paid or unpaid.
More than one type of care could be selected, therefore some items are multiple response in nature. An explanation of how to use these multiple responses will accompany the release of the basic and detailed microdata product to assist microdata users.
Child care hours and reference periods
Data was collected on child care used in the four weeks prior to the personal interview, and as such most data items relate to 'last four weeks'. In addition, data is available for care types used 'in the last week' where the number of hours of care used last week was one or more. In addition to the number of hours of care used last week, parents and caregivers are asked about the number of hours of care they pay for.
Child care costs and subsidies
Data on child care costs and subsidies output from the SIH are a combination of modelled and reported data. While child care hours and costs are output as reported, subsidies are modelled for all eligible families, and where the modelled data was higher than the reported data, the modelled data has been output. In 2013–14, the output items were revised to provide information on child care costs in a manner either fully exclusive (gross), or fully inclusive (net) of child care subsidies.
Cost of care
The gross cost of child care (not including the receipt of subsidies) was collected in the 2019–20 SIH. Estimates of Child Care Subsidy (CCS) is collected from the child care questions. Historically there has been a significant gap between the reported number of households receiving assistance and the total value of that assistance, compared to administrative records. In 2019–20 CCS have been modelled to improve the estimates of these payments.
Total cost is output at three levels: Child care, Income Unit and Household, with a slight variation in the concept between the levels.
- Child care level - the total cost of care is directly the cost as reported for that care, irrespective of child care subsidies. No adjustments are made.
- Income unit level - the total cost of care is the sum of child care subsidies and out of pocket costs (includes informal care).
- Household - the total cost of care is the sum of child care subsidies and out of pocket costs (includes informal care).
The income unit is the preferred unit of analysis for child care. Resources at the income unit level are usually shared between partners in a couple relationship and with dependent children. However, there are limitations on the data provided at this level. At the income unit level, child care data are aggregated from lower levels and as such may apply to more than one child in an income unit. For example, 'Total number of hours of formal and informal child care income unit usually uses each week' is equal to the sum of all hours used by all children in the household.
Child Care Subsidy (CCS)
The Child Care Subsidy (CCS) is the main way the Australian Government helps families with child care fees. The CCS replaced the two previous payments: Child Care Benefit and Child Care Rebate. The CCS is generally paid directly to providers who pass it on to families as a fee reduction. Families pay the difference between the provider’s fee and the subsidy amount. Families can get CCS when their child is unable to attend child care up to 42 days a year and can get extra absence days in certain circumstances.
An individual is eligible for CCS for a session of care provided by an approved child care service to a child if, at the time the session is provided:
- the child is Family Tax Benefit or regular care child of the individual or their partner
- the child is 13 years of age or under and does not attend secondary school
- the child meets immunisation requirements, and
- the individual, or their partner, meets the residency requirements.
The CCS is income tested and activity tested. The income test determines the rate of CCS: a percentage of either the fee charged or a set hourly fee cap, whichever is lower. The activity test determines how many hours of child care per fortnight can be subsidised by the CCS.
The level of subsidy a family receives depends on three factors:
- Income – A family’s (both partners) combined income. Families earning $66,958 or less will receive a subsidy of 85 per cent of the actual fee charged (up to 85 per cent of an hourly fee cap). For family incomes above $66,958, the subsidy gradually decreases to 20 per cent when family income reaches $341,248. For families with incomes of $351,248 or more, the subsidy is zero per cent.
- Activity test – Family entitlement to the Child Care Subsidy is determined by a three step activity test, more closely aligning the hours of subsidised care with the combined hours of work, training, study or other recognised activity undertaken, and providing for up to 100 hours of subsidy per fortnight. There are exemptions to the activity test for parents who legitimately cannot meet the activity requirements. Low income families on $66,958 or less a year who do not met the activity test are able to access 24 hours of subsidised care per fortnight without having to meet the activity test.
- Service type – There is an hourly rate cap for each hour of child care provided which differs depending on the type of approved child care service used for example Centre based day care, outside school hours care etc. For families earning more than $186,958, an annual subsidy cap of $10,190 per child applied.
Additional Child Care Subsidy (ACCS)
A supplementary payment was also introduced at the same time as the CCS, the Additional Child Care Subsidy (ACCS). The ACCS provides additional top up assistance in addition to the CCS for:
- children at risk of abuse or neglect
- families experiencing financial hardship
- families transitioning to work from income support
- grandparent carers on income support; and
- some low-income families.
Additional Subsidy is equal to 100 percent of the actual fee charged (up to 120 percent of the hourly rate cap), up to 100 hours of assistance per fortnight. The ACCS replaced a number of previous payments including Special Child Care Benefit, Grandparent Child Care Benefit and the Jobs, Education and Training Child Care Fee Assistance payment.
Estimates of Child Care Subsidy (CCS) are collected from the child care questions, however there has been a substantial gap between the reported number of households receiving child care subsidies and the total value of that assistance, compared to administrative records. CCS have been modelled to improve the accuracy of estimates of these payments. The output data is made up of both reported and modelled data.
Free child care
The Government announced an Early Childhood Education and Care Relief package which provides free child care for Australian families during the COVID-19 pandemic. The package was aimed to support services to remain open and to ensure that childhood education and care continues to be available to Australian families. From the 6th April 2020 and for the remainder of the 2019–20 financial year, any services that remained open, have children enrolled, and do not charge families fees, received a weekly payment from the Government instead of the usual Child Care Subsidy and Additional Child Care Subsidy payments.
During April 2020 some respondents may still have reported child care costs prior to the commencement of the relief package, as the child care questions in SIH refer to the usual patterns over the last 4 weeks. For SIH responses received in May and June 2020 it is expected that families will report no costs for formal child care arrangements. This assumption is reflected in the modelling of child care data.
Coherence with previous cycles and accuracy
Due to fundamental changes between previous child care payments (e.g. the Child Care Benefit and Child Care Rebate), a significant review of the child care questions within SIH and the child care model was undertaken for the SIH 2019–20 cycle. Previously reported and modelled child care payments are not directly comparable with reported and modelled Child Care Subsidy values.
Summary Indicators of Income and Wealth Distribution
Introduction
There are many ways to illustrate aspects of the distribution of income and wealth, and to measure the extent of inequality. In the Survey of Income and Housing (SIH), five main types of indicators are used - means and medians, frequency distributions, percentile ratios, income and wealth shares, and Gini coefficients. This part of the publication describes how these indicators are derived.
Analysis of both income and wealth provides the most complete understanding of how economic resources are distributed across the population.
Analysis of households and persons
There are two common ways of presenting analysis of households:
- number of households, or
- number of people in households.
In the former, each household contributes the same regardless of its size e.g. a four person household would have the same representation as a person living alone. These are called household weighted estimates.
To provide a better understanding of the circumstances of people it is often preferable to study people in households e.g. the number of people in Australian households experiencing economic hardship. In this analysis, each person is attributed with the characteristics of the household to which they belong e.g. household income is used to determine whether it is a low or high income household but analysis is about numbers of people experiencing hardship. This approach keeps the focus on individual circumstances while recognising that people share household resources. The main income measure used in SIH publications is equivalised disposable household income, while the main wealth measure is net wealth of household. When data is equivalised, the means and medians are person weighted. Most estimates that are not equivalised, are household weighted. The exception is in tables that refer to 'household characteristics of persons' or 'persons in households'. These estimates are person weighted.
Summary measures
Counts
Counts provide an estimate of the total number of people or households with a particular characteristic and are derived by summing the survey weights of each observation of interest. In sample surveys the weights enable extrapolation of the survey responses to official population estimates.
Means and medians
Mean (average) and median (the midpoint when all persons or households are ranked in ascending order) are simple indicators that can be used to show income and wealth differences between subgroups of the population.
Mean
The mean, or average, value of a data item is calculated by multiplying the value of the data item for the population of interest in each record by the weight of the record and summing the resultant products, and then dividing the total by the sum of the weights of the records. For example, the mean gross income of Queensland households is the weighted sum of the gross income of each such household divided by the sum of the weights relating to each such household.
Advantages of the mean are that it is easy to calculate and the means of all subcomponents sum to the mean of all observations. Its drawbacks are the effect of extreme values and asymmetry of the distribution, both of which are relevant for income and wealth data. For example, a small number of very wealthy and a large number of relatively poor households may have the same average income or wealth as a population where there is equal distribution of resources.
Median
Medians divide the population of interest into halves. To identify the median record, the population is first ranked in ascending order according to the data item of interest. Except for person weighted measures of household variables, the weights of the records are then accumulated until half the population is accrued. The record at which this occurs is the median record, and its value for the data item of interest is the median value. For person weighted measures of household variables, the household weights are multiplied by the number of persons in the household before accumulation.
Compared to the mean, the median is a more stable measure and is less affected by extreme values and sample fluctuations. However, median values of subcomponents do not sum to the median of all observations.
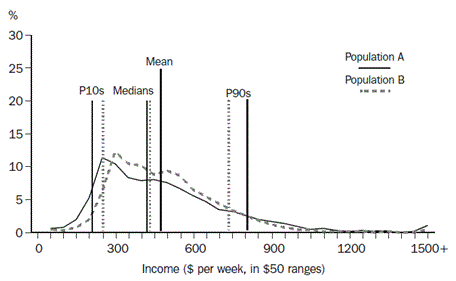
Frequency distribution
A frequency distribution illustrates the location and spread of income and wealth within a population. It groups the population into classes by size of household income or wealth, and gives the number or proportion of people in each income or wealth range. A graph of the frequency distribution is a good way to portray the essence of the income or wealth distribution. Graph 1 shows the proportion of people within $50 household income ranges.
- Equivalised Disposable Household Income, weekly
Annotation: Persons with an income between $50 and $2,800 are shown in $50 ranges on the graph
Sources: ABS Survey of Income and Housing, 2017–18, 2019–20
Frequency distributions can provide considerable detail about variations in the income or wealth of the population being described, but it is difficult to describe the differences between two frequency distributions. They are therefore often accompanied by other summary statistics, such as the mean and median. Taken together, the mean and median can provide an indication of the shape of the frequency distribution. As can be seen in the Graph 1, above, the distribution of income tends to be asymmetrical, with a small number of people having relatively high household incomes and a larger number of people having relatively lower household incomes. The greater the asymmetry, the greater will be the difference between the mean and the median. The small number of very high values raises the mean, while the median is not impacted by extreme values.
Quantile measures
When persons (or any other units) are ranked from the lowest to the highest on the basis of some characteristic such as their household income or wealth, they can then be divided into equally sized groups. The generic term for such groups is quantiles.
Quintiles, deciles and percentiles
When the population is divided into five equally sized groups, the quantiles are called quintiles. If there are 10 groups, they are deciles, and division into 100 groups gives percentiles. Thus the first quintile will comprise the first two deciles and the first 20 percentiles.
SIH publications frequently present data classified into income or wealth quintiles, supplemented by data relating to those with incomes in the 3rd to 20th percentiles of equivalised disposable household income, i.e. the lowest income quintile excluding the bottom two percentiles. The latter is included to enable quintile-style analysis to be carried out without undue impact from very low incomes which may not accurately reflect levels of economic wellbeing. Estimates for this population in the relevant data cubes are labelled 'Adjusted lowest income quintile'.
Equivalised disposable household income and equivalised net wealth of household are some of the measures used to define the income and wealth quantiles shown in SIH publications, and the quantiles each comprise the same number of persons, that is, they are person weighted.
Gross household income and net worth of household are other measures used to define the income and wealth quantiles in these publications, and the quantiles each comprise the same number of households, that is, they are household weighted.Gross household income and net worth of household are other measures used to define the income and wealth quantiles in these publications, and the quantiles each comprise the same number of households, that is, they are household weighted.
Upper values, medians and percentile ratios
In some analyses, the statistic of interest is the boundary between quantiles. This is usually expressed in terms of the upper value of a particular percentile. For example, the upper value of the first quintile is also the upper value of the twentieth percentile and is described as P20. The upper value of the ninth decile is P90. The median of a whole population is P50, the median of the third quintile is also P50, the median of the first quintile is P10, etc.
Percentile ratios summarise the relative distance between two points on the income or wealth distribution. To illustrate the full spread of the distribution, the percentile ratio needs to refer to points near the extremes of the distribution, for example, the P90/P10 ratio. The P80/P20 ratio better illustrates the magnitude of the range within which the income or wealth levels of the majority of the population fall. The P80/P50 and P50/P20 ratios focus on comparing the ends of the distribution with the midpoint (the median).
Income or wealth shares
Income or wealth shares can be calculated and compared for each income or wealth quintile (or any other subgrouping) of a population. The aggregate income of the units in each quintile is divided by the overall aggregate income of the entire population to derive income or wealth shares.
Gini coefficient
Taken together, the simple measures of income or wealth distribution such as mean, median, percentile ratios and income shares can provide an indication of changes in the income or wealth distribution of a population over time, or differences in the income or wealth distributions of two separate populations. However, none of the simple measures comprise a single statistic that summarises the whole income or wealth distribution in a way that directly considers and compares the individual income or wealth levels of all members of the population. In SIH publications, the Gini coefficient is used to compile a single statistic of inequality by summarising the distribution of income or wealth across the population.
Concept of inequality
It is generally agreed that perfect equality in the distribution of income or wealth can be defined as the situation in which everyone in the population lives in a household with the same equivalised disposable household income or net worth. If any person has lower or higher equivalised disposable household income than any other person, there is inequality in the income distribution, and the same definition applies to wealth inequality. However, there is no unique, generally accepted way of summarising the degree to which a population does not have perfect equality, or, more practically, summarising the difference in inequality between two populations.
Unequal distributions of income can occur in many different ways. The majority of people may have very similar incomes with pockets of very high or very low income. Wealth, due to the effect of accrual over the life course, is generally more unequally distributed, that is, more concentrated among older persons than younger persons. Or entire populations may be heavily clustered at the top and the bottom of the income distribution with few people receiving incomes in between these extremes. To evaluate one distribution as having greater or lesser inequality than another, it is necessary to compare the distributions in terms of which segments of the population have a greater share of income and which segments have a lower share. It is then necessary to at least implicitly judge whether the relative gains by some people is more than offset or less than offset by the relative losses of other people. Different observers may make different judgments about the same situation, depending on factors including personal preferences.
For example, consider the equivalised disposable household income of the two populations A and B depicted in Graph 2, 'Frequency Distributions'. Population A is derived from the 2000–01 SIH population, while population B covers the same people as in population A, but everyone's income is transformed to reduce the proportional differences in income across the population while retaining the same mean income for the population. Therefore fewer people are on very low or very high incomes and more people are between these extremes, with the median for population B closer to the mean, and less spread between P10 and P90.
Graph 2 - Frequency distributions
The extent to which the income distributions for populations A and B vary from equality, and from each other, can be illustrated graphically another way, using Lorenz curves.
Lorenz curves
The Lorenz curve is a graph with the horizontal axis showing the cumulative proportion of the persons in the population ranked according to their income and with the vertical axis showing the corresponding cumulative proportion of equivalised disposable household income. The graph then shows the income share of any selected cumulative proportion of the population. The diagonal line represents a situation of perfect equality, i.e., where all people have the same equivalised disposable household income. Graph 3 'Lorenz Curves' shows the Lorenz curves for the two populations described above.
Graph 3 - Lorenz curves
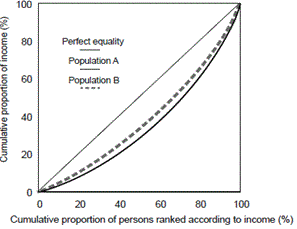
Since the distribution of population B's income is uniformly less widely spread than for population A, all points of the Lorenz curve for population B are closer to the line of perfect equality than the corresponding points of the Lorenz curve for population A. In this situation, population B is said to be in a position of Lorenz dominance and can be regarded as having a more equal income distribution than population A. However, if the Lorenz curves of two populations cross over there is no Lorenz dominance and there is no generally accepted way of defining which of the two populations has the more equal income distribution.
Gini coefficient
The Gini coefficient can best be described by reference to the Lorenz curve. It is defined as the ratio of the area between the actual Lorenz curve and the diagonal (or line of equality) and the total area under the diagonal. The Gini coefficient ranges between zero when all incomes are equal and one when one unit receives all the income, that is, the smaller the Gini coefficient the more even the distribution of income.
Normally the degree of inequality is greater for the whole population than for a subgroup within the population because subpopulations are usually more homogeneous than full populations. This is illustrated in Graph 4 below, which shows two Lorenz curves from the 2019–20 SIH. The Lorenz curve for the whole population of the SIH is further from the diagonal than the curve for persons living in one parent, one family households, with at least one dependent child. Correspondingly, the calculated Gini coefficient for all persons was 0.324 while the coefficient for the persons in the one parent households was 0.311.
- Equivalised Disposable Household Income
Source(s): Survey of Income and Housing 2019–20
Mathematically, the Gini coefficient can be expressed as:
\(G=\left(\frac{1}{2 n^{2} \mu}\right)\displaystyle\sum_{i=1}^{n}\sum_{j=1}^{n}\left|y_{i}-y_{j}\right|\)
where:
n is the number of people in the population
u is the mean equivalised disposable household income of all people in the population
and yi and yj are the equivalised disposable household income of the ith and jth persons in the population.
The Gini coefficient is a summary of the differences between each person in the population and every other person in the population. The differences are the absolute arithmetic differences, and therefore a difference of $x between two relatively high income people contributes as much to the index as a difference of $x between two relatively low income people.
An increase in the income of a person with income greater than median income will always lead to an increase in the coefficient, and a decrease in the income of a person with income lower than median income will also always lead to an increase in the coefficient. The extent of the increase will depend on the proportion of people that have income in the range between median income and the income of the person with the changed income, both before and after the change in income. At the extremes, increasing the income of the person with the lowest income by $x – or increasing the income of the person with the highest income by $x – will respectively decrease and increase the Gini coefficient by the same amount (assuming the lowest income person remains the lowest income person after the change).
The Gini coefficient is sometimes criticised as being too sensitive to relative changes around the middle of the income distribution. This sensitivity arises because the derivation of the Gini coefficient reflects the ranking of the population, and ranking is most likely to change at the densest part of the income distribution, which is likely to be around the middle of the distribution.
The Gini coefficient is the only single statistic summary of income distribution included in the SIH publications. The Gini is preferred over other summary measures because it is not overly sensitive to the very low income or wealth values that can be reported, and it is relatively simple to interpret.
Superannuation
Superannuation
The Survey of Income and Housing (SIH) collects a range of data about superannuation. This allows analysis of both the accumulation and the disbursements of superannuation by households and persons.
All superannuation information is collected at the person level. It can therefore be analysed by person or by household characteristics. For analysis of income and wealth accumulation it is usually most relevant to analyse the circumstances of the household.
Some information is also collected about the individual superannuation accounts people hold.
Personal income
Salary sacrifice superannuation arrangements of employees
This is a component of employee income and has been available since 2003–04. The relevant person level data item is:
- Current weekly employee income salary sacrificed for superannuation
Superannuation contributions paid to employees by their employer at a level that exceeds the minimum compulsory contributions
This is a component of employee income and has been available since 2003–04. The relevant person level data item is:
- Current weekly benefit from employer provided superannuation (above minimum - non salary sacrifice)
From 1 July 2002 to 30 June 2013, the superannuation guarantee rate was 9%, which then rose to 9.25% for the 2013–14 financial year, then to 9.5% as of 1 July 2014 and then remained at 9.5% as of 1 July 2015. However some individual workplace agreements or enterprise bargaining agreements provide for employer superannuation contributions that exceed these rates. Respondents may therefore interpret this question in different ways.
Regular income from superannuation, annuities or private pensions
This is a component of 'Other income' and is available for current income financial year income. It has been collected in all previous cycles of the SIH and its precursors. The relevant person level data items is:
- Current weekly income from superannuation/annuity/private pension
This is the only retirement income from superannuation, annuities and private pensions that contributes to estimates of current and previous financial year household and personal income. Irregular lump sum withdrawals are not included in this measure of income.
Superannuation funds
Balance in superannuation funds
This is a component of financial assets and has been available since 2003–04 in every SIH except for 2007–08, when wealth data was not collected. The relevant person level data item is:
- Balance of total superannuation accounts
Respondents were encouraged to refer to their last superannuation statement for fund balances.
Superannuation accounts
From 2013–14, information is available about the individual superannuation accounts people held. The complete list of data items for 2019–20 SIH are available from the 'Downloads' tab of this publication as an Excel spreadsheet, and super account items can be found under the 'Superannuation accounts' section on the 'Person' level. The different types of information are:
- income by type of pension or annuity
- total number of superannuation or retirement benefit scheme accounts
- number of retirement schemes currently paying regular income by type of pension and their balance
- number of retirement schemes currently paying no regular income and their balance
- oldest age will be receiving income from a term annuity
The 'Superannuation' analysis level is available for the 2013–14, 2015–16, 2017–18 and 2019–20 SIH outputs to provide similar data about individual superannuation accounts. This data can only be analysed as a paid customised data request.
Type of pension or annuity
For each superannuation account where current regular income is received, the type of account is collected. The different types of accounts are:
- Allocated pension – are accounts where a regular pension is paid by a superannuation fund. On death, the balance of these funds can be paid as a lump sum to a designated beneficiary, used to buy a further pension for a surviving spouse or continued as a reversionary pension. This category includes self-managed superannuation funds.
- Lifetime guaranteed pension – are pensions which are payable for the life of the member, or for the reversionary beneficiary’s life on the death of the member. Payments are made at least annually; they are a fixed amount and generally only varied by indexation. These are also sometimes called lifetime annuities.
- Term annuity – are fixed-term products that give people a guaranteed income for a specified term. Involves a series of payments purchased with a lump sum, usually from an insurance company.
- Transition to retirement scheme – under new transition to retirement rules introduced in 2016, if you have reached your preservation age, you may now be able to reduce your working hours without reducing your income. You can do this by topping up your part-time income with a regular ‘income stream’ from your super savings. Previously, you could only access your super once you turned 65 or retired.
- Other account type – includes any other type of pension or annuity.
'Other account type' descriptions provided by respondents were recoded where possible to the appropriate pension or annuity type. This method was improved for 2015–16 SIH and repeated for 2017–18 and 2019–20, reducing the overall instances of 'Other account type'. Therefore type of pension or annuity is not directly comparable to 2013–14 SIH estimates.
Lump sum superannuation payments
Value of lump sum superannuation payments
The value of lump sum superannuation payments received in the last two years that were in total worth $500 or more, has been collected since 2003–04. It enables analysis of how people are using their superannuation funds other than as a source of regular income. These payments do not contribute to current weekly estimates of personal or household income.
The relevant person level data item is:
- Personal irregular receipts from superannuation payments over last 2 years
Use of lump sum superannuation payments was not be collected in the 2019–20 SIH.
Imputed Rent
Concepts
Net imputed rent is estimated as gross imputed rent less housing costs. For owner-occupiers, the housing costs subtracted are those which would normally be paid by landlords i.e. general rates, water and sewerage rates, mortgage interest, building insurance, and repairs and maintenance. For households paying subsidised rent (e.g. tenants of an employer or of a state/territory housing authority) and households occupying their dwelling rent-free, the housing costs that are subtracted are largely made up of the reported rent paid, but also include other housing costs incurred, such as rates, which are also subtracted for some tenure types.
The availability of imputed rent estimates allows the analysis of household income to be extended to include the imputed rental incomes that flow to people living in homes owned by the occupant and those paying subsidised rent. Such imputations allow for more meaningful comparison of the income circumstances of people living in different tenure types, and to understand changes over time in income levels and the distribution of income when tenures may also be changing over time. Including imputed rent as part of household income and expenditure conceptually treats owner-occupiers as if they were renting their home from themselves, thus simultaneously incurring rental expenditure and earning rental income. Imputed rent is included in income on a net basis i.e. the imputed value of the services received less the value of the housing costs incurred by the household in their role as a landlord.
Methodologies
The ABS implemented new methodologies for household level estimates of gross imputed rent in the 2015–16 Survey of Income and Housing (SIH). These same methodologies were used in the 2017–18 and 2019–20 SIH.
Further information on the imputed rent methodologies used in the SIH and method used to calculate and apply base rental yields can be found in Estimates of Imputed Rent, 2015–16.
Sampling
Scope and coverage
Scope
The Survey of Income and Housing (SIH) collects information by personal interview from usual residents of private dwellings in urban and rural areas of Australia (excluding Very Remote areas), covering about 97% of the people living in Australia. Private dwellings are houses, flats, home units, caravans, garages, tents and other structures that were used as places of residence at the time of interview. Long-stay caravan parks are also included. These are distinct from non-private dwellings which include hotels, boarding schools, boarding houses and institutions. Residents of non-private dwellings are excluded.
Usual residents excludes:
- households that contain members of non-Australian defence forces stationed in Australia
- households that contain diplomatic personnel of overseas governments
- households in areas defined as Very Remote - this has only a minor impact on aggregate estimates, except in the Northern Territory where such households account for about 23% of the population.
For most states and territories, the exclusion of people in Very Remote areas has only a minor impact on any aggregate estimates that are produced because they constitute just a small proportion of the population. Very Remote and Remote areas are defined by the assignment of an Accessibility/Remoteness Index of Australia (ARIA) score. ARIA is a remoteness value (a continuous variable between 0 and 15) that measures the physical distance which separates people in a particular area and where their goods, services and opportunities for social interaction may be accessed.
The ARIA categories, and how ARIA scores are calculated, are further explained in the Australian Statistical Geography Standard (ASGS).
The 2019–20 SIH was carried out from July 2019 to June 2020. During this time, Australians were impacted by bushfires and COVID-19. The data collection design for this survey was optimised to meet operational objectives. As a result, the sample design and collection of 2019-20 SIH does not accurately reflect the household impacts of the bushfires nor COVID-19.
Coverage
Information was collected only from usual residents. Usual residents were residents who regarded the dwelling as their own or main home. Other people present were considered to be visitors and were not asked to participate in the survey.
Sample design and selection
Sample design
The SIH sample was designed to produce reliable estimates for broad aggregates of income, wealth, housing data for household residents in private dwellings of Australia, the State and Territories and for the capital cities and rest of state. More detailed estimates should be used with caution, especially for Tasmania, the Northern Territory and the Australian Capital Territory due to smaller samples in these localities. For more information see the 'Reliability of Estimates' section of this publication.
In 2019–20 dwellings were selected through a stratified, multistage cluster design from the private dwelling framework of the ABS Population Survey Master Sample. Selections were distributed across a twelve month enumeration period so that the survey results are representative of income patterns across the year.
The collection methodology for 2019–20 included the introduction of an online form (formally; computer assisted web interview, or CAWI), where the respondent could self report (without interviewer assistance). As a result, estimates may not be directly comparable to previous cycles. Please see the methodology page for more information.
SIH selected dwellings, sample loss and selected households
In the 2019–20 SIH, 23,552 dwellings were initially selected for the main sample. When fieldwork commenced some dwellings selected for inclusion in the main sample were found to be out of scope units. Collectively these are referred to as sample loss, and are composed of the following groups:
- dwellings that are out of scope of the survey, under construction, demolished, or converted to non-private dwellings or non-dwellings
- vacant private dwellings
- private dwellings that contain only visitors or out of scope residents (e.g. dwellings occupied by foreign diplomats and their dependants).
In 2019–20, the SIH sample loss was 3,458 dwellings which accounted for 17% of the selected sample.
Sometimes dwellings that have been selected for inclusion in a survey are found to comprise more than one actual dwelling because an additional residence, such as a 'granny flat', has been added to the original dwelling. In such cases, each actual dwelling becomes a separate household. For privacy reasons, residents of a selected dwelling can request that their details be provided separately from other dwelling residents. A separate household is then created for each group of residents. A separate household is then created for each group of residents. In 2019–20 SIH, 11 shared dwellings were split into separate households.
A further 4,580 dwellings (19%) did not respond at all to the questionnaire or did not respond adequately. Most of these were not able to take part in the survey during the collection period or were contacted but either refused to respond or were not able to respond adequately. Other reasons included:
- households affected by death or illness of a household member
- households which did not respond due to communication barriers or because they refused to participate.
This also included 68 households were excluded because the main income earners in the household did not adequately respond to questions about income sources and amounts.
Final SIH sample
Of the selected dwellings (19,263) that were contacted and in scope of the survey, 15,011 (78%) households were included as part of the final estimates.
| GREATER CAPITAL CITY | REST OF STATE | TOTAL | ||||
|---|---|---|---|---|---|---|
| Households no. | Persons(a) no. | Households no. | Persons(a) no. | Households no. | Persons(a) no. | |
| NSW | 2,134 | 4,612 | 973 | 1,788 | 3,107 | 6,400 |
| Vic. | 1,787 | 3,679 | 790 | 1,463 | 2,577 | 5,142 |
| Qld | 990 | 1,962 | 961 | 1,803 | 1,951 | 3,765 |
| SA | 1,272 | 2,439 | 1,077 | 1,901 | 2,349 | 4,340 |
| WA | 989 | 1,911 | 1,144 | 2,080 | 2,133 | 3,991 |
| Tas. | 658 | 1,240 | 640 | 1,131 | 1,298 | 2,371 |
| NT | 506 | 1,015 | 139 | 246 | 645 | 1,261 |
| ACT(b) | 951 | 1,853 | .. | .. | 951 | 1,853 |
| Aust. | 9,287 | 18,711 | 5,724 | 10,412 | 15,011 | 29,123 |
. . not applicable
(a) Number of persons aged 15 years and over
(b) Greater Capital City counts for the ACT relate to total ACT
Data Collection and Processing
Data collection
Interview procedures
Trained ABS interviewers were used to collect Survey of Income and Housing (SIH) from July 2019 to March 2020. They were given comprehensive training and were provided with detailed written instructions to complement the survey documents. Face-to-face interviewing was ceased early from March 2020 to June 2020 during the COVID-19 pandemic, the survey was collected online or via telephone interviewing only. There was no face-to-face interviewing conducted from late March 2020 due to COVID-19 restrictions
Information for each household was collected using:
- a household level computer assisted personal interview questionnaire or computer assisted web interview which collected information on household characteristics, housing costs, expenditure common to all household members (e.g. utility bills), and irregular or infrequent expenditure (e.g. household appliances and holidays overseas) and certain assets and liabilities for all households;
- an individual level computer assisted personal interview questionnaire or computer assisted web interview which collected information on income, certain assets and liabilities, and personal characteristics from each usual resident aged 15 years and over in all households.
For SIH interviews, the interviewer:
- made an initial contact visit, in which they obtained information on the numbers and characteristics of people usually resident in the dwelling. If a responsible adult was not available, the interviewer called back at another time. The interviewer also arranged a convenient time to call back to conduct the interviews;
- completed one household questionnaire for each household (information was provided by a household spokesperson who was nominated as the best person to provide information on the financial situation of the household);
- completed an individual questionnaire for each usual resident aged 15 years and over; and
- completed a proxy interview when the parent/guardian of children in the household aged 15–17 years, did not give permission for them to be personally interviewed, or when a person was incapable of answering on their own behalf.
- From 1 July 2019 to March 2020, respondents had an option of completing the survey via computer assisted web interview, face to face interview or telephone interview. During the COVID-19 pandemic, households had the option of either completing the survey online, or via a telephone interview. An invitation was made for selected households to participate online which included a letter in the post with instructions for completing the survey online. A few weeks were allowed for a household to respond online. Households that were unable to complete the survey online were able to complete the survey with an interviewer over the telephone. There was no face-to-face follow up for households that did not complete the survey.
Data items
For details of the data items available from the 2019–20 SIH see the Excel spreadsheet available as a data cube from the 'Data Downloads' section of this publication.
Data processing and derivations
Data processing methods
Computer based systems were used to collect and process the data from the 2019-20 SIH with a software program known as ConfirmIT. A variety of methods were employed to process and edit the data, reflecting the different questionnaires used to collect data from the household and individual components of the surveys. These processes are outlined below:
Coding and input editing of household and individual questionnaires
Internal system edits were applied in the CAI and CAWI questionnaires to ensure the completeness and consistency of the responses being provided. The interviewer/selected person could not proceed from one section of the interview to the next until responses had been appropriately completed.
A number of range and consistency edits were programmed into the CAI and CAWI questionnaire. Edit messages automatically appeared on the screen if the information entered was either outside the permitted range for a particular question, or contradicted information already recorded. These edit queries were resolved on the spot with respondents.
Data from the CAI questionnaires were electronically loaded to the processing database on receipt in the ABS office. Office checks were made to ensure data for all relevant questions were fully accounted for and that returns for each household and respondent were obtained. Problems identified by interviewers were resolved by office staff, where possible, based on other information contained in the schedule, or on the comments provided by interviewers.
Computer-assisted coding was performed on responses to questions on country of birth, occupation and industry of employment and language to ensure completeness. Data on relationships between household members were used to delineate families and income units within the household, and to classify households and income units by type.
Additional editing
A range of edits was also applied to the household and individual information to double check that logical sequences had been followed in the questionnaires; that specific values lay within expected ranges; and that relationships between items were consistent. Unusually high values (termed statistical outliers) were investigated to determine whether there had been errors in entering the data and corrections were made where necessary.
Imputation for missing records and values
Some households did not supply all the required information but supplied sufficient principal information to be retained in the sample. Such partial responses occur when:
- income or other data in a questionnaire are missing from one or more non-significant person's records because they are unable or unwilling to provide the data,
- all key questions are answered by the significant person(s) but other questions are not answered. Significant person(s) are the main income earners for the household (e.g. both parents in a couple family with children household, half of all persons in a group household, see glossary for further information)
In the two cases of partial response above, the data provided are retained and the missing data are imputed by replacing each missing value with a value reported by another person with similar characteristics, referred to as the 'donor'.
Donor records are randomly selected by finding fully responding persons with matching information on multiple characteristics, such as state, sex, age, labour force status and income, as the person with missing information. As far as possible, the imputed information is an appropriate proxy for the information that is missing. Depending on which values are to be imputed, donors are randomly chosen from the pool of individual records with complete information for the block of questions where the missing information occurs.
The final SIH sample includes 2,178 households (15% of households) and 11,421 person records (39% of persons aged 15 years or over) which had at least one imputed value.
Modelled items
Modelled data items
Some data items of interest cannot reliably be collected from respondents, and some cannot be collected at all. However, it is sometimes possible to utilise other information provided by respondents as a basis for estimating the data items of interest. This process is referred to as modelling.
Child Care
The Child Care Subsidy (CCS) is the main way in which the Australian Government helps families with child care fees. The CCS replaced two previous payments: the Child Care Benefit and the Child Care Rebate.
The level of CCS a family receives depends on three factors: family income, activity and the service type used. It is generally paid directly to care providers who pass the subsidy on to families through a fee reduction. Families therefore pay the difference between the provider’s fee and the subsidy amount. Families can receive CCS for a maximum of 50 hours per week.
Additional Child Care Subsidy
A supplementary payment was introduced at the same time as the CCS, the Additional Child Care Subsidy (ACCS). The ACCS provides top up assistance in addition to the CCS for children at risk of abuse or neglect, families experiencing financial hardship, families transitioning to work from income support, grandparent carers on income support. The ACCS is equal to 100 percent of the actual fee charged or up to 120 percent of the hourly rate cap, for up to 100 hours of assistance per fortnight. The ACCS replaced a number of previous payments including the Special Child Care Benefit, Grandparent Child Care Benefit and the Jobs, Education and Training Child Care Fee Assistance payment.
Estimates of Child Care Subsidy (CCS) are collected from the child care questions, historically there has been a substantial gap between the reported number of households receiving child care subsidies and the total value of that assistance, compared to administrative records. CCS has been modelled to improve the accuracy of estimates of these payments. The output data is made up of both reported and modelled data.
The modelled amounts of CCS is available at both the household and income unit level.
Income tax and the Medicare levy and levy surcharge
Disposable income is calculated by deducting income tax, including the Medicare levy, from gross income.
The model is based on the liability rules described in the Tax Pack from the Australian Tax Office for the year concerned, the income reported by respondents, and other characteristics of household members reported in the survey.
Estimates of income tax are modelled, rather than collected from respondents, for a number of reasons including:
- An accruals approach is taken to estimating these items. The estimates relate to the tax liability being incurred with respect to the income being reported by the respondent in the survey. For estimates of current income, the current income tax liability is calculated as though the current income is the average income for the whole year. If actual income fluctuates during the year, respondents are unlikely to have an actual income tax assessment that is relevant to the required estimate.
- In addition to income changes during the course of the year, full year income tax assessments may be affected by changes in family or other circumstances of the respondent which are not described in the survey, and are best ignored when deriving an income tax estimate to use with the other survey data.
- Income tax assessments are only made after the end of the financial year, and therefore are not yet available at the time that current income is collected from respondents.
- The income tax assessment of respondents may be affected by certain expenditures which they make, such as donations to charities or other particular circumstances which are not captured in the survey. For many purposes it is desirable to exclude the impact on tax liabilities of specific influences which are not captured in the survey.
- The SIH provides sufficient relevant information to allow a relatively comprehensive tax model to be constructed.
The Medicare levy surcharge were also modelled and deducted from gross income in the calculation of disposable income.
For more information see the 'Income' section of this publication.
Governments payment modelling
The eligibility-based modelling designed by the Department of Social Services (DSS) was introduced by the ABS in the 2015–16 SIH cycle. For the 2019–20 SIH, there were minor changes made to reflect policy and rate changes, and the types of payments available from DSS. Improvements to the accuracy of Family Tax Benefit were also included utilising the new (experimental) questions about children's living arrangement. Information about pension supplements was not asked of households, this information is entirely modelled.
Information about the model is available in Household Expenditure Survey and Survey of Income and Housing, User Guide, Australia - 2015-16.
Receipts of Family Tax Benefit are treated as income, regardless of whether they are received fortnightly or as a lump sum. The Newborn Supplement and Newborn Upfront Payment for those eligible receive it as part of their Family Tax Benefit Part A payments for a period of 13 weeks or with their lump sum. The Paid Parental Leave payment has also been included as income.
The Energy Supplement is included in income from government pensions or allowances. This tax-exempt, indexed payment is paid to pensioners, other income support recipients, families receiving Family Tax Benefit payments and Commonwealth Seniors Health Card holders, provided they meet eligibility requirements.
Government payments such as the $550 fortnightly, Coronavirus Supplement and the annual $750, Economic Support Payment were introduced to provide social assistance during the COVID-19 pandemic. Separate to this model, eligible Coronavirus Supplement recipients were allocated $275 per week to their total government payments from April 27 2020 onwards. Eligible Economic Support Payment recipients were allocated an annualised amount of approximately $14 per week to their total government payments. The JobKeeper payment is not considered a government payment nor allowance as it was paid to employers via the Australian Tax Office.
Weights
Benchmarks and weighting method
Weighting is the process of adjusting results from a sample survey to infer results for the total in scope population whether that be persons or households. To do this, a weight is allocated to each sample unit (e.g. a person or a household). The weight is a value which indicates how many population units are represented by the sample unit. The first step in calculating weights for each unit is to assign an initial weight, which is the inverse of the probability of being selected in the survey. For example, if the probability of a household being selected in the survey was 1 in 600, then the household would have an initial weight of 600 (that is, it represents 600 households).
The initial weights are then calibrated to align with independent estimates of the population of interest, referred to as benchmarks. Weights calibrated against population benchmarks ensure that the survey estimates conform to the independently estimated distribution of the population rather than to the distribution within the sample itself. The calibration also includes an adjustment to account for differences in the sample enumerated in each of the four quarters over the year. This is a change from previous cycles of SIH prior to 2015–16 where the quarter adjustment was made to initial weights rather than at the calibration step.
Most of the independent person and household benchmarks are based on demography estimates of numbers of persons and households in Australia. The benchmarks are adjusted to include persons and households residing in private dwellings only and to exclude persons living in very remote areas, and therefore do not, and are not intended to, match estimates of the Australian resident population published in other ABS publications. The demography estimates of persons (estimated resident population - ERP) and households used in SIH 2019–20 are built up from the 2016 Census.
SIH weighting
In the 2019–20 SIH, as in previous cycles since 2007–08, all persons in each household were assigned a weight. This differs from the 2005–06 SIH where children aged 0–14 years were not given separate weights, but household counts of the number of children were benchmarked to population totals.
The benchmarks used in the calibration of the final weights for the 2019–20 SIH were categorised into two groups
Number of persons:
- by state or territory by age by sex, in five-year age groups up to 80+ years for all states and territories (excluding NT and ACT)
- in five year age groups up to 70+ years for the ACT
- in five year age groups up to 65+ years for the NT
- by state or territory by labour force status ('Employed', 'Unemployed' and 'Not in the labour force') (except NT which does not use labour force status) by 2016 SEIFA Index for Relative Socioeconomic Disadvantage decile of household (state level).
Numbers of households:
- by household composition (number of adults (1, 2 or 3+) and whether or not the household contains children) (except NT which only uses whether or not the household contains children).
Estimation
Estimates produced from the SIH are usually in the form of averages (e.g. average weekly income of couple households with dependent children), or counts (e.g. total number of households that own their dwelling or total number of persons living in households that own their own dwelling). For counts of households, the estimate was obtained by summing the weights for the responding households in the required group (e.g. those owning their own dwelling). For counts of persons, the household weights were multiplied by the number of persons in the household before summing. The SIH collects data on the number of people, including children, in each household but separate records with income and other detailed data were only collected for people 15 years and older.
Average income values are obtained in two different ways, depending on whether mean gross household income or mean equivalised disposable household income is being derived. Estimates of mean gross household income are calculated on a household weighted basis. They are obtained by multiplying the gross income of each household by the weight of the household, summing across all households and then dividing by the estimated number of households. For example, the mean gross household income of couple households with dependent children is the weighted sum of the gross income of each such household divided by the estimated number of those households.
Estimates of mean equivalised disposable household income are calculated on a person weighted basis. They are obtained by multiplying the equivalised disposable income of each household by the number of people in the household (including children) and by the weight of the household, summing across all households and then dividing by the estimated number of people in the population group.
Averages are obtained by adding the weighted household values, and then dividing by the estimated number of households. For example, the mean gross income of Queensland households is the weighted sum of the gross income of each household divided by the sum of the weights relating to the total number of households within that state.
Reliability of Estimates
Sampling variability
The estimates provided from the Survey of Income and Housing (SIH) are subject to two types of error, non-sampling and sampling error.
Comparisons between estimates from surveys conducted in different periods, for example, comparison of 2019–20 SIH estimates with previous cycle estimates, are also subject to the impact of any changes made to the way the survey is conducted. For further details on changes between cycles see the 'Historical information' section of this publication.
Non-sampling error
Non-sampling error can occur in any collection, whether the estimates are derived from a sample or from a complete collection such as a census. Sources of non-sampling error include non-response, errors in reporting by respondents or recording of answers by interviewers and errors in coding and processing the data.
Non-sampling errors are difficult to quantify in any collection. However, every effort is made to reduce non-sampling error to a minimum by careful design and testing of the questionnaire, training of interviewers and data entry staff and editing and quality control procedures during data processing.
One of the main sources of non-sampling error is non-response by persons selected in the survey. Non-response occurs when people cannot or will not cooperate or cannot be contacted. Non-response can affect the reliability of results and can introduce a bias. The magnitude of any bias depends upon the level of non-response and the extent of the difference between the characteristics of those people who responded to the survey and those who did not.
The following methods were adopted to reduce the level and impact of non-response:
- Primary Approach Letters (PALs) were posted to selected SIH households prior to enumeration
- document cards were provided to respondents to suggest having financial statements and similar documents handy at the time of interview to assist with accurate responses
- official guide to complete the survey online
- face-to-face, online and telephone interviews with respondents
- the use of interviewers who could speak languages other than English, where necessary
- proxy interviews conducted when consent is given, with a responsible person answering on behalf of a respondent incapable of doing so themselves
- follow-up of respondents if there was initially no response
- imputation of missing values and
- ensuring that the weighted data is representative of the population (in terms of demographic characteristics) by aligning the estimates with population benchmarks.
Sampling error
The sampling error is a measure of the variability that occurs by chance because a sample, rather than the entire population, is surveyed. Since the estimates in this publication are based on information obtained from occupants of a sample of dwellings they are subject to sampling variability; that is, they may differ from the figures that would have been produced if all dwellings had been included in the survey. One measure of the likely difference is given by the standard error estimate (SE), which indicates the extent to which a sample estimate might have varied compared to the population parameter because only a sample of dwellings were included. There are about two chances in three that the sample estimate will differ by less than one SE from the population parameter that would have been obtained if all dwellings had been enumerated, and about 19 chances in 20 that the difference will be less than two SEs.
Another measure of the likely difference is the relative standard error (RSE), which is obtained by expressing the SE as a percentage of the estimate. The RSE is a useful measure in that it provides an immediate indication of the percentage errors likely to have occurred due to sampling, and thus avoids the need to refer also to the size of the estimate.
For estimates of population sizes, the size of the SE generally increases with the level of the estimate, so that the larger the estimate the larger the SE. However, the larger the sampling estimate the smaller the SE becomes in percentage terms. Thus, larger sample estimates will be relatively more reliable than smaller estimates.
Estimates with RSEs of 25% or more are not considered reliable for most purposes. Estimates with RSEs greater than 25% but less than or equal to 50% are annotated by an asterisk (*) to indicate they are subject to high SEs and should be used with caution. Estimates with RSEs of greater than 50%, annotated by a double asterisk (**) are considered too unreliable for general use and should only be used to aggregate with other estimates to provide derived estimates with RSEs of 50% or less.
RSEs for the SIH have been derived using the delete-a-group jackknife method. If needed, SEs can be calculated using the estimates and RSEs.
Measures of reliability
Proportions and percentages
Proportions and percentages, which are formed from the ratio of two estimates, are also subject to sampling errors. The size of the error depends on the accuracy of both the numerator and the denominator. For proportions where the denominator is an estimate of the number in a grouping and the numerator is the number in a subgroup of the denominator group, the formula for an approximate RSE is given by:
\(R S E \%\left(\frac{x}{y}\right)=\sqrt{[R S E \%(x)]^{2}-[R S E \%(y)]^{2}}\)
Differences between estimates
The difference between survey estimates is also subject to sampling variability. An approximate SE of the difference between two estimates (x–y) may be calculated by the formula:
\(S E(x-y)=\sqrt{[S E(x)]^{2}+[S E(y)]^{2}}\)
This approximation can generally be used whenever the estimates come from different samples, such as two estimates from different years or two estimates for two non-intersecting subpopulations in the one year. If the estimates come from two populations, one of which is a subpopulation of the other, the standard error is likely to be lower than that derived from this approximation.
Calculation of Margin of Error
Another useful measure is the Margin of Error (MoE), which describes the distance from the population value that the sample estimate is likely to be within, and is specified at a given level of confidence. Confidence levels typically used are 90%, 95% and 99%. For example, at the 95% confidence level the MOE indicates that there are about 19 chances in 20 that the estimate will differ by less than the specified MOE from the population value (the figure obtained if all dwellings had been enumerated). The 95% MOE is calculated as 1.96 multiplied by the SE.
A confidence interval expresses the sampling error as a range in which the population value is expected to lie at a given level of confidence. The confidence interval can easily be constructed from the MoE of the same level of confidence, by taking the estimate plus or minus the MoE of the estimate. In other terms, the 95% confidence interval is the estimate +/- MoE i.e. the range from minus 1.96 times the SE to the estimate plus 1.96 times the SE. The 95% MoE can also be calculated from the RSE by the following, where y is the value of the estimate:
\(M O E(y)=\frac{R S E(y) \times y}{100} \times 1.96\)
Note due to rounding, the SE calculated from the RSE may be slightly different to the SE calculated from the MoE for the same estimate. The SE of estimate using MoEs is calculated by:
\(S E \text { of estimate }=\left(\frac{M O E}{1.96}\right)\)
In the tables in this publication, MoEs are presented for the proportion estimates (%). Proportion estimates are preceded by a hash (e.g. #10.2) if the corresponding MoE is greater than 10 percentage points. An estimate is also preceded by a hash if the MoE is large enough such that the corresponding confidence interval for this estimate would exceed the value of 0% and/or 100%; the natural limits of a proportion. The latter situation will occur if the MoE is greater than the estimate itself, or greater than 100 minus the estimate. Users should give the margin of error particular consideration when using this estimate.
Significance testing
When comparing estimates between surveys or between populations within a survey, it is useful to determine whether apparent differences are 'real' differences between the corresponding population characteristics or simply the result of sampling variability between the survey samples. One way to examine this is to determine whether the difference between the estimates is statistically significant. This is done by calculating the standard error of the difference between two estimates (x and y), see the 'Differences between estimates' section above, and applying that to calculate the test statistic using the formula below:
\(\frac{|x-y|}{S E(x-y)}\)
If the value of this test statistic is greater than 1.96 (at the 95% confidence level) then there is good evidence of a statistically significant difference between the two population estimates with respect to that characteristic. Otherwise, it cannot be stated with confidence that there is a real difference between the population estimates.
Classifications and Standards
Classifications and Standards
The following classifications and standards have been utilised in the 2019–20 Survey of Income and Housing (SIH):
Geography
Data collected in the 2017–18 and 2019–20 SIH are based on the 2016 Australian Statistical Geography Standard (ASGS), while estimates for 2013–14 SIH and 2015–16 SIH and HES were based on the 2011 ASGS. Prior cycles are based on the Australian Standard Geographical Classification (ASGC). While the ASGS will give a better platform for the analysis of time series into the future, it will also create a break in time series at the sub-state level that were based on the ASGC.
The ASGS is the ABS' new geographical framework, which replaced the ASGC from July 2011.
The ASGS has been modified to extend beyond the Statistical Area Level 4 (SA4). The new ASGS structure is based on the Greater Capital City Statistical Areas (GCCSAs). GCCSAs have been designed to provide a stable and consistent boundary that reflects the functional extent of each of Australia's capital cities. GCCSAs have been created using aggregations of whole SA4s which were designed to reflect the labour market. Hence, GCCSAs are quite different from SA4s since they cover an area outside of the capital city district of each state and territory.
The ASGC provided a common framework of statistical geography which enabled the production of statistics that are comparable and can be spatially integrated. For more information refer to the publication Australian Standard Geographical Classification (ASGC) and the geography page on the ABS website.
Geography items output from the 2019–20 SIH include:
- Remoteness Areas 2016
- State or Territory of usual residence 2016
- Statistical Area Level 1 (SA1) 2016
- Statistical Area Level 4 (SA4) 2016
- Index of relative socio-economic disadvantage - decile - 2016
- Index of relative socio-economic disadvantage - decile -2016
- Index of relative socio-economic advantage/disadvantage - quintiles - 2016
- Greater Capital City Statistical Areas Code ASGS 2016
Country of birth
The Standard Australian Classification of Countries (SACC), 2016 is the Australian statistical standard for social statistics classified by country and is intended for use in the collection, storage and dissemination of all Australian social statistical data classified by country.
The identification of country units in the classification, and the way in which they are grouped, does not imply the expression of any opinion on the part of the ABS concerning the legal status of any country, territory, or area, or concerning the delimitation of its frontiers or boundaries.
The ABS uses the SACC and promotes its use by other government agencies, private organisations, community groups, and individuals, where appropriate.
For more information refer to the publication Standard Australian Classification of Countries.
Country of birth items output from the SIH include:
- Country of birth of HH reference person - 4 digit SACC
- Country of birth - 4 digit SACC
Education attainment
The Australian Standard Classification of Education (ASCED) is a statistical classification for use in the collection and analysis of data on educational activity and attainment. The ASCED includes all sectors of the Australian education system; that is, schools, Vocational Education and Training and Higher education. ASCED is comprised of two component classifications: 'Level of Education' and 'Field of Education'. It provides a basis for comparable administrative and statistical data on educational activities and attainment classified by level and field.
Information relating to the conceptual basis of ASCED, the structure of the classification, definitions for all categories of level and field and concordances with other education classifications can be found in the publication Australian Standard Classification of Education (ASCED), 2001.
The educational attainment items available from the SIH include:
- Level of highest educational attainment
- Main field of highest educational attainment - 6 digit ASCED
Australian and New Zealand Standard Industrial Classification (ANZSIC)
The ANZSIC has been jointly developed by the ABS and Statistics New Zealand (Statistics NZ). The ANZSIC provides a basis for the standardised collection, analysis and dissemination of economic data on an industry basis for Australia and New Zealand. Use of the ANZSIC results in improved comparability of industry statistics produced by the two countries.
As well as being the standard industrial classification that underpins ABS and Statistics NZ industry statistics, the ANZSIC is widely used by government agencies, industry organisations and researchers for various administrative, regulatory, taxation and research purposes throughout Australia and New Zealand. Industry of main job is output from the SIH at the 3 digit level.
For more information refer to the publication Australian and New Zealand Standard Industrial Classification (ANZSIC), 2006 (Revision 2.0).
Australian and New Zealand Standard Classification of Occupations (ANZSCO)
The ANZSCO was the product of a development program undertaken jointly by a project team from the ABS, Statistics New Zealand (Statistics NZ) and the Australian Government Department of Education, Employment and Workplace Relations for use in the collection, publication and analysis of occupation statistics. ANZSCO provides a basis for the standardised collection, analysis and dissemination of occupation data for Australia and New Zealand. The use of ANZSCO has resulted in improved comparability of occupation statistics produced by the two countries.
ANZSCO is intended to provide an integrated framework for storing, organising and reporting occupation-related information in both statistical and client-oriented applications, such as matching job seekers to job vacancies and providing career information. Occupation of main job is output from the SIH at the 6 digit level.
For more information refer to the publication ANZSCO–Australian and New Zealand Standard Classification of Occupations, 2013, Version 1.2.
Wealth classification
The Wealth Classification is based on the 'Organisation for Economic Co-operation and Development (OECD) Framework for Statistics on the Distribution of Household Income, Consumption and Wealth' and the 'OECD Guidelines for Micro Statistics on Household Wealth'. It categorises various assets and liabilities that comprise net worth of a household or person.
OECD Framework for Statistics on the Distribution of Household Income, Consumption and Wealth
An internationally agreed framework to support the joint analysis of micro-level statistics on household income, consumption and wealth. Its aim is to extend the existing international frameworks for measuring household income and consumption at the micro level to include wealth, and describes income, consumption and wealth as three separate but interrelated dimensions of people’s economic well-being. The framework, prepared by an international expert group working under the auspices of the OECD, is intended to assist national statistical offices and other data producers to develop data sets at the household level that are suitable for integrated analysis, and for facilitating comparisons between countries. The Framework is widely applicable, with relevance to countries that are at different stages of statistical development, that have different statistical infrastructures, and that operate in different economic and social environments.
For more information refer to the publication OECD Framework for Statistics on the Distribution of Household Income, Consumption and Wealth (2013).
OECD Guidelines for Micro Statistics on Household Wealth
An internationally agreed set of guidelines for producing micro statistics on household wealth. It addresses the common conceptual, definitional and practical problems that countries face in producing such statistics, and are meant to improve the comparability of the currently available country data. The Guidelines, prepared by an international expert group working under the auspices of the OECD, propose a set of standard concepts, definitions and classifications for micro wealth statistics, and cover different phases in the statistical production process, including sources and methods for measuring particular forms of wealth, best practice in using household surveys or other sources to compile wealth statistics, the development of analytic measures, the dissemination of data, and data quality assurance.
For more information refer to the publication OECD Guidelines for Micro Statistics on Household Wealth (2013).
Historical Information
Changes from previous surveys
A number of changes have been made to the Survey of Income and Housing (SIH) since it was first conducted. The changes were designed to improve the quality of the surveys, however, these may have an impact on the assessment of trends and indicators over time. This section outlines the main changes over time.
The final sample sizes for SIH cycles (from 1994–95) are shown in Table 1. The sample sizes can give an indication of the reliability of the estimates produced from the surveys.
| CAPITAL CITY no. | BALANCE OF STATE(a) no. | TOTAL no. | |
|---|---|---|---|
| 1994-1995 | 4,438 | 2,381 | 6,819 |
| 1995-1996 | 4,588 | 2,375 | 6,963 |
| 1996-1997 | 4,715 | 2,530 | 7,245 |
| 1997-1998 | 4,649 | 2,376 | 7,025 |
| 1999-2000 | 4,327 | 2,310 | 6,637 |
| 2000-2001 | 4,397 | 2,389 | 6,786 |
| 2002-2003 | 6,657 | 3,554 | 10,211 |
| 2003-2004 | 7,077 | 4,284 | 11,361 |
| 2005-2006 | 6,405 | 3,556 | 9,961 |
| 2007-2008 | 6,258 | 3,087 | 9,345 |
| 2009-2010 | 11,324 | 6,747 | 18,071 |
| 2011-2012 | 8,048 | 6,521 | 14,569 |
| 2013-2014 | (a)8,059 | (a)6,103 | 14,162 |
| 2015-2016 | (a)11,206 | (a)6,562 | 17,768 |
| 2017-2018 | (a)7,549 | (a)6,511 | 14,060 |
| 2019-2020 | (a)9,287 | (a)5,724 | 15,011 |
- Estimates from 1994-95 to 2011-12 use the Australian Standard Geographical Classification (ASGC). Estimates from 2013-14 to 2019-20 use the Australian Statistical Geography Standard (ASGS) and are not directly comparable with estimates for previous cycles.
To access information on the previous SIH cycles listed, see the 'Previous releases' section or the 'Historical information' section of this publication.
Features of the 2019–20 SIH collection
Changes in the 2019–20 SIH
- collection methodology for 2019–20 included the introduction of a computer assisted web interview (or online form) where the respondent could self report (without interviewer assistance). As a result, estimates may not be directly comparable to previous cycles. For more information, please see the Household Income and Wealth, Australia - Methodology, 2019-20
- a general review of the questions, populations and sequencing was undertaken to optimise survey content for online collection
- the Household Form was redesigned as part of the Integrated Household Surveys Program to produce common content across various household surveys
- cyclical housing content was collected this cycle, including changes in rent payments which was last collected in 2007–08
- the Child care module was largely restructured for online collection and to address payment changes. The Child Care Rebate (CCR) and Child Care Benefit (CCB) were no longer collected for children aged 12 and under. The Child Care Subsidy (CCS) replaces the CCR and CCB and is now collected for children aged 13 and under
- superannuation: use of lump sum payments is not collected
- financial stress indicators have been altered comparative to what was collected in HIES ($500 emergency funds, heat cool home, dental treatment). Additional content on financial behaviours and resilience have been included, in line with the General Social Survey
- Social transfers in kind (STIK) data is no longer collected in cyclical housing years
- changes in Government payments and allowances categories to reflect Department of Social Security reporting (such as Newstart allowance changed to JobSeeker allowance)
- family changes and smoking status modules were not collected for this cycle.
Features of the 2017–18 SIH collection
Changes in the 2017–18 SIH
The 2017–18 SIH content was largely similar to the 2015–16 SIH with some changes in questions, definitions and methodology. Key changes to the SIH in the 2017–18 cycle include:
- additional questions to have been asked to collect further information about the living arrangements of usual residents aged under 20 years of age who live in the household some of the time, but also spend time living with a parent/guardian elsewhere. Further to that questions have also been asked to determine the living arrangement of children (aged under 20 years) who spend time at the household but are not considered a usual resident.
- superannuation balances are no longer disseminated based on whether it is a government or non-government fund
- child care imputation was improved in the 2017–18 cycle
- credit card and HECS debt information is now collected at the person level and aggregated to the household level
- changes in Government payments and allowances categories to reflect Department of Social Security reporting (such as the removal of Baby Bonus, School Kids Allowance and Utilities Allowance)
- removal of question regarding supplement amount as it is now estimated by the eligibility-based model designed by the Department of Social Security (model introduced in 2015–16)
- previous financial year income is no longer collected, except for business income
- business income question wording was improved to ensure franking credits were excluded from responses
- module on smoking status was included (output as part of National Health Survey) will be available on the SIH CURF, Tablebuilder and detailed file in the DataLab
- Australian Statistical Geography Standard (ASGS) 2011 has been used for sample selection and weighting. Both ASGS 2011 and 2016 will be available on the outputs
- the expansion in the 2009–10 sample for an extra 4,200 households outside capital cities to provide more detailed analysis of housing affordability and home ownership measures was maintained in the 2017–18 SIH cycle
Changes relating to specific data items
Balance of other Superannuation account
In SIH 2017-18, an issue with the survey instrument occurred where the value of regular income received for other superannuation, annuities or private pension accounts was not asked. As a result, data for this item was modelled with a regression method using previous year's data where values were collected. For further information please refer to the 'Data Collection and Processing' chapter of this publication.
Features of the 2015–16 SIH and HES collection
Changes in the 2015–16 SIH
The 2015–16 SIH content was largely similar to the 2013–14 SIH with some changes in questions, definitions and methodology. Key changes to the SIH in the 2015–16 cycle include:
- the item identifying carers which was added in 2013–14 was not collected in 2015–16
- the processing of government payments information from the SIH and HES has been improved by the introduction of an eligibility-based model. Missing or anomalous government payments values are now produced by the model
- the cyclical additional housing content first collected in 2007–08 and again in 2013–14 has been removed for 2015–16
- there were changes to the methodology for imputed rent which are outlined further in the 'Imputed rent' chapter of this publication
- an index of service accessibility has been added to the survey data. The Metropolitan Accessibility/Remoteness Index of Australia (Metro ARIA) enables analysis of expenditure in relation to accessibility of services for metropolitan areas
- questions collected on solar energy usage that were collected in the Household Energy Consumption Survey in 2012 were collected in the 2015–16 SIH.
Changes to the survey sample for the SIH and HES
For the 2015–16 SIH and HES there was an additional sample of capital city households, targeting households whose main source of income was government pensions, benefits and/or allowances, this was last included in 2009–10 however changes were made to the screening and selection methodology for 2015–16. In this additional sample for 2015–16, dwellings were targeted using information from the previous HES (2009–10), and information from the Socio-Economic Indexes for Areas (SEIFA). Households were screened using a short questionnaire to identify whether pensions and benefits were likely to be the main source of income for the household. One in four households were selected to complete the combined SIH and HES questionnaire and diaries regardless of the screening outcome. Information from this sample were used to assess the outcomes from the screening questionnaire for the whole sub-sample. In 2015–16 the SIH and HES samples are not evenly balanced over the course of the year. Due to under-performance of the sample design in the first half of the collection year, a top-up sample was selected and collected from January – July 2016. Weights adjust by quarter to ensure representativeness across the year. For more information see the 'Sampling' chapter of this user guide.
Changes relating to specific data items
Hours usually worked in second job
In SIH and HES 2015–16, an isolated issue with the survey instrument occurred where respondents working more than one job were not asked to specify the hours they usually worked in their second jobs. As a result, data for hours usually worked in the second job had to be modelled. For further information please refer to the 'Data Collection and Processing' chapter of this publication.
Government pensions and allowances
The Newborn Supplement and Newborn Upfront Payment replaced the Baby Bonus on 1 March 2014 and those eligible receive it as part of their Family Tax Benefit (FTB) Part A payments for a period of 13 weeks or with their lump sum and are therefore not output separately.
The Seniors Supplement for Commonwealth Seniors Health Card (CSHC) holders was ceased and no longer paid beyond June 2015.
The microediting of income from government payments has been improved in terms of accuracy. The ABS has introduced an eligibility-based model designed by the Department of Social Services. This model produces a value for every person aged 15 years or over for all government payments and allowances that are collected in the survey. The modelled amount is then compared to the reported government payment values to identify and edit values that are significantly higher than the maximum amount eligible, to impute missing values and to impute values for payments which are consequential on the basis of reported payments (e.g. a value for Utilities Allowance is allocated to all recipients of Partner Allowance, even those who did not separately report it). All other government payments' values remain as reported. Some payment values are entirely modelled based on eligibility as in previous cycles of SIH. Microdata products (e.g. the Basic CURF) will include both the reported and modelled values for comparison (except where the reported payment values were out of the possible range or missing).
Features of the 2013–14 SIH collection
Changes in the 2013–14 SIH
The 2013–14 SIH content was largely similar to the 2011–12 SIH with some changes in questions, definitions and methodology. Key changes to the SIH in the 2013–14 cycle include:
- Australian Statistical Geography Standard (ASGS) 2011 has been used throughout the survey for sample selection, weighting and output. At the sub-state level, this required a break in the time series, with 2013–14 survey including Greater Capital City Statistical Area. Previous surveys used the Australian Standard Geographical Classification (ASGC)
- the expansion in the 2009–10 sample for an extra 4,200 households outside capital cities to support housing indicator reporting was maintained in the 2011–12 and 2013–14 cycles
- this cycle of SIH includes extra housing information last collected in 2007–08
- an item identifying carers has been added
- a new model of imputed rent has been designed and implemented, which will be available in an additional release
- data on the new Dad and Partner Pay Subsidy has been collected
- selected social transfers in kind variables have been modelled in 2013–14
- a decrease in fully responding sample size from 14,569 households in 2011–12 to 14,162 households in 2013–14 due to increased sample loss and slightly lower response rates
- additional information about lump sums drawn from superannuation
- franking credits were previously partly modelled and added to disposable income. For 2013-14, franking credits were modelled for all income from dividends and added to gross income
- inclusion of questions on disability status, concession cards held, educational institution attended and private health expenditure that were last collected in the 2009–10 HES.
Changes to the survey sample
The 2013–14 SIH sample design is similar to previous cycles of SIH with three main changes:
- Australian Statistical Geography Standard (ASGS) 2011 has been used for sample selection
- the introduction of a new master sample for all ABS Special Social Surveys
- change to the cluster fractions in each state by Part of State.
Integration of Income and Wealth publications
From 2013–14, the publication Household Income and Wealth, Australia, 2013–14 incorporates information previously presented as part of the Household Income and Income Distribution, Australia, 2011–12 and Household Wealth and Wealth Distribution, Australia, 2011–12 products. The publication presents key information about household income and wealth from the 2013–14 SIH. The primary benefit of integrating the Income and Wealth publications is to allow for income and wealth to be considered together when analysing household economic resources. This approach enables more accurate representation of household economic wellbeing.
Changes relating to specific data items
Geography
In 2011 the Australian Statistical Geography Standard (ASGS) was published to replace the former geography framework, the Australian Standard Geographical Classification (ASGC). The 2013–14 SIH data is presented on the current ASGS. Data from prior cycles uses the ASGC classification.
For further information on ASGS refer to the publication Australian Statistical Geography Standard (ASGS): Volume 1 - Main Structure and Greater Capital City Statistical Areas, July 2011 and http://www.abs.gov.au/geography.
Government pensions and allowances
Lump sum Government payments included in SIH 2013–14 are the Dad and Partner Pay, the Clean Energy Supplement (CES) and the School Kids Bonus.
Dad and Partner Pay is a new entitlement under the Paid Parental Leave Scheme paid directly to a working dad or partner who cares for a child born or adopted from 1 January 2013. Dad and Partner Pay gives you up to two weeks of government-funded pay at the rate of the National Minimum Wage. The Dad and Partner Pay can be taken all at once at any time in the first year after birth or adoption.
The Clean Energy Supplement (CES) replaced the Clean Energy Advance (CEA) from March 2013 and was captured for the 2013–14 SIH. The Clean Energy Supplement provided an increase on the standard Age Pension rate and was paid in addition to existing Pension Supplements.
The School Kids Bonus replaced the Education Tax Refund from January 2013 and was captured for the 2013–14 SIH. School Kids Bonus is made payable to families receiving Family Tax Benefit Part A, young people in school receiving Youth Allowance and some other income support and veterans payments who met age and education requirements.
Tax payable/Dividends
The collection of dividends was changed for this cycle. In previous cycles, respondents were asked to report their dividend income including the franking credit. In 2013–14, dividend income for publicly listed shares was collected excluding franking credits. These were imputed and added to total dividend income using the most recent ATO data on the proportion of franked and unfranked dividends. Previously an adjustment for the under-reporting of franking credits was applied to the income tax model so that while gross income from dividends was understated, disposable income was not affected.
Features of the 2011–12 SIH collection
Changes in the 2011–12 SIH
The 2011–12 SIH content was largely similar to the 2009–10 SIH with some changes in questions, definitions and methodology. Key changes to the 2011–12 SIH include:
- a decrease in fully responding sample size from 18,071 households in 2009–10 to 14,569 households in 2011–12. The expansion in the 2009–10 sample for an extra 4,200 households outside capital cities to support housing indicator reporting was maintained. The additional sample of metropolitan households whose main source of income was a government pension, benefit and/or allowance included in the 2009–10 SIH and HES samples to improve analysis for the Pensioner and Beneficiary Living Cost Index was not maintained
- an additional benchmark for the value of government benefit cash transfers used in 2009–10 was not required in 2011–12
- disability questions for persons aged 15 years and over were not asked in 2011–12, but will be collected in 2013–14
- Child Care Rebate (CCR) and Child Care Benefit (CCB) have been modelled to improve estimates of both the payment amounts and the number of households receiving assistance
- the value of offset accounts was collected separately for the first time
- selected social transfers in kind variables have been modelled in 2011–12, and analysis included in the publication Household Income and Income Distribution, Australia, 2011–12
- a feature article on Low Economic Resource households is included in the publication Household Income and Income Distribution, Australia, 2011–12.
Changes to the survey sample
The expansion in the 2009–10 sample for an extra 4,200 households was maintained in the 2011–12 SIH. This additional sample of households outside capital cities better supports Council of Australian Governments (COAG) performance indicator reporting, particularly in regard to housing affordability and home ownership measures required under COAG intergovernmental agreements.
The additional sample of metropolitan households whose main source of income was a government pension, benefit and/or allowance included in the 2009–10 SIH and HES samples has not been maintained in the 2011–12 sample. The main purpose of this additional sample was to support improved analysis for the Pensioner and Beneficiary Living Cost Index (PBLCI).
Changes to Government pensions and allowances
Paid Parental Leave (PPL) was introduced on 1 January 2011 as an alternative to the Baby Bonus. Under the Paid Parental Leave scheme, eligible working parents can get government funded pay when they take time off from work to care for a newborn or recently adopted child. The income test for PPL requires that the parent or parents earn no more than $150,000 in the year previous to the child's birth. People who meet the eligibility requirements must decide which payment, paid parental leave or Baby Bonus, is best suited to them, as both payments cannot be received for the same child.
One off Government payments included in SIH 2011–12 are the Clean Energy Advance and the one-off Education tax refund.
The Clean Energy Advance payment is a tax-exempt lump sum payment, paid in May and June 2012 to help low and middle income households meet the impacts of carbon pricing on living expenses for up to 12 months. This is a one-off payment paid to pensioners, other income support recipients, families receiving Family Tax Benefit payments and Seniors Supplement recipients, provided they met eligibility requirements.
One-off Education Tax Refund payments were paid in June 2012 as part of the transition to the new School kids Bonus and in place of the Education Tax Refund for the 2011–12 financial year. The one-off payment was made payable to families receiving Family Tax Benefit Part A, plus young people in school receiving Youth Allowance and some other income support and veterans payments, providing they met age and education requirements. The Schoolkids Bonus replaces the Education Tax Refund from January 2013.
Other changes
Errors in processing the 2009–10 income data have been corrected, resulting in an average decrease of $1 for mean equivalised disposable household income across all households. This was reflected largely in a decrease of 0.04% in the mean equivalised disposable household income of households in the second and third deciles. The income estimates for 2009–10 shown in this publication have been revised. The second edition of the 2009–10 CURF includes the revised estimates.
Features of the 2009–10 SIH and HES collection
Changes in the 2009–10 SIH
The 2009–10 SIH content was largely similar to the 2007–08 SIH with some changes in questions, definitions and methodology. Key changes to the collection include:
- an increase in the sample size from 9,345 households in 2007–08 to 18,071 households in 2009–10 due to a 10,800 base sample, an expansion in the SIH sample for an extra 4,200 households, located outside capital cities as well as an additional sample of metropolitan households whose main source of income was a government pension, benefit and/or allowance
- the inclusion of a benchmark for the value of government benefit cash transfers to ensure that the survey estimate of government benefit cash transfers is maintained at a proportion of aggregate benefit cash transfers that is consistent with previous SIH cycles (this benchmark was last used in the 2000–01 SIH)
- housing data on dwelling condition, characteristics, mobility, finance and rental arrangements collected in 2007–08 were not collected in 2009–10
- wealth data items on assets and liabilities were collected in 2009–10 (last collected in 2005–06 SIH)
- disability questions were asked for persons aged 15 years and over in the 2009–10 SIH
- improvements, aligning with international statistical standards, to the collection of income statistics including to:
- incorporate non-cash benefits provided to employees;
- incorporate termination payments and lump sum workers' compensation payments; and
- improve the coverage of bonuses and irregular overtime payments and inter-household transfers. For more information see Appendix 4 of Household Income and Income Distribution, Australia, 2007–08.
- improvements to the collection of the value of assets in public unit trusts and private trusts.
Changes in the 2009–10 HES
The 2009–10 HES content was largely similar to the 2003–04 HES with some changes in questions, definitions and methodology. Key changes to the collection include:
- an increase in the sample size from 6,957 households in 2003–04 to 9,774 households in 2009–10 due to the inclusion of an additional sample of metropolitan households whose main source of income was a government pension, benefit and/or allowance
- improvements, aligning with international statistical standards to the collection of income statistics
- the incorporation of non-cash benefits used by employees to improve the coverage of consumption expenditure and to ensure consistency with the conceptual treatment of income
- a small number of changes to some Household Expenditure Classification (HEC) categories, particularly to address emerging technologies between the survey cycles. For details see Appendix 6 of the Household Expenditure Survey and Survey of Income and Housing, User Guide, Australia, 2009-10 User Guide (cat. no. 6503.0).
- disability questions for persons aged 15 and over were asked in the 2009–10 HES (last collected in HES in 1998–99)
- the inclusion of expenditure classified by the Classification of Individual Consumption According to Purpose (COICOP) for the first time.
Changes to the survey sample for the SIH and HES
The May 2009 Budget funded an expansion in the SIH sample for an extra 4,200 households, primarily located outside capital cities. This expansion was to better support Council of Australian Governments (COAG) performance indicator reporting, particularly in regard to housing affordability and home ownership measures required under COAG intergovernmental agreements.
For the 2009–10 SIH and HES there was also an additional sample of metropolitan households whose main source of income was a government pension, benefit and/or allowance. These pensioner sample households were enumerated using a separate sample design, but the fully responding in scope households from this sample were included in the final SIH samples.
Changes relating to specific data items
In addition to the changes already listed for 2009–10, there were also a number of changes that related to specific data items.
Income measures
In 2007–08, the ABS revised its standards for household income statistics following the adoption of new international standards in 2004 and review of aspects of the collection and dissemination of income data. The 2007–08 and 2009–10 income estimates for the SIH and the HES apply the new income standards. Information about ABS' improved household income measures, is available in Part 4.2 'Changes in the 2007–08 SIH User guide' (cat. no. 6553.0).
As these standards have now been implemented for more than the 2007–08 cycle in which they were introduced, current income items have had some label changes.
- In 2007–08, they were labelled as '2007–08 basis' items to be clearly identified from '2005–06 basis' and earlier items used prior to the introduction of the new standards. From 2009–10, all income items using the current income standard now have no qualifier in the label, as they no longer apply to a specific survey cycle. For example, the item 'Total current weekly income from all sources (2007–08 basis)' is now 'Total current weekly income from all sources'.
- Income items about the 'Principal source of income' are now labelled 'Main source of income', consistent with the new standards.
Other Changes
There have been changes to some pensions and allowances paid by the government, resulting in both the deletion of items and the addition of new items. This is consistent with previous cycles, where changes to government pensions and allowances made since the last survey cycle are implemented. In the 2009–10 SIH, particular changes in government pensions and allowances resulted in new modelled items and changes in populations. The introduction of the Pension Supplement and the Seniors Supplement on 20 September 2009 was a significant change, and occurred while the 2009–10 SIH was in the field. As a result, the Pension Supplement and Seniors Supplement were modelled from data collected from respondents based on their reported payments and eligibility. The Utilities Allowance now forms part of these supplements for some recipients, but is still paid separately to recipients of some pension and allowance recipients. As a result, comparisons with data from 2007–08 and earlier are not possible for affected items, as eligible populations have changed in addition to payment types.
Errors in processing the 2007–08 income estimates have been corrected, resulting in an average increase of $3 for mean equivalised disposable household income across all households. This was reflected largely in a 1.3% increase in the mean equivalised disposable household income of households in the highest quintile. The income estimates for 2007–08 shown in this publication have been revised.
Features of the 2007–08 SIH collection
Changes in the 2007–08 SIH
The 2007–08 SIH was largely similar to the 2005–06 SIH, but there were some changes in topics, definitions and methodology. The main changes that could impact on all data items were:
- the final sample size of the SIH, which decreased from 9,961 in 2005–06 to 9,345 in 2007–08
- benchmarks based on the 2006 Census were used for the 2007–08 SIH; in 2005–06 benchmarks were based on the 2001 Census
- more detailed age benchmarks were used when determining the weights to be allocated to each unit in 2007–08 estimates
- the imputation procedures were changed: in 2007–08, as in 2003–04, all households where one or more people did not respond were imputed if the non–responding person was not a 'significant' person; in 2005–06, all households where one or more people did not respond were treated as non-responding.
Changes relating to specific data items
There were also a number of changes that related to specific data items.
Improvements to income measures
The ABS undertook a major review of its income standards, to ensure that its standards and practices appropriately reflected new international standards for household income statistics (promulgated in 2004) and suitably addressed a range of outstanding methodological and collection issues. The 2007–08 SIH income estimates were the first to apply the changes.
The income measures used in the 2007–08 SIH included changes to employment income, investment income, lump sum payments and financial support. Specific changes in the income measures used in the 2007–08 survey were:
- Employment income included all payments received by individuals as a result of their current or former involvement in paid employment. In addition to the regular and recurring cash receipts previously included, the new income measures also included non-cash benefits, bonuses, termination payments and payments for irregular overtime.
- Interest paid on money borrowed to purchase shares or units in trusts was netted off income earned from these sources when deriving income estimates.
- Income earned as a silent partner in a partnership and some private trust income was classified to investment income rather than unincorporated business income. This change did not affect trust income resulting from the recipient working in their own business, which continued to be classified as unincorporated business income. The questions developed to effect this change also improved the reporting of income from these sources.
- Lump sum workers' compensation receipts were included.
- A wider range of data on financial support received from family members resident outside the household was included. In addition to regular payments previously collected, financial support was extended to include other forms of financial support, including goods and services received which were purchased by others, e.g. rent, education, food, clothing, car registration and utilities. Capital transfers, such as the purchase of property or cars, were excluded.
Some limits were placed on the new inclusions where the magnitude of the individual amounts received exceed that likely to be used to support current consumption, e.g. termination payments and workers' compensation payments. For more information see 'Appendix 4 Improvements to income statistics' of the publication Information Paper: Survey of Income and Housing, User Guide, Australia, 2007–08 for more information on the changes to income measures.
Inclusion of child care data
There were additional questions on the use of child care, including preschool for a selected child, covering: type; time used; costs; and Child Care Benefit (CCB) received. In addition there were new data items on barriers to labour force participation due to child care related reasons. For more information see 'Part 1 Concepts and definitions' of the publication Information Paper: Survey of Income and Housing, User Guide, Australia, 2007–08.
Inclusion of additional housing data
The 2007–08 SIH included additional housing topics to enable reporting on the broader housing circumstances of non-Indigenous Australians. The ABS will collect additional information on housing in the SIH every six years. For the 2007–08 SIH, housing topics included housing mobility, housing condition and dwelling characteristics, home purchase for first home buyers, household finances of owners with a mortgage, rental arrangements and the affairs of renters, and neighbourhood. For more information see 'Appendix 6 Additional housing topics, 2007–08' of the publication Information Paper: Survey of Income and Housing, User Guide, Australia, 2007–08.
Inclusion of data on ethnicity
There were additional questions relating to country of birth of each parent, first language spoken, main language spoken at home, and proficiency in spoken English.
Changes to financial support received from or provided to family members not in the household
In the 2007–08 SIH, a wider range of data on financial support received from and paid to family members resident outside the household was collected. Previously these were mainly limited to regular payments for spousal maintenance and child support. In 2007–08, respondents were asked to include other forms of financial support, including goods and services received which were purchased by others, e.g. rent, education, food, clothing, car registration and utilities. Capital transfers, such as for the purchase of property or cars, were excluded.
Inclusion of data on tenure type for income units and persons
The 2007–08 SIH collected information on the tenure and landlord type for income units and persons. New data items were included at the person level relating to tenure, landlord type and weekly rent payments. New data items were also included at the income unit level relating to tenure and landlord type. The information was previously available from the 2002–03 SIH.
Improvement in selection of household reference person
Improvements were made in the way the household reference person was identified in the 2007–08 SIH. In the 2005–06 SIH, the household reference person was identified by applying selection criteria about relationships, income and age. However, this method did not always identify the correct reference person, particularly for some group households (where one person may be the owner and other unrelated individuals are also living in the dwelling) or first home buyers (where the first home buyer may not be selected as the household reference person based simply on relationship income and age). In the 2007–08 SIH, tenure was added as a criterion in determining the household reference person. For more detailed information about the selection criteria used to identify the household reference person see the 'Glossary' section of this publication.
Commonwealth Rent Assistance (CRA)
New data items were included at the income unit and person levels relating to the receipt of CRA and the amount received. CRA is a non-taxable income supplement paid through Centrelink to individuals and families who rent in the private rental market. It is only paid to recipients of another government benefit or pension, and is paid in conjunction with that other payment. Reported amounts of CRA were added to the relevant reported benefit or pension during processing where it was identified that the amount had not been included.
Loans level data
The 2005–06 SIH CURFs contained housing cost data items at the household level relating to the amounts owing on mortgages and unsecured loans for housing and other purposes. The 2007–08 SIH CURFs also contained those data items, but also included a new loans level that contained data items relating to each reported loan belonging to a household.
Other changes
Some changes were implemented within the derivation process to correct errors detected when calculating the disposable income for some households in receipt of tax offsets. Estimates for the 2005–06 SIH were updated and reflected in the 2007–08 publication.
Features of the 2005–06 SIH collection
Changes in the 2005–06 SIH
The 2005–06 SIH was largely similar to the 2003–04 SIH, but there were some changes in topics, definitions and methodology. The main changes that could impact on all data items were:
- the 2003–04 SIH was integrated with the HES whereas the 2005–06 survey was run as a stand-alone survey
- the final sample size decreased from 11,361 household in 2003–04 to 9,961 in 2005–06
- the scope of the survey was changed slightly. In the 2003–04 SIH, all people living in Indigenous communities were out of scope; in the 2005–06 SIH they were out of scope only if they were living in Very Remote areas
- the benchmarks used were based on the 2001 Census, and these benchmarks were consistent with the scope of the survey in that people living in Very Remote areas in all states and territories were excluded. In the 2003–04 SIH, the benchmarks used were based on the 1996 Census and did not exclude people living in Very Remote areas, except in the Northern Territory where people living in areas defined as sparse were excluded
- more detailed age benchmarks were used when determining the weights to be allocated to each unit in the 2005–06 SIH estimates
- imputation procedures were changed - all households where one or more people did not respond were treated as non-responding; in the 2003–04 SIH these were imputed if the non-responding person was not a 'significant' person.
Changes relating to specific data items
There were also a number of changes that related to specific data items.
Inclusion of all salary sacrificed income
In the published output from the 2005–06 SIH, all amounts salary sacrificed were included in wages and salary estimates. In output from previous surveys, estimates included only some salary sacrificed amounts. The 2003–04 SIH estimates published in the 2005–06 issue of Household Income and Income Distribution, Australia, 2005–06 were revised to include additional salary sacrificed amounts. The changed treatment of salary sacrifice did not impact significantly on the estimates. In the 2005–06 SIH the Gini coefficient calculated on the new basis was 0.307, compared with 0.304 when compiled on the former basis. Including all salary sacrifice in the income estimates for the 2005–06 SIH added 0.003 points to the Gini coefficient and $5 (0.8%) to mean weekly equivalised disposable household income.
Improvements to Family Tax Benefit (FTB) estimates
Improvements were made to estimates relating to current income from the FTB. Prior to the 2005–06 SIH, the FTB item only included FTB received as fortnightly payments. FTB paid through the tax system or as a lump sum was excluded for practical reasons. The items 'Total current weekly income from government pensions and allowances' and 'Total income from all sources' also excluded these components, but they were included in measures of disposable income. In the 2005–06 SIH the new FTB item 'Current weekly income from family tax benefits (modelled)' included all FTB payments, regardless of whether they were received fortnightly, via the tax system or as a lump sum. It also included payments of FTB supplement. Some components of the FTB item used in the 2005–06 SIH were modelled using information on income and household demographics reported in the survey. All income aggregates included the new item. It should be noted that there was little impact on comparability of estimates of disposable income as a result of the change, since disposable income has always included modelled components relating to FTB paid through the tax system or as a lump sum.
Housing costs definition
The housing costs measure used in the 2005–06 issue of Housing Occupancy and Costs, Australia, 2005–06 was slightly different from the measure used in prior issues. In prior issues housing costs comprised: rates payments for owners; rates and housing loan payments for owners with a mortgage; and rent payments for renters. In 2005–06, information on housing costs for other tenure types, which was first collected in the 2003–04 survey, was included. The definition of housing costs was no longer dependent on tenure: it was defined as the sum of rent payments; rates payments; and mortgage or unsecured loan payments if the initial purpose was primarily to buy, add to, or alter the dwelling. The revised definition added only about $1 (less than 1%) to mean weekly housing costs.
Other changes
There were changes to some pensions and allowances paid by the government, resulting in new items for maternity payment, utilities allowance, seniors concession allowance and one-off payments to older Australians.
A number of changes were made to the derivation process used to estimate income tax liability. In prior surveys estimates of imputed tax payable included an adjustment to subtract estimated FTB payments made through the tax system or as a lump sum. This ensured that FTB payments made through the tax system or as a lump sum were included in disposable income. This adjustment was no longer required since such payments were included in the gross income estimates in 2005–06.
Features of the 2003–04 SIH and HES collection
Integration of HES and SIH
The 2003–04 SIH was integrated with the 2003–04 HES. This integration was achieved by selecting a subsample of the households in the SIH survey and asking them the additional questions required for HES purposes. The HES subsample comprised 6,957 of the 11,361 households responding to the SIH. The main advantages of integrating the surveys were:
- respondent burden is lower
- the data collection costs are lower
- the resultant dataset is a richer suite of data because HES and SIH results are more comparable than data obtained prior to 2003–04.
However, in order to achieve this integration, some changes were required to both surveys which impact on comparability with previous surveys. In addition, it is possible that the integration of the surveys affected the non-response bias in the SIH. The response rates for the HES subsample are lower than achieved in the SIH-only sample component because of the reluctance of some respondents to provide the extra information required in the HES part of the survey. The non respondents to the 2003–04 survey may therefore have different characteristics to the non respondents of previous SIHs, resulting in different non-response bias.
Data items removed
A few data items collected in previous surveys were not collected in the 2003–04 SIH. These include:
- income unit level tenure – in 2003–04 tenure was available at the household level only
- labour force status in each of the 7 months prior to the interview
- full-time/part-time status in each of the 7 months prior to the interview
- month left school.
Changes in concepts, definitions and classifications
In previous SIHs, the household reference person was chosen from an income unit within the household that had the highest tenure type. Tenure type was collected for households but not for income units in the 2003–04 SIH. The tenure type of income units was therefore not used in determining which person in the household is to be designated as household reference person.
In the published output from the surveys, the data item "family composition of household" replaced the item "household composition". The new item better met user requirements for the treatment of households with dependent children.
Changes to survey methodology
There were a number of changes to the survey methodology introduced in 2003–04. Some of these were a consequence of the integration of the SIH and HES.
The main changes which could impact on all data items were:
- previous SIH cycles had selected dwellings from those that had been respondents for eight months in the Monthly Population Survey (MPS), whereas in 2003–04 the SIH sample was drawn from dwellings not recently included in an ABS household survey (possible change in response bias)
- the sample size of the SIH was increased from 10,211 households (comprising 19,400 persons aged 15 and over) in 2002–03 to 11,361 households (comprising 22,315 persons aged 15 and over) in 2003–04 (lower sample error)
- interviewer use of a laptop computer (this may have improved data capture)
- editing and imputation procedures were changed - in particular because the SIH sample was no longer drawn from households who had participated in the MPS, responses given in the MPS were no longer available as a basis for imputation.
Changes to specific data items
The changes in survey methodology relating to specific data items were:
- current income from own unincorporated business and investments was measured using respondents' estimates of expected income in the current financial year, whereas previously these data items were estimated based only on information about reported income for the previous financial year - this change had a significant impact on the coverage of such income streams in current income measures
- the collection of details about the assets and liabilities of the household may have improved the quality of reporting of associated income streams
- the instrument wording was changed to explicitly ask that reported dividends include the value of imputation credits - previously this direction was only included in interviewer instructions
- information relating to some household loans was collected using a different methodology - for those loan accounts that have a redraw facility and have regular income (such as wages) deposited into them, respondents were not asked to provide a 'usual repayment' - instead they were asked to provide the amount that the principal outstanding usually decreases by, in a 6 month period, and this was used in conjunction with information collected on interest to derive a repayment amount
- details of previous financial year income were collected from all persons - in previous SIHs this information was not collected from people who had only arrived in Australia in the current financial year
- details of hours worked were collected from all employed persons - in previous SIHs, this information was only available for employees
- unlike previous SIHs, data on repayments and principal outstanding on mortgages for other purposes (i.e. for purposes other than building, buying, altering or adding to the selected dwelling) excludes mortgages that were used for business or investment purposes.
Features of earlier collections
Changes in earlier surveys
The SIH cycles from 1994–95 to 2002–03 are comparable. These files were reprocessed in 2003 to apply consistent demographic benchmarks to all years and to incorporate the latest demographic estimates in the benchmarks. Changes over this period are generally minor and are summarised below:
- the sample size was fairly constant at about 7,000 households from 1994–95 to 2000–01, but increased to 10,211 in 2002–03
- an extra benchmark was used in the weighting process in 1999–2000 and 2000–01 to compensate for an apparent fall in the coverage of government benefit payments in those years
- any changes to government pensions and allowances were incorporated
- the introduction of new standards, (e.g. the introduction of the Australian Standard Classification of Occupations (ASCO), Second Edition, 1997 in the 1996–97 SIH).
In addition, the item, 'Nature of occupancy ' was replaced by 'Tenure type' from 1995–96. Prior to 1995–96 owner occupiers were classified as either owners or purchasers. A purchaser had a mortgage or loan secured against the dwelling, and the loan was used to purchase or build the dwelling. An owner had no loan secured against the dwelling for the purpose of building or purchasing. From 1995–96, owner occupiers were classified as owners without a mortgage and owners with a mortgage. This change to the classification was made to reflect the increasing diversity in financial instruments, in particular the increasing use of loans secured against dwellings being used for non-housing purposes. Such secured loans have implications for the security of tenure and a household with such a loan is classified as an owner with a mortgage in the new classification.
Previous surveys of household income were conducted by the Australian Bureau of Statistics (ABS) in 1979, 1982, 1986 and 1990. These surveys were generally conducted over a two-month period, compared to a twelve-month period for the SIH. The SIH also included improvements to the survey weighting and estimation procedures, changes to the scope and coverage of household income and changes to interviewing methods.
Previous Household Expenditure Surveys were conducted by the Australian Bureau of Statistics (ABS) in 1974–75, 1975–76, 1984, 1988–89, 1993–94, 1998–99, however, current results are only comparable back to 1984 when the Household Expenditure classification (HEC) was first introduced.
Using the Survey
Levels and items
Units used in Survey of Income and Housing (SIH) published output
Analysis of income data is usually carried out using household income measures. As explained in the 'Income' section of this publication, it is usually most appropriate to examine household income when considering economic wellbeing because of the sharing that occurs between members of households. The 'Income' section of this publication also explains that income comparisons are improved if the household income measure is adjusted to reflect the size and composition of the household.
However, when analysing the income distribution, it is the number of people who belong to households with particular characteristics, rather than the number of households with those characteristics, that is of primary interest. This leads to the preference for the equal representation of those persons in such analysis. For example, if the person is used as the unit of analysis rather than the household, then the representation in the income distribution of each person in a household comprising four persons is the same as that for each person in a household comprising two persons. In contrast, if the household were to be used as the unit of analysis, each person in the four-person household would only have half the representation of each person in the two person household.
Therefore, the income distribution measures from the SIH are calculated with respect to persons, including children. Such measures are sometimes known as person weighted estimates because the unit of analysis is the person, even though all the characteristics being described are characteristics of the household to which the person belongs. The method of calculation is described in the 'Summary indicators of Income Distribution' section of this publication.
Whereas, estimates of net worth are published using the household as the basic unit of analysis. The data item list, available from the 'Data Downloads' section of this publication, will show which data items are available for each unit type supported by the SIH.
Households
A household consists of one or more persons, at least one of whom is at least 15 years of age, usually resident in the same private dwelling. The persons in a household may or may not be related. They must live wholly within one dwelling. A group of people who make common provision for food and other essentials of living but live in two separate dwellings are in two separate households.
Most of the published output from the SIH uses the household as the unit of analysis and relates to household characteristics.
Income units
An income unit is one person, or a group of related persons within a household, whose command over income is assumed to be shared. Income sharing is assumed to take place within married (registered or de facto) couples, and between parents and dependent children. The income unit is similar, but not identical, to the unit used in determining the eligibility of people for many government pensions and allowances such as Centrelink payments.
Income data and selected income unit characteristics are available on an income unit basis from the SIH, although they are not included in any published tables from the surveys.
Persons
Data at the person level are available for each person aged 15 years and over usually resident in the households included in the SIH. Data relating to characteristics of children aged under the age of 15 years are only available at the household level.
Loans
A household may have one or more loans, and data are available for the characteristics of each loan. These characteristics include the main purpose of the loan, its security, the amount borrowed, and the principal outstanding and weekly repayment, although they are not included in detail in any published tables from the surveys.
Reference person
In some analyses, it is useful to describe a household or income unit using characteristics that are attributes of persons. For example, the analyst may wish to classify households into 'older households' and 'younger households'. One approach used is to designate one member of the household or income unit as the reference person and assume that the characteristics of that person are descriptive of the household or income unit more generally. The reference person is chosen through a set of operating procedures designed to identify the person most likely to be representative of the household or income unit. Households or income units can then be classified according to the age of the reference person, occupation of the reference person, country of birth of the reference person, etc.
Household reference person
The reference person for each household is chosen by applying a selection criteria, to all household members aged 15 years and over. The selection criteria below is applied in the order listed, until a single appropriate reference person is identified:
- the person with the highest tenure when ranked as follows: owner without a mortgage, owner with a mortgage, renter, other tenure
- one of the partners in a registered or de facto marriage, with dependent children
- one of the partners in a registered or de facto marriage, without dependent children
- a lone parent with dependent children
- the person with the highest income
- the eldest person.
For example, in a household containing a lone parent (owner with a mortgage) with a non-dependent child, the one with the higher tenure - i.e. the lone parent - will become the reference person. However, if both individuals have the same tenure (e.g. a couple, owners with a mortgage), the one with the highest income will become the reference person.
Income unit reference person
The reference person for an income unit is the male partner in a couple income unit, the parent in a lone-parent income unit and the person in a one-person income unit.
Confidentiality
The Census and Statistics Act, 1905 provides the authority for the ABS to collect statistical information, and requires that statistical output shall not be published or disseminated in a manner that is likely to enable the identification of a particular person or organisation. This requirement means that the ABS must take care and make assurances that any statistical information about individual respondents cannot be derived from published data.
Some techniques used to guard against identification or disclosures of confidential information in statistical tables are suppression of sensitive cells, random adjustments to cells with very small values, and aggregation of data.
To protect the confidentiality of individuals, a technique called perturbation is used to randomly adjust cell values in the SIH published outputs. Perturbation involves small random adjustment of the statistics and is considered the most satisfactory technique for avoiding the release of identifiable statistics while maximising the range of information that can be released. These adjustments have a negligible impact on the underlying pattern of the statistics.
After perturbation, a given published cell value will generally be consistent across all tables. However, adding up cell values to derive a total will not necessarily give the same result as published totals.
The introduction of perturbation in publications ensures that these statistics are consistent with statistics released via services such as Table Builder. To protect confidentiality within SIH publications, some cell values may have been suppressed and are not available for publication but included in totals where applicable.
Future customised data requests from the 2019–20 SIH will also utilise the same technique
Data item list
For details of the data items available from the 2019–20 SIH see the Excel data cube from the 'downloads' tab of this publication.
Publications
User Guide
This publication describes the definitions, concepts, methodology and estimation procedures used in the 2019–20 SIH. Additional material available as part of this publication includes a list of SIH output data items and classifications available from the 'Downloads' tab.
Income and Wealth
'Household Income and Wealth, Australia, 2019–20' presents key information about household income and wealth from the 2019–20 SIH. It incorporates information previously presented as fact sheets in Household Income and Income Distribution, Australia, 2011–12. It includes estimates of household income and wealth, classified by various characteristics of the households and their residents such as income quintile, main source of household income, family composition, tenure type, age and employment status. It also includes summary child care usage and cost information and superannuation information.
Housing Occupancy and Costs
'Housing Occupancy and Costs' presents data from the 2019–20 SIH on Australian housing occupancy and costs, and it relates these to characteristics of occupants and dwellings such as tenure, family composition of household, dwelling structure, age, income and main source of income. It also includes the value of dwelling estimates and information on recent home buyers.
Imputed Rent
The methodologies for imputed rent estimates used for 2019–20 are explained in 'Estimates of Imputed Rent, Australia, 2015–16'. The availability of imputed rent estimates allows the analysis of household income to be extended to include the imputed rental incomes that flow to people living in homes owned by the occupant and those paying subsidised rent. Such imputations allow for more meaningful comparison of the income circumstances of people living in different tenure types, and to understand changes over time in income levels and the distribution of income when tenures may also be changing over time.
Data cubes
All the Excel data cubes from the 2019–20 SIH will be available from the 'Data Downloads' section of the publications listed above.
If the information you require is not available from the publication or the data cubes, please contact the Customer Assistance Service via the ABS website Contact Us page. The ABS Privacy Policy outlines how the ABS will handle any personal information that you provide to us.
Supporting material
Data item list is available to assist data users in analysing the data from the survey.
Microdata access
For clients wanting to produce their own tabulations and conduct manipulations of survey estimates, microdata is accessible through a variety of products. To protect the confidentiality of individual persons and households some data items are removed from the file and the level of detail for some items is reduced. Microdata access includes:
- Detailed file available via the DataLab - approved users can access a remote desktop environment for in-depth analysis using a range of statistical software packages
- Basic microdata record file - allows approved users interactive access in the user’s own computing environment.
Microdata products will be released in June 2022, including DataLab. The Basic microdata record file for the SIH will be accessible via the publication 'Microdata: Income and Housing, Australia' from June 2022.
For more information see the Microdata Entry Page on the ABS website.
Special data services
The published data are only a small portion of the data collected in the surveys. The ABS offers specialised consultancy services to assist data users with more complex statistical information needs. Users may wish to have the unit record data analysed according to their own needs or require tailored tables incorporating data items and populations as requested by them. A wide range of data items are available - the detailed list of these are available from the 'Downloads' tab of this publication.
Tables and other analytic outputs can be made available electronically or in printed form. However, as the level of detail or disaggregation increases with detailed requests, the number of contributors to data cells decreases. This may result in some requested information not being able to be released due to confidentiality or sampling variability constraints.
All specialist consultancy services attract a service charge and clients will be provided with a quote before information is supplied. If you have any questions or require any more information, please contact Customer Assistance Service via the ABS website Contact Us page.
Comparison with Australian Systems of National Accounts
Introduction
The Survey of Income and Housing (SIH) provides detailed estimates of household income and wealth collected from individual households. These estimates are used to analyse the distribution of economic resources across the population, and to compare the financial resources available to various population subgroups. These analyses support the development, implementation and evaluation of social and economic policies, particularly for potentially disadvantaged groups such as pensioners, one-parent families and the unemployed.
The Australian System of National Accounts (ASNA) provides estimates of income and wealth for the household sector as a whole. The ASNA is designed to provide a systematic summary of Australian economic activity and to present a statistical picture of the structure of the economy and the detailed processes that make up domestic production and its distribution. Within the national accounting framework, the data show how the household sector relates to the corporate and government sectors in Australia and enables comparison with the rest of the world.
As the SIH and ASNA estimates of household income and wealth have been developed for different purposes, there are a number of differences in the resulting estimates. This chapter describes and quantifies some of the main scope, definitional and methodological differences between the income and wealth estimates from the two collections.
This analysis updates comparisons which were previously made available in the Survey of Income and Housing, User Guide, 2017-18, Australia (cat. no. 6553.0) publication. All tables containing data from the data comparisons are provided in two data cubes which are available from the 'downloads' tab of this publication. These data cubes provide the SIH and ASNA estimates, tables listing the adjustments undertaken to account for scope and measurement differences between SIH and ASNA, and a comparison of individual income and wealth items.
Data used in comparison
ASNA
The ASNA estimates used in this comparison are from the annual publication Australian System of National Accounts, 2019–20 (cat. no. 5204.0). Unpublished estimates from ASNA are also used to better align ASNA and SIH concepts. The ASNA presents aggregate estimates which are compiled from many data sources, mostly statistical surveys or as by-products of government administrative processes. Aggregates in the ASNA are balanced between the supply of goods and services and the demand for goods and services, this can result in slight deviations from other published source data. This is done in order to maintain additivity in the estimates as well as balance within the supply-use framework. Details of the data sources used to compile the ASNA estimates are available in Australian National Accounts: Concepts, Sources and Methods, 2020-21 (cat. no. 5216.0).
The unadjusted estimates of income presented in this comparison are from tables 36, 37, 42, 48, and 49 in the data cubes for ASNA, 2019–20 (cat. no. 5204.0).
The ASNA estimates of wealth are those underlying the household balance sheet presented in table 41 of ASNA, 2019–20 (cat. no. 5204.0), with the memorandum item for consumer durables taken from table 10 of the same publication. Balance sheet data are presented with respect to 30 June of each year. To improve comparability with the SIH estimates, ASNA wealth data have been averaged for the two relevant SIH years, e.g. 2019–20 is the average of balance sheet estimates for June 2019 and June 2020.
SIH
The SIH is conducted biennially and enumerated over a 12 month period.
Income data for the period 2003–04 to 2019–20 are used in this comparison. Estimates for 2003–04, 2005–06, 2007–08, 2009–10, 2011–12, 2013–14, 2015–16, 2017–18 and 2019–20 (SIH years) relate to ‘current’ financial year income which is based on estimates of usual income being received at the time the data were collected from respondents. Estimates for 2004–05, 2006–07, 2008–09, 2010–11, 2012–13 and 2014–15 were derived from income data reported for the previous financial year in SIH 2005–06, SIH 2007–08, SIH 2009–10, SIH 2011–12, SIH 2013–14 and SIH 2015–16 respectively. Information used to derive previous financial year income estimates was not collected from SIH 2017–18 year onwards.
Wealth data from the SIH has been collected in every SIH since 2003–04, except in 2007–08. This comparison includes data for the years 2003–04, 2005–06, 2009–10, 2011–12, 2013–14, 2015–16, 2017–18 and 2019–20. Respondents are asked to report the value of their assets and liabilities at the time they are surveyed. Therefore, the wealth estimates in SIH are assumed to relate to the average level of household net worth during that year.
Income Comparison
The data cube ‘SIH-ASNA income comparison’ which is available in the 'downloads' tab of this publication, provides the detailed comparison tables between the Survey of Income and Housing (SIH) and the Australian System of National Accounts (ASNA) estimates for the period 2003–04 to 2019–20.
Scope and measurement differences
There are a number of scope and measurement differences that can be quantified between the SIH and ASNA household income systems. After adjusting for these differences, the alignment of the two estimates is improved. For example, in 2019–20, the adjusted SIH income was 98.0% of the adjusted ASNA income ($1,214 billion and $1,239 billion, respectively).
(a) Information used to derive previous financial year income estimates for 2016–17 was not collected in SIH 2017–18 and 2019-20
Source(s): SIH, ASNA
The main quantifiable differences, with estimates for 2019–20, are:
- SIH includes superannuation and life insurance pensions received as regular income by households ($53 billion) whereas ASNA does not consider these pensions as income but as transactions in the financial account, and therefore a reduction of household assets captured in the balance sheet. However, ASNA includes as income the imputed interest measures, which includes the investment income of insurance enterprises, superannuation funds and investment funds attributable to policyholders, as well as imputed interest on government unfunded superannuation arrangements ($111 billion)
- SIH deducts a much broader range of housing and business expenses than the ASNA, resulting in differences in the measurement of income from housing and operations of unincorporated enterprises ($124 billion in total)
- SIH includes financial support from persons not living in the household ($16 billion), which are measured on a net basis within each sector in the ASNA, thus assumed to net out to zero across all households
- ASNA includes income not collected in SIH, such as employers' social contributions, i.e. the compulsory contributions payable by employers to secure social benefits, such as superannuation and workers' compensation premiums ($101 billion), non-life insurance claims ($48 billion) and financial intermediation services indirectly measured (FISIM) on interest received ($19 billion)
- ASNA includes income received by non-profit institutions serving households (NPISHs) such as churches and charities. Government transfers to NPISHs can be quantified ($44 billion), but other income received such as transfers from the corporate sector, investment income and income from the sale of goods and services cannot be separately identified
After all adjustments, some scope differences remain which cannot be easily quantified. SIH excludes people living in non-private dwellings, and in very remote regions of Australia. It is estimated that this excludes approximately 3% of people living in Australia. Additionally, ASNA estimates include some benefits not relatable to the private households in scope of SIH, such as expenditure on institutional aged care
Comparison of income data items
This section compares selected individual sources of income collected in SIH with items published in the ASNA, or source data available for those items. The underlying data and adjustments made to improve alignment between the two data sources are available in the SIH-ASNA Income comparison data cube available from the 'downloads' tab of this publication.
(a) Information used to derive previous financial year income estimates for 2017–18 was not collected in SIH 2019–20
Source(s): SIH, ASNA
Employee income
The largest component of household income is employee income. To align with ASNA measurements, an adjustment of $8 billion was applied to SIH data to remove workers' compensation received directly through the payroll. After this adjustment SIH and ASNA figures were $872 billion and $848 billion respectively.
Government pensions and allowances income
In 2019–20, Australian government pensions and allowances in the SIH were $110 billion, which was lower (84%), than the equivalent ASNA estimate ($132 billion).
SIH collects detailed government pensions and allowances paid to Australian residents in private dwellings by type of payment. The SIH estimates do not include pensions and allowances received by people living in non-private dwellings (e.g. nursing homes), nor by people living in very remote areas of Australia.
The related item in the ASNA is 'social assistance benefits' sourced from ABS Government Finance Statistics which are compiled from data provided by individual government agencies to the Australian Government Department of Finance, and state government treasuries. The scope of these payments is broader than those collected in the SIH.
To better align with SIH, an adjustment has been made to the ASNA data to remove the Private Health Insurance Rebate and the Child Care Subsidy which are treated as social transfers in kind in the SIH. However, adjustments have not been made for the inclusion of some education related payments made to parents to offset the cost of educating their children, or any one-off or irregular payments made by state and Commonwealth agencies that are included in ASNA but unlikely to be captured in the SIH.
Net business income
The SIH collects the profit or loss from unincorporated businesses from working sole proprietors and partners. The income earned by silent partners and non-working beneficiaries of businesses and other trusts is collected separately and included in investment income. To align with the ASNA concept of unincorporated business income, these sources of income, along with non-residential property income and royalties have been included in net business income for comparison purposes.
In the ASNA, income from production by unincorporated enterprises is referred to as gross mixed income (GMI), and is measured as income from production less intermediate consumption. Intermediate consumption consists of the value of the goods and services consumed as inputs to the production process. Other costs normally expensed in business accounts, such as interest payable on loans and depreciation are not deducted. The ASNA estimates of GMI are compiled mainly from the business tax returns of sole proprietors, partnerships and private trusts. Royalties and income from non-residential property are included in GMI.
The SIH income from the selected items that relate to net business income was $67 billion in 2019–20, compared to the ASNA estimate of $107 billion after adjusting GMI to remove business expenses not deducted. The higher income in ASNA may be partly due to the different classification between the ASNA and the SIH of some businesses that have a trust underlying their business operations, with the trustee listed as an incorporated entity. In the ASNA, these businesses would be classified as unincorporated enterprises whereas in the SIH, the business owners may report these businesses as incorporated enterprises (and their income included in dividend income).
Interest income
In the SIH, interest income from a range of financial accounts is collected. For the 'current' year, respondents are asked to estimate their expected interest income in the financial year. For the 'previous' year, respondents are asked to report actual interest earned.
In the ASNA, interest estimates are derived from a large number of data sources by constructing matrices of the flows of interest receivable and payable between the various sectors and subsectors of the economy. However, in the ASNA, interest receivable by financial institutions excludes payments by borrowers for the services provided by the financial institutions, and interest payable by financial institutions is lower than it would otherwise be to cover the costs of financial services provided to depositors. This service component is referred to as financial intermediation services indirectly measured (FISIM) and has been deducted from the ASNA interest income from deposits for comparison with SIH data.
The ASNA estimate of interest income, less FISIM, is consistently higher than the SIH ($14 billion compared to $12 billion in 2019–20). The higher ASNA estimate of interest can be partly explained by the inclusion of interest received by unincorporated enterprises and NPISHs, and the possible over estimation of interest received by ASNA including interest linked to mortgage offset accounts.
Personal taxation data published by the ATO provide another measure of interest earned by persons in Australia. This information is the aggregated total of gross interest income reported on individual tax returns. Like the SIH interest item, income from cash management trusts and interest earned by unincorporated businesses are reported separately. The ATO interest statistic does not include interest received by persons not required to complete an individual tax return.
As shown in Graph 3, the SIH and ATO estimates align relatively closely. SIH estimates based on 'previous' year reporting (2004–05, 2006–07, 2008–09, 2010–11, 2012–13, 2014–15, 2017–18 and 2019–20) are closer to the ATO estimates than the estimates based on 'current' year reporting. This suggests that survey respondents provide a conservative estimate of expected interest in the SIH for the 'current' year, but a more accurate reporting of this income when actual interest earned is known.
(a) Information used to derive previous financial year income estimates for 2017–18 was not collected in SIH 2019–20
Source(s): SIH, ASNA, ATO
Dividend income
SIH income from dividends was $39 billion in 2019–20, compared to the ASNA estimate of $38 billion. SIH dividends include dividends from publicly listed companies and public unit trusts (such as equity, cash management and property trusts), as well as dividends paid to households from their own incorporated companies. In SIH 2007–08, improvements were made to the questionnaire to separately collect information about public unit trusts and other trusts. From SIH 2013–14 onwards, franking information was imputed from ATO data rather than being collected from respondents for publicly listed companies. Both of these changes significantly improved the coverage of dividend income.
The ASNA estimates of dividends are based on data provided by the ATO. These differ from the SIH estimates as they do not include franking credits.
Residential rental income
SIH income from residential property is consistently higher than the ASNA estimate ($101 billion and $85 billion, respectively in 2019–20). In the SIH, net profit or loss from investment properties is collected from respondents and the value of housing services accruing to owner-occupiers is imputed for the primary residence. Both estimates exclude all costs that would be borne by a landlord.
In the ASNA, income from residential property is presented as gross operating surplus (GOS) on dwellings owned by persons. This income includes actual rental income as well as an imputed value of housing services accruing to owner-occupiers from both their principal residence and any additional residences such as holiday homes. GOS is calculated net of intermediate consumption costs, e.g. repairs and maintenance, the imputed service charges on finance and insurance, and body corporate fees.
To align with the SIH measurement of income from residential property, interest payable, water and sewerage costs and part of house insurance premiums have been deducted from the ASNA estimate of GOS. However, no estimate of depreciation has been deducted from the ASNA estimates.
Social transfers in kind
Social transfers in kind (STIK) have been modelled in the SIH since 2011–12. They are also available for the years that fiscal incidence studies are conducted using data from the Household Expenditure Survey (2003–04, 2009–10 and 2015–16). The SIH and ASNA estimates of STIK both use ABS Government Finance Statistics (GFS) as the main source for valuing the cost to government of the provision of STIK.
The SIH STIK allocations have been between 2% and 6% higher than those published in the ASNA in each of the years that have been compared.
References
ABS 2015, Australian System of National Accounts: Concepts, Sources and Methods, cat. no. 5216.0
ATO (Australian Tax Office) 2019, Taxation Statistics 2018–19: Individuals
Wealth Comparison
The 'SIH-ASNA Wealth comparison' data cube, available in the 'downloads' tab of this publication, provides the detailed comparison tables between the Survey of Income and Housing (SIH) and Australian System of National Accounts (ASNA) estimates of wealth for the years that SIH wealth data are available. Wealth is only collected for the ‘current’ year in the biennial SIH. It was first collected in SIH 2003–04 and has been collected in all subsequent surveys except SIH 2007–08.
Scope and measurement differences
There are a number of scope and measurement differences that can be quantified between the SIH and ASNA household wealth estimates. After adjusting for these differences, the SIH estimate of the value of net worth was 93% ($9,118 billion) of the ASNA estimate ($9,810 billion).
Source(s): SIH, ASNA
The quantifiable differences, with estimates for 2019–20, are:
- SIH includes the value of household contents and motor vehicles used for private purposes ($999 billion). The most closely related ASNA item is the value of consumer durables ($412 billion) which is not included in the ASNA estimate of net worth in the household sector balance sheet but is included as a memorandum item in the National Balance Sheet (Table 10, cat. no. 5204.0). The valuation methods differ: ASNA estimates actual value, taking into account depreciation; SIH uses insurance value which is normally based on a 'new for old' basis. ASNA consumer durables exclude clothing and household textiles, artworks and antiques that are held as a store of value, and all non-durable household goods.
- ASNA includes other assets not collected in SIH, including unfunded superannuation claims, i.e. the liability of governments to pay superannuation benefits to their employees for which they have not set aside funds ($602 billion); the technical reserves of general and life insurance corporations, i.e. policy holders' net equity in, or claims on, the reserves of general and life insurance corporations which are not relatable to individual households and equate to prepayments of premiums and reserves held to cover outstanding claims ($189 billion), and the capitalised costs of transfers of ownership on real estate transactions, such as stamp duties, legal fees and real estate agents’ commissions ($248 billion).
- ASNA include the bank deposits of non-profit institutions serving households (NPISHs), such as churches and charities, net of bank borrowings ($24 billion).
Wealth items
Graph 2 shows the alignment between the SIH and ASNA for selected wealth data items.
Source(s): SIH, ASNA
Residential property assets
Residential property is the largest asset held by the household sector. In 2019–20, the SIH estimate of the value of residential property was 97% ($6,443 billion) of the ASNA estimate ($6,615 billion).
The SIH collects data about the value of dwellings including owner occupied dwellings, second homes (such as holiday homes) and rental investment properties, if not reported as assets of an unincorporated business. Estimates are based on the gross amount respondents would expect to receive if they were to sell their property at the time of interview.
The ASNA uses estimates of the total value of residential dwellings at market value sourced from the quarterly ABS Residential Property Price Indexes: Eight Capital Cities (cat. no. 6416.0). The estimates include the total value of residential land plus the dwelling. The value of residential dwellings is based on multiplying the mean price of residential dwellings by the number of dwellings. The calculation is undertaken at the locality level and then aggregated to State and Territory and National level. The mean price of residential dwellings is based on market real estate and Valuer's General data. Counts of total dwellings are obtained from the ABS Census of Population and Housing. For intercensal years, dwelling counts are extrapolated forward using dwelling completions, net of demolitions.
Own unincorporated businesses
In the SIH, respondents are asked to provide a net estimate of the value of their own unincorporated businesses (i.e. net of liabilities). Therefore, no information is available about the asset and liability composition of this component. For the purpose of this comparison, the values of non-residential property and private trusts reported in the SIH have been included in the selected assets listed in Table 5. However, any liabilities related to the non-residential property cannot be separately quantified. The increase in the SIH estimate from 2009–10 relates to the separate valuation of private trusts ($287 billion in 2019–20) which have been included in this comparison. Some of this trust income is likely to be reported in other components of the ASNA, including ‘Shares and other equity’.
The ASNA includes information about the individual assets and liabilities by type, and does not identify which assets or liabilities relate to unincorporated business activities and which are used for other purposes. However, some forms of assets and liabilities are most likely to relate to business activities.
In 2019–20, the SIH net value of the selected assets that most closely relate to the operations of unincorporated businesses was $904 billion, while the net value of the selected ASNA assets and liabilities was $585 billion.
Accounts held with financial institutions
The SIH items 'accounts held with financial institutions' and 'offset accounts' are compared to the deposit component (excluding deposits of NPISHs) of the ASNA item 'deposits', and the ASNA item 'loans and placements', that is, deposits with other financial institutions. The SIH items were 71% of the ASNA items in 2019–20 ($796 billion and $1,116 billion, respectively).
The differences are partly explained by the inclusion of deposits belonging to unincorporated businesses in ASNA items. Deposits of unincorporated businesses are not included in ‘accounts held with financial institutions’ and ‘offset accounts’ in the SIH. These values cannot be separately identified in the SIH, as account balances are reported in net value of these businesses. In 2019–20, 837,200 households were estimated to own an unincorporated business in the SIH. The scope of the SIH also excludes people living in non-private dwellings who may hold accounts with financial institutions.
Superannuation funds
Superannuation is the largest financial asset of households. Respondents are asked to report the total balance in each of their superannuation funds from their last superannuation statement.
The corresponding ASNA item is the pension fund component of insurance technical reserves. The ASNA estimate is derived from information provided to regulatory authorities by the superannuation funds and the ATO for the self-managed funds.
In 2019–20, the value of superannuation assets reported in the SIH was lower than the ASNA estimate ($2,252 billion and $2,543 billion, respectively).
Shares and other equity (including own incorporated business)
The total value of the selected SIH items that relate to shares and own incorporated business equity was $640 billion in 2019–20, compared to the corresponding ASNA estimate of $1,056 billion.
In the ASNA, the values of listed shares and some unlisted shares are calculated as residuals, that is, the total value of each of these types of shares owned by all sectors is estimated, and the value of shares owned by sectors other than households are subtracted to derive the value of shares owned by the household sector. However these residual items are validated against other economic indicators and information regarding household wealth. The values for other unlisted shares are derived from a range of reported data and other imputed estimates where householders are known to have an ownership interest.
Property loans
In 2019–20, total property loans in the SIH were $1,775 billion compared with $1,759 billion in ASNA.
SIH property loans include the principal outstanding on loans, where the loans have been used both to finance the purchase or construction of, or alteration or addition to, an owner occupied dwelling, or to finance the purchase of other property, as well as loans for non-residential property not treated by respondents as part of the liabilities of their unincorporated business. It does not include loans for dwellings respondents regard as assets of their unincorporated businesses.
In the ASNA, loans for housing relate to all loans originally for the purpose of housing. Included in these loans are refinancing amount of the original loan that may be used for a purchase other than housing e.g. consumption expenditure such as an overseas holiday.
Source(s): SIH, ASNA
Other loans
The SIH estimate of the value of other loans includes study loans, credit card debt and loans for purposes other than property or business. In 2019–20, these were valued at $198 billion in the SIH, compared with $373 billion in the ASNA.
ASNA includes loans of unincorporated businesses if they were not secured against a residential property, whereas in the SIH, these loans are likely to be included in the net value of the business, and therefore not reported as a separate liability. There may also be difficulties in dividing aggregate financial data into sector specific components in the ASNA and some loans, such as those associated with vehicle finance leases, can be difficult to allocate between business purposes and personal purposes, for both reporting in SIH and in compiling the ASNA estimates.
References
ABS (Australian Bureau of Statistics) 2020, Australian System of National Accounts, 2019–20, cat. no. 5204.0
Australian System of National Accounts: Concepts, Sources and Methods, cat. no. 5216.0
Glossary
Accounts with financial institutions
Accounts held with banks or any other financial institutions, e.g. credit unions, building societies, insurance companies, finance companies. Examples of types of accounts include: passbook, statement, cheque or term deposit accounts.
Additional Child Care Subsidy (ACCS)
A supplementary payment introduced at the same time as the Child Care Subsidy (CCS).
Acute care institution benefits
Includes social transfers in kind relating to all activities of acute care hospitals, free-standing hospices, alcohol and drug treatment centres, and same-day establishments except activities involving health research and formal health education. Acute care institution benefits are a component of health benefits.
Age
Person's age in years last birthday.
Allocated pensions
Allocated pensions (also known as account-based pensions) are a regular income stream paid by superannuation funds. The value of the pension is calculated based on the amount of money accumulated in people’s superannuation accounts and varies depending on the investment earnings of the fund.
Annuities
Annuities are guaranteed regular and recurring receipts, generally from an insurance company, the right to which was purchased with a lump sum or regular contributions at some point in the past.
Assets
An entity of a financial or non-financial nature, owned by the household or its members, and from which economic benefits may be derived by holding or use over a period of time.
Australian Statistical Geography Standard (ASGS)
The ASGS came into effect in July 2011 to replace the Australian Statistical Geographical Classification (ASGC). The ASGS provides a common framework of statistical geography used by the ABS to enable the publication of statistics that are comparable and spatially integrated. Its purpose is to outline the conceptual basis of Mesh Blocks, the regions of the main structure and the Greater Capital City Statistical Areas and their relationships to each other. For further information refer to Australian Statistical Geography Standard (ASGS): Volume 1 - Main Structure and Greater Capital City Statistical Areas, July 2016 (cat. no. 1270.0.55.001) and the geography page on the ABS website.
Australian Standard Geographical Classification (ASGC)
The ASGC was replaced by the Australian Statistical Geography Standard (ASGS) in July 2011. For further information refer to Australian Standard Geographical Classification (ASGC) (cat. no. 1216.0) and the geography page on the ABS website.
Balance of State
Under the Australian Standard Geographical Classification (ASGC), Balance of State represents each state or territory not defined as Capital City. The ASGC has been replaced with Australian Statistical Geography Standard (ASGS), and areas outside Greater Capital City Statistical Areas are known as Rest of State. See definition of Rest of State.
Before and/or after school care
A type of formal child care provided for school aged children before and/or after school during the school term. Some services also provide care on 'pupil free days'. The services usually make use of established facilities such as schools, community halls, and recreation centres.
Body corporate fees
Compulsory payments to the governing body of a block of home units or apartments. The governing body consists of home unit owners or their representatives.
Bond
In the context of investments, a bond is a certificate of ownership of a specified portion of a debt. May be issued by a government agency or private corporation to individuals or companies and usually bears a fixed interest rate of return on investment. In the context of rented dwellings, bond is money paid in addition to any rent by a new tenant as surety against damages to the premises rented.
Canadian National Occupancy Standard (CNOS) for housing appropriateness
A standard measure of housing utilisation that is sensitive to both household size and composition. Based on the following criteria used to assess bedroom requirements, households requiring at least one additional bedroom are considered to be overcrowded:
- there should be no more than two persons per bedroom
- a household of one unattached individual may reasonably occupy a bed-sit (i.e. have no bedroom)
- couples and parents should have a separate bedroom
- children less than five years of age, of different sexes, may reasonably share a room
- children five years of age or over, of different sexes, should not share a bedroom
- children less than 18 years of age and of the same sex may reasonably share a bedroom, and
- single household members aged 18 years or over should have a separate bedroom.
The CNOS variable on the file compares the number of bedrooms required with the actual number of bedrooms in the dwelling.
Capital city
Capital city under the Australian Standard Geographical Classification (ASGC) refers to Australia's six State capital city Statistical Divisions and the Darwin Statistical Division as defined in the Australian Standard Geographical Classification (ASGC) (cat. no. 1216.0). For the Australian Capital Territory the estimates relate predominantly to urban areas, and all of the Australian Capital Territory is defined as a capital city for this publication. Capital city estimates for the Northern Territory are not available on the CURF. The ASGC has been replaced with Australian Statistical Geography Standard (ASGS), see definition of Greater Capital City Statistical Area.
Changeover buyer
A household that bought their dwelling in the three years prior to being interviewed, and either the reference person or partner had owned or been purchasing a home previously.
Child care assistance
Includes social transfers in kind relating to the Child Care Benefit and Child Care Rebate and associated administrative costs. Child care assistance is a component of welfare benefits.
Child Care Benefit (CCB)
Assistance in the form of a payment made by the Australian Government to help with the costs of child care for families who use either approved or registered child care. The scheme is means-tested and families can either receive CCB as a lump sum payment, or as reduced child care fees.
Child Care Rebate (CCR)
Child Care Rebate (CCR) covers 50 per cent of out-of-pocket child care expenses, up to a maximum amount per child per year. The CCR is available for families who qualify for Child Care Benefit (CCB) and meet a work, study and training test.
Child Care Subsidy (CCS)
The Child Care Subsidy (CCS) is the main way the Australian Government helps families with child care fees. CCS replaced the two previous payments: Child Care Benefit and Child Care Rebate.
Children's assets
Any assets owned by children, aged 14 years or less, in the household that are not included in the value of the household contents. These assets can be financial (e.g. a child's bank accounts, assets held in trusts, bonds, debenture stock) or can be non-financial (e.g. jewellery or property held in trust for the children). Children's assets is no longer collected separately in the SIH, but is a component of 'other assets'.
Community health service benefits
Includes social transfers in kind relating to community health services such as domiciliary nursing services, well baby clinics, dental health services, health services provided to particular community groups, family planning services, alcohol and drug rehabilitation programs not involving admission, and other health services provided in a community setting. Also includes expenditure on patient transport. Community health service benefits are a component of health benefits.
Consumer Price Index (CPI)
A general Indicator of the rate of change in prices paid by households for consumer goods and services.
Contents of dwelling
This is a non-financial asset and comprises an estimated value of household contents. Examples include: clothing, jewellery, hobby collections, furniture, paintings and other works of art, soft furnishings and electrical appliances other than fixtures such as stoves and built-in items.
Cost of child care
The cost, gross of Child Care Benefit and the Child Care Rebate, to parents for a child to attend care. In most cases, where the Child Care Benefit was paid directly to the child care service provider, the cost of care was directly collected in the survey. In a small number of cases, where the Child Care Benefit was not paid directly to the provider, the Child Care Benefit was estimated.
Couple
See One family households.
Couple family with dependent children
See One family households.
Couple, one family household
A one family household consisting of:
- one couple only
- one couple, with their dependent and/or non-dependent children only
- one couple, with or without children, plus other relatives
- one couple, with or without children and other relatives, plus unrelated individuals.
Credit card debt
The amount owing on the respondent's latest credit card account statement (including any government, interest of financial institution charges). Includes amounts owing on specialised retail shopping cards as well as general credit cards such as Visa, Mastercard and store credit cards but excludes Visa and Mastercard debit only cards.
Current financial year income
Income earned in the period 1 July 2017 to 30 June 2018.
Debenture
A formal acknowledgement of indebtedness by a company. Interest is paid by the company at specific intervals. A loan or deposit can be called a debenture if it is secured over company assets. Unlike shareholders, debenture holders have a creditor relationship with the company. Instead of dividends, debenture holders receive interest on their debentures which is accounted for by the company as an expense.
Deciles
Groupings that result from ranking all households or persons in the population in ascending order according to some characteristic such as their household income and then dividing the population into 10 equal groups, with each group comprising 10% of the estimated population.
Dependent children
All persons aged under 15 years; and persons aged 15–24 years who are full-time students, have a parent in the household and do not have a partner or child of their own in the household.
Disposable income
Gross income less income tax, the Medicare levy and the Medicare levy surcharge i.e. remaining income after taxes are deducted, which is available to support consumption and/or saving. Income tax, Medicare levy and the Medicare levy surcharge are imputed based on each person's income and other characteristics as reported in the survey. Disposable income is sometimes referred to as net income.
Dividends
Dividends may be the main source of income for people who run their own incorporated business. They can be:
- 'franked' which are shares of company profit paid or credited by an Australian resident public company from profits on which Australian company tax has been paid, or
- 'unfranked' which are those shares of company profit paid by an Australian resident company from profits on which Australian company tax has not been paid.
Dwelling (private)
A suite of rooms within a building that is self-contained and intended for long-term residential use. To be self-contained the suite of rooms must possess cooking and bathing facilities as building fixtures. For examples of private dwellings see 'Dwelling structure' below.
Dwelling structure
The dwelling structure type is determined by the structure of the building that contains the dwelling. Dwellings belong to one of four categories:
- separate house
- semi-detached, row or terrace house or townhouse
- flat, unit, or apartment and
- other dwelling, including caravan or cabin in a caravan park, houseboat in a marina, caravan not in a caravan park, houseboat not in a marina and house or flat attached to a shop.
Earners
Persons (excluding dependent children) who receive income from wages or salaries, who are engaged in their own business or partnership, or are silent partners in a business or partnership.
Education benefits
Social transfers in kind relating to the provision of school, tertiary and other education.
Electricity concessions
Includes social transfers in kind relating to electricity concessions and rebates.
Employed
Persons aged 15 years and over who, during the week before the interview:
- worked one hour or more for pay, profit, commission or payment in kind in a job or business, or on a farm (includes employees, employers and own account workers)
- worked one hour or more, without pay, in a family business or on a family farm
- had a job, business or farm but was not at work because of holidays, sickness or other reason.
Employee
An employed person who, for most of his/her working hours:
- works for a public or private employer and receives remuneration in wages or salary, or is paid a retainer fee by his/her employer and works on a commission basis, or works for an employer for tips, piece-rates or payment in kind
- operates their own incorporated enterprise with or without employees.
Employee income
An employee's total remuneration, whether monetary or in kind, received as a return to labour from an employer or from a person's own incorporated business. It comprises wages and salaries, bonuses, amounts salary sacrificed, non-cash benefits such as the use of motor vehicles and subsidised housing, and termination payments.
Employer
A person who operates his or her own unincorporated business or engages independently in a profession or trade, and hires one or more employees.
Energy Supplement
A tax-exempt, indexed payment paid to pensioners, other income support recipients, families receiving Family Tax Benefit payments and Seniors Supplement recipients, provided they meet eligibility requirements.
Equity in the dwelling
A household's equity in the dwelling is the difference between the value of the dwelling and the total amount outstanding on mortgages taken out on the dwelling for any purpose, or unsecured loans taken out for housing purposes.
Equivalisation
Can be applied to disposable household income and net worth to create equivalised disposable household income and equivalised household net worth. Adjustments are made using an equivalence scale. Equivalence measures are used in some analyses to enable comparison of the relative economic wellbeing of households of different size and composition. For a lone person household, the equivalised value is equal to the original value, or equal to zero if the original value was negative. For a household comprising more than one person, it is an indicator of the level that would be needed by a lone person household to enjoy the same level of economic wellbeing as the household in question.
Equivalising factor
A factor that can be used to adjust the actual incomes of households in a way that enables analysis of the relative wellbeing of households of different size and composition. The equivalising factor included on the file has been calculated using the 'modified OECD' equivalence scale. The factor is built up by allocating points to each person in a household. Taking the first adult in the household as having a weight of 1 point, each additional person who is 15 years or older is allocated 0.5 points, and each child under the age of 15 is allocated 0.3 points. The equivalence factor is the sum of the equivalence points allocated to the household members. Equivalised household income can be derived by dividing total household income by the equivalence factor.
Note that for large households, the equivalence factors included on the CURF file are based on the household size after it has been reduced to the maximum size allowable on each CURF.
Family
Two or more people, one of whom is at least 15 years of age, who are related by blood, marriage (registered or de facto), adoption, step or fostering, and who usually live in the same household. A separate family is formed for each married couple, or for each set of parent-child relationships where only one parent is present.
Family composition of household
Classifies households into three broad groupings based on the number of families present (one family, multiple family and non-family). One family households are further disaggregated according to the type of family (such as couple family or one-parent family) and according to whether or not dependent children are present. Non-family households are disaggregated into lone person households and group households.
Family day care
A type of formal child care provided by experienced caregivers in their own homes, available for a full day or part day. Schemes are administered and supported by central coordination units.
Family Tax Benefit (FTB)
Includes Family Tax Benefit (both Part A and Part B) payments received fortnightly, as well as additional cash allowances such as rent assistance. It also includes one-off payments to families.
Financial assets
An asset whose value arises not from its physical existence (as would a building, piece of land, or capital equipment) but from a contractual relationship. Financial assets are mostly financial claims (with the exception of shares and value of own unincorporated business). Financial claims entitle the owner to receive a payment, or a series of payments, from an institutional unit to which the owner has provided funds. Examples include accounts held with financial institutions (including offset accounts), ownership of an incorporated business, shares, debentures and bonds, trusts, superannuation funds, and loans to other persons.
First home buyer
A household which bought their dwelling in the three years prior to being interviewed, and neither the reference person nor their co-resident partner had owned or been purchasing a home previously.
First Home Owners Grant
The First Home Owners Grant is a scheme established by the Australian Government to provide financial assistance to eligible first home buyers. Its value has varied over time as government policy has changed.
Flat, unit or apartment
Includes all self-contained dwellings in blocks of flats, units or apartments. These dwellings do not have their own private grounds and usually share a common entrance foyer or stairwell. This category includes houses converted into flats and flats attached to houses such as granny flats. A house with a granny flat attached is regarded as a separate house.
Formal child care
Regulated child care away from the child's home. The main types of formal care are before and/or after school care, long day care, family day care, occasional care and vacation care.
Free child care
The Government announced an Early Childhood Education and Care Relief package which provides free childcare for Australian families.
Full-time employed
Employed persons who usually work 35 hours or more a week (in all jobs).
Full-time student
A person 15 years or over who is classified as a full-time student by the institution they attend, or considers himself/herself to be a full-time student. Full-time study does not preclude employment.
Gini coefficient
A summary measure of inequality of income or wealth across the population. Gini coefficient values range between 0 and 1. Values closer to 0 represent higher equality and values closer to 1 represent higher inequality.
Government pensions and allowances
Income support payments from government to persons under social security and related government programs. Included are pensions and allowances received by aged, disabled, unemployed and sick persons, families and children, veterans or their survivors, and study allowances for students. All overseas pensions and benefits are included here, although some may not be paid by overseas governments.
Gross imputed rent
The estimated market rent that a dwelling would attract if it were to be commercially rented.
Gross income
Income from all sources, whether monetary or in kind, before income tax, the Medicare levy and the Medicare levy surcharge are deducted.
Group household
See Non-family household.
Greater Capital City Statistical Area Structure
Greater Capital City Statistical Areas (GCCSAs) represent the socio-economic extent of each of the eight state and territory capital cities. They include the people who regularly socialise, shop or work within the city, but live in the small towns and rural areas surrounding the city.
Guaranteed pensions
Comprise pensions which are guaranteed to provide a regular income stream for the life of the recipient or for the reversionary beneficiary’s life on the death of the member. The most common are defined benefit pensions which are calculated based on a predetermined formula which varies in different funds. Common criteria used include: average salary before retirement, retirement age and years of employment.
Health benefits
Health benefits are social transfers in kind relating to acute care institutions, community health services, pharmaceuticals, Private Health Insurance Rebate and other health benefits.
Household
A person living alone or a group of related or unrelated people who usually live in the same private dwelling.
Household questionnaire
Used to collect information on household characteristics, housing costs and household assets and liabilities.
Household reference person
The reference person for each household is chosen by applying, to all household members aged 15 years and over, the selection criteria below, in the order listed, until a single appropriate reference person is identified:
- the person with the highest tenure when ranked as follows: owner without a mortgage, owner with a mortgage, renter, other tenure
- one of the partners in a registered or de facto marriage, with dependent children
- one of the partners in a registered or de facto marriage, without dependent children
- a lone parent with dependent children
- the person with the highest income
- the eldest person.
Housing benefits
Social transfers in kind from the provision of government housing at subsidised rental rates.
Housing costs
Housing costs comprise the following costs for the three different tenure type categories:
- rent payments
- rates payments (general and water)
- mortgage or unsecured loan payments if the initial purpose was primarily to buy, build, add to, or alter the dwelling.
Some additional items relating to housing costs are available to enable alternative estimates of housing costs to be constructed. For further information, see the Housing Cost Measures appendix to the Explanatory Notes of Housing Occupancy and Costs, Australia (cat. no. 4130.0).
Housing costs as a proportion of income
The total weekly housing costs of a group (e.g. one parent households) are divided by the total weekly income of that group expressed as a percentage.
Housing utilisation
Provides a measure of the bedroom requirements of a household according to household size and composition. See Canadian National Occupancy Standard for housing appropriateness.
Imputed rent
See Net imputed rent and Gross imputed rent.
Income
Income consists of all current receipts, whether monetary or in kind, that are received by the household or by individual members of the household, and which are available for, or intended to support, current consumption.
Income includes receipts from:
- wages and salaries and other receipts from employment (whether from an employer or own incorporated enterprise), including income provided as part of salary sacrificed and/or salary package arrangements
- profit/loss from own unincorporated business (including partnerships)
- net investment income (interest, rent, dividends, royalties)
- government pensions and allowances (includes pensions and allowances from Commonwealth and State and Territory governments as well as pensions from overseas)
- private transfers (e.g. superannuation, workers' compensation, income from annuities, child support, and financial support received from family members not living in the same household).
Gross income is the sum of the income from all these sources before income tax, the Medicare levy and the Medicare levy surcharge are deducted. Other measures of income are Disposable income and Equivalised disposable household income.
Note that child support and other transfers from other households are not deducted from the incomes of the households making the transfers.
Income tax
See Taxes on income.
Income unit
One person or a group of related persons within a household, whose command over income is assumed to be shared. Income sharing is assumed to take place within married (registered or de facto) couples, and between parents and dependent children.
Income unit reference person
The male partner in a couple income unit, the parent in a one parent income unit and the person in a one person income unit.
Incorporated business
An incorporated business is a company that has a registered business name with the Australian Securities and Investments Commission (ASIC) and Australian Business Register (ABR), and a legal status which is separate to that of the individual owners of the business.
Individual questionnaire
Used to collect information from each person aged 15 years and over on individual details such as income, personal assets, education and labour force status.
Industry
Coded for all employed people aged 15 years and over, using the Australian and New Zealand Standard Industrial Classification (ANZSIC).
Informal child care
Non-regulated child care, arranged by a child's parent/guardian, either in the child's home or elsewhere. It comprises care by (step) brothers or sister, care by grandparents, care by other relatives (including a parent living elsewhere) and care by other (unrelated) people such as friends, neighbours, nannies or babysitters. It may be paid or unpaid.
Investment income
Income received as a result of ownership of assets. It comprises returns from financial assets (interest, dividends), and from non-financial assets (rent and royalties).
Investment loan
A loan taken out for the purpose of financing investment, excluding loans for business purposes and rental property.
Labour force status
Classifies all people aged 15 years and over according to whether they were employed, unemployed or not in the labour force.
Landlord type
For renters, the type of entity to whom rent is paid or with whom the tenure contract or arrangement is made.
For households, renters are classified to one of the following categories:
- Real estate agent
- State or territory housing authority
- Person not in same household - Parent/Other relative
- Person not in same household - Other person
- Owner/manager of caravan park
- Employer - Defence Housing Authority
- Employer - Government
- Employer - Other employer
- Housing co-operative/Community/Church group
- Other
For persons, renters can also be classified to one of the following two categories in addition to those listed above:
- Person in the same household - Parent/Other relative
- Person in the same household - Other person.
Liability
A liability is an obligation which requires one unit (the debtor) to make a payment or a series of payments to the other unit (the creditor) in certain circumstances specified in a contract between them.
Life tenure scheme
A contractual arrangement in which the resident has the right to occupy the dwelling for life or an unspecified period but without the full rights of ownership and usually with limited or no equity in the dwelling. This is a common arrangement in retirement villages and can also be referred to as a leasehold or loan and licence agreements.
Loan
A form of liability that is created when creditors lend funds directly to debtors. Examples include an overdraft from a bank, money lent by a building society with a mortgage over a property as collateral, and personal loans.
Loans for owner occupied dwelling
Principal outstanding on loans used to purchase, build, alter, or make additions to the selected dwelling. Includes money borrowed for a deposit on the selected dwelling, and bridging finance taken out until such time as a loan or mortgage is obtained or the dwelling is bought outright. Where only a proportion of a loan is used for the owner occupied dwelling, only that proportion of the principal outstanding is included.
Lone person household
See Non-family household.
Long day care centre
A type of formal child care that is centre-based and is available to children between birth and school age for the full day or part day. Centres are usually open for most of the year.
Low Economic Resource Household
People with low economic resources (i.e. low consumption possibilities) are those in households in the lowest two quintiles (i.e. 40%) of both equivalised disposable household income and equivalised household net worth.
Low income
Low income households are defined as households in the lowest equivalised disposable household income quintile, excluding the 1st and 2ndpercentiles (i.e. the 3rd to 20th percentiles inclusive). The 1st and 2nd percentiles are excluded due to the high wealth and expenditure characteristics those household exhibit, and the prevalence of income types other than employee income and government pensions and allowances.
Lower income
Lower income households is a measure used in the publication Housing Occupancy and Costs, Australia (cat. no. 4130.0) that is defined as households in the lowest and second equivalised disposable household income quintiles, excluding the 1st and 2nd percentiles (i.e. the 3rd to 40thpercentiles inclusive). The 1st and 2nd percentiles are excluded due to the high wealth and expenditure characteristics those household exhibit, and the prevalence of income types other than employee income and government pensions and allowances.
Main source of income
The income source from which the most positive income is received. If total income is nil or negative the main source is undefined. As there are several possible sources, the main source may account for less than 50% of gross income.
Margin of Error (MoE)
Margin of Error describes the distance from the population value that the sample estimate is likely to be within, and is specified at a given level of confidence. Confidence levels typically used are 90%, 95% and 99%. For example, at the 95% confidence level the MoE indicates that there are about 19 chances in 20 that the estimate will differ by less than the specified MoE from the population value (the figure obtained if all dwellings had been enumerated).
Mean housing costs
The total weekly housing costs paid by a group of households (e.g. couple only households) divided by the number of households in that group.
Mean income
The total income received by a group of units divided by the number of units in the group.
Mean net worth
The total or aggregate net worth of a group of units, divided by the number of units in the group. In this publication, the most common unit is the household.
Median housing costs
That level of weekly housing costs that divides a group of households into two equal parts, one half having housing costs above the median and the other half having housing costs below the median. Households with nil or negative total income are not included in this calculation.
Median income
That level of income which divides the units in a group into two equal parts, one half having incomes above the median and the other half having incomes below the median.
Median net worth
That level of net worth which divides the units in a group into two equal parts, one half having net worth above the median and the other half having net worth below the median.
Median ratio of housing costs to income
The ratio of weekly housing costs to gross weekly income is calculated for each household. The median is the level of that ratio that divides a group of households into two equal parts, one half having the ratio above the median and the other half having the ratio below the median.
Medicare levy
Medicare is Australia's universal health care system. The Medicare levy is a specific tax, based on individual income, intended to assist in the funding of this system.
Medicare levy surcharge
The Medicare levy surcharge is a levy, or an additional tax, on Australian taxpayers who do not have an appropriate level of private hospital insurance and who are earning more than the specified income threshold.
Mortgage
A mortgage is a loan taken out using the usual residence as security. An owner with a mortgage must still owe money from such a loan.
Multiple family household
A household containing two or more families. Unrelated individuals may also be present.
Negative income
Income may be negative when a loss accrues to a household as an owner or partner in unincorporated businesses, rental properties or other investment income. Losses occur when operating expenses and depreciation are greater than gross receipts.
Negative net worth
Net worth may be negative when household liabilities exceed household assets.
Net imputed rent
Gross imputed rent less housing costs. Net imputed rent is an estimate of the value of housing services that households receive from home ownership or by households paying subsidised rent or occupying their dwelling rent free. Housing costs for the purpose of calculating net imputed rent for owner-occupiers comprise:
- rates payments (general and water)
- body corporate fees
- the interest component of repayments of loans that were obtained for the purposes of purchasing or building
- rent payments
- house insurance costs
- repair and maintenance costs.
Net imputed rent from subsidised public rentals is included as a social transfer in kind for housing.
Net worth
Net worth is the value of a household's assets less the value of its liabilities. Net worth may be negative when household liabilities exceed household assets.
New dwelling
A dwelling is new if it was built under contract for the current owner, or was purchased from the builder/developer, and the current owners were the first household to live in the dwelling.
Non-dependent children
Persons aged 15 years and over who:
- do not have a spouse or offspring of their own in the household
- have a parent in the household
- are not full-time students aged 15–24 years.
Non-family household
A household that consists of unrelated persons only. Non-family households are classified to one of the following categories:
- Group household: a household consisting of two or more unrelated persons where all persons are aged 15 years and over. There are no reported couple relationships, parent-child relationships or other blood relationships in these households.
- Lone person household: a household consisting of a person living alone.
Non-financial assets
Non-financial assets are all assets other than financial assets. Examples include residential and non-residential property, household contents and vehicles.
Not in the labour force
Persons not in the categories employed or unemployed as defined.
Occasional care
A type of formal child care provided mainly for children who have not started school. These services cater mainly for the needs of families who require short term care for their children.
Occupation
Coded for all employed persons aged 15 years and over, using the Australian and New Zealand Standard Classification of Occupation (ANZSCO) (cat. no. 1220.0).
Offset accounts
An offset account is an account with a financial institution that is linked to a home loan. The balance in offset accounts reduces the interest charged on the loan.
One family household
A one family household is classified to one of the following categories:
- couple only - two persons in a registered or de facto marriage, who usually live in the same household
- couple family with dependent children - a household consisting of a couple with at least one dependent child. The household may also include non-dependent children, other relatives and unrelated individuals
- one parent family with dependent children - a household comprising a lone parent with at least one dependent child. The household may also include non-dependent children, other relatives and unrelated individuals
- other one family households: a household comprising:
- one couple with their non-dependent children only
- one couple, with or without non-dependent children, plus other relatives
- one couple, with or without non-dependent children or other relatives, plus unrelated individuals
- a lone parent with his/her non-dependent children, with or without other relatives and unrelated individuals
- two or more related individuals where the relationship is not a couple relationship or a parent-child relationship (e.g. two brothers).
One parent family with dependent children
See One family household.
One parent, one family household
A one family household comprising a lone parent with at least one dependent or non-dependent child. The household may also include other relatives and unrelated individuals.
Other dwelling
Includes caravans, houseboats, or houses or flats attached to a shop or other commercial premise.
Other education benefits
Social transfers in kind relating to special education (e.g. education for children who have physical disabilities) and other education benefits which could not be assigned to school or tertiary education. Other education benefits is a component of education benefits.
Other formal child care
A type of formal child care other than before and/or after school care, long day care, family day care, occasional care and vacation care.
Other health benefits
Includes social transfers in kind relating to public health services such as health promotion campaigns, occupational health and safety programs, food standards regulation, immunisation programs, breast cancer screening and screening for childhood diseases, as well as expenditure on health research. Other health benefits is a component of health benefits.
Other income
Income other than wages and salaries, own unincorporated business income and government pensions and allowances. This includes income received as a result of ownership of financial assets (interest, dividends), and of non-financial assets (rent, royalties) and other current receipts from sources such as superannuation, child support, workers' compensation and scholarships. Income from rent is net of operating expenses and depreciation and may be negative when these are greater than gross receipts.
Other source of deposit
Other sources of deposit include state/territory government grants, contributions from employers, loans from informal sources that are not family or friends, other loans, sale of car or other assets, and inheritance.
Other source of monetary assistance
Other sources of monetary assistance include state/territory government grants, contributions from employers, sale of car or other assets, and inheritance.
Other one family households
See One family households.
Other private income
Private income other than employee income, government pensions and allowance and income from own business. It includes superannuation, workers' compensation, child support and any other allowances regularly received as well as interest and property rent.
Other property loans
Principal outstanding on loans used to purchase, build, alter, or make additions to property rented out, loans taken out by people in rental properties who are buying or building a home somewhere else, and loans taken out for alterations and additions to other property. Where only a proportion of a loan is used for the property, only that proportion of the principal outstanding is included.
Other tenure type
A household which is not an owner (with or without a mortgage), or a renter. Includes rent free.
Own account worker
A person who operates his or her own unincorporated business or engages independently in a profession or trade and hires no employees.
Own unincorporated business income
The profit/loss that accrues to persons as owners of, or partners in, unincorporated businesses. Profit/loss consists of the value of gross output of the business after the deduction of operating expenses (including depreciation). Losses occur when operating expenses are greater than gross receipts and are treated as negative income.
Owner without a mortgage
A household in which at least one member owns the dwelling in which they reside and have no outstanding mortgage or loan secured against the dwelling. This can include households with dwellings that are jointly owned with someone who is not a member of the household.
Owner with a mortgage
A household in which at least one member owns the dwelling in which they reside and have outstanding mortgages or loans secured against the dwelling. This can include households with dwellings that are jointly owned with someone who is not a member of the household.
Participant of a shared equity scheme
Persons/Income Units/Households in the household who have a formal arrangement to purchase less than 100% equity in the dwelling. They may or may not be paying rent for the remainder. The remaining proportion of equity in the dwelling would be paid for and owned by another party in a shared equity arrangement, generally a government entity or a not-for-profit organisation.
Most shared equity schemes will allow the participant to purchase greater equity from the other partner(s) over time. This means that ultimately, they may become full owners.
Part-time employed
An employed person who usually works less than 35 hours per week.
Percentiles
When all households or persons in the population are ranked from the lowest to the highest on the basis of some characteristic such as their household income, they can then be divided into equal sized groups. Division into 100 groups gives percentiles. The highest value of the characteristic in the tenth percentile is denoted P10. The median or the top of the 50th percentile is denoted P50. P20, P80 and P90 denote the highest values in the 20th, 80th and 90th percentiles. Ratios of values at the top of selected percentiles, such as P90/P10, are often called percentile ratios.
Percentile ratios
Percentile ratios summarise the relative distance between two points in a distribution. To illustrate the full spread of the income distribution, the percentile ratio needs to refer to points near the extremes of the distribution, for example, the P90/P10 ratio. The P80/P20 ratio better illustrates the magnitude of the range within which the income or net worth of the majority of households falls. The P80/P50 and P50/P20 ratios focus on comparing the ends of the income distribution with the midpoint.
Perturbation
Adjustment of estimates to disguise individual values without affecting the statistical validity of aggregate data.
Pharmaceutical benefits
Includes social transfers in kind relating to pharmaceuticals provided outside of hospitals, aids and appliances used for health purposes and supplied in an ambulatory setting, glasses, hearing aids, wheel chairs, etc. Pharmaceutical benefits is a component of health benefits.
Preschool
Educational and developmental programs for children in the year (or in some jurisdictions, two years) before they begin full-time primary education.
Previous financial year exclusion flag
This item is available on the file to indicate records that could be regarded as out of scope when analysing previous year income data.
Previous financial year income
Income earned in the period July 2016 to June 2017.
Private dwelling
See Dwelling (private).
Private Health Insurance Rebate
Includes social transfers in kind relating to a rebate on private health insurance costs for members of a registered health fund. Private Health Insurance Rebate is a component of health benefits.
Private income
Current receipts from private organisations and other households, including wages and salaries, income from own business, superannuation, workers' compensation, income from annuities, interest, dividends, royalties, income from rental properties, scholarships and child support.
Private renter
See Renter - Private landlord.
Private trusts
Trusts other than public unit trusts. These include private unit trusts, fixed unit trusts, family trusts, charitable trusts and testamentary trusts.
Property
All residential and non-residential properties owned by persons in the household, excluding properties owned by the respondent's business.
Public unit trusts
A trust which issues units to the general public within Australia for the purpose of investing the pooled monies. A public unit trust must have registered a prospectus with the Australian Securities and Investments Commission (ASIC) and be governed by a trust deed between its management company and a trustee company. The units may or may not be listed on the Australian Stock Exchange. Includes property trusts, equity trusts, mortgage trusts, cash management trusts and public trading trusts.
Quintiles
Groupings that result from ranking all households or people in the population in ascending order according to some characteristic such as their household income or net worth and then dividing the population into five equal groups, each comprising 20% of the estimated population.
Ratio at top of selected percentiles
See Percentiles.
Recent home buyer
A household which bought their dwelling in the three years prior to the survey.
Reference person
See Household reference person and Income unit reference person.
Relative standard error (RSE)
The standard error expressed as a percentage of the estimate for which it was calculated. It is a measure which is independent of both the size of the sample, and the unit of measurement and as a result, can be used to compare the reliability of different estimates. The smaller an estimate's RSE, the more likely it is that the estimate is a good proxy for that which would have been obtained if the whole population had been surveyed.
Rent Assistance (RA)
Rent Assistance (RA) is a non-taxable income supplement paid through Centrelink to individuals and families who rent in the private rental market. It is only paid to recipients of another government benefit or pension, and paid in conjunction with that other benefit. This was previously known as Commonwealth Rent Assistance (CRA).
Repairs and maintenance
Repairs and maintenance refers to any work undertaken with the purpose of either preventing deterioration or repairing some aspect of the dwelling back to its original condition.
Renter
A household that pays rent to reside in the dwelling. See 'Landlord type' for further classification.
Rent free
Is a tenure arrangement in which the person or income unit or household does not pay any money for lodging and is not an owner of the dwelling.
Renter - Private landlord
In the Tenure and Landlord Type - household data item, this category comprises renters with landlord types:
- Real estate agent
- Person not in same household - Parent/Other relative
- Person not in same household - Other person.
Renter - other landlord type
In the Tenure and Landlord Type - household data item, this category comprises renters with landlord types:
- Owner/manager of caravan park
- Employer - Defence Housing Authority
- Employer - Government
- Employer - Other employer
- Housing co-operative/Community/Church group
- Other.
Rest of State
Under the Australian Statistical Geography Standard (ASGS), Rest of State is any area not defined as being part of the Greater Capital City Statistical Areas (GCCSAs). In the case of Australian Capital Territory and Northern Territory however, there is no Rest of State balance.
Salary packaging
An arrangement for the employer to remunerate the employee with a combination of cash wages and salaries and one or more non-cash benefits, to the value of the employee's total remuneration.
Salary sacrifice
An arrangement under which an employee agrees contractually to forgo part of the remuneration, which the employee would otherwise receive as wages and salaries, in return for the employer or someone associated with the employer providing benefits of a similar value.
School education benefits
Social transfers in kind relating to administration, inspection, support and operation of educational programs for preschool, primary and secondary school students. Government expenditure on the administration, inspection, support and operation of transportation services to students were included. Government expenditure on school medical and dental programs (which are included in other health benefits) and monetary transfers to households were excluded. School education is a component of education benefits.
Selected dwelling
The private dwelling selected in the sample for the survey.
Selected superannuation contributions for employees
Selected superannuation contributions comprise:
- The compulsory employer contributions required under the Superannuation Guarantee. These values have been imputed as the minimum amount that employers must contribute to employees’ superannuation accounts (9.5% in 2017–18). Where possible, employee income that is not covered by this legislation (such as overtime) has been excluded.
- Income salary sacrificed by employees into a superannuation account.
- Superannuation contributions from employers above the minimum compulsory payments.
After tax contributions by employees are not included.
Semi-detached, row or terrace house or townhouse
A dwelling with its own private grounds and no dwelling above or below. A key feature of this dwelling is that it is either attached in some structural way to one or more dwellings or is separated from neighbouring dwellings (usually by less than one-half metre). Examples include semi-detached, row or terrace houses, townhouses or villa units. Multistorey townhouses or units are separately identified from those which are single storey.
Separate house
A dwelling which is self-contained and separated from other houses (or other buildings or structures) by a space to allow access on all sides (usually at least one-half metre). This category also includes houses that have an attached flat (e.g. a granny flat). The attached flat will be included in the flat, unit or apartment category.
Shares
A share is a contract between the issuing company and the owner of the share which gives the latter an interest in the management of the corporation and the right to participate in profits. The "value of shares" excludes the value of shares held by individuals in their own incorporated business. Such shares are included in "value of own incorporated business".
Significant person
Significant persons are defined as follows:
- all members of lone person or couple only households
- all parents in a couple with children household or a single parent household
- the person aged 15 years or over in a group household where one person is aged 15 years or over and the other members of the household are less than 15 years old
- 50% of the persons aged 15 years and over in all other households.
Silent partner
Is a person who has some share or legal ownership in a business but who does not actively 'work' in that business.
Social assistance benefits in cash
Cash payments to persons from general government without any requirement to provide goods and services in return. Household social assistance benefits in cash are the sum of all household members' cash payments. The only difference between 'government pensions and allowances' and 'social assistance benefits in cash' is that overseas pensions are included in government pensions and allowances and private income and excluded from social assistance benefits in cash.
Payment categories for social assistance benefits in cash are defined as:
- Age pensions - Households that receive income from age pensions or Department of Veterans' Affairs (DVA) service pension.
- Disability and carer payments - Households that receive income from Carer allowance, Carer payment, Disability Pension Department of Veterans' Affairs (DVA) or Disability Support Pension.
- Family support payments - Households that receive income from Baby Bonus, Newborn Supplement, Paid Parental Leave, Dad and Partner Pay, Family Tax Benefits, Parenting Payments or Schoolkids bonus.
- Unemployment and study payments - Households that receive income from Austudy/ABSTUDY, Newstart allowance or Youth allowance.
- Other payments - Includes all other income support payments from the Australian government that are not included under Age pensions, Disability and carer payments, Family support payments and Unemployment and study payments. These include Partner allowance, Sickness allowance, Special benefit, War widow pension (DVA), Widow allowance, Wife pensions and other government pensions and allowances.
Social transfers in kind
Non-cash benefits and services provided by the government to households for education, health, housing, social security and welfare, and electricity concessions and rebates. It includes reimbursements of approved expenditures such as the Medicare rebate, the Private Health Insurance Rebate, the Child Care Benefit and the Child Care Rebate. The cost of administering the provision of social assistance benefits in cash is included.
Standard error (SE)
A measure of the likely difference between estimates obtained in a sample survey and estimates which would have been obtained if the whole population had been surveyed. The magnitude of the standard error associated with any survey is a function of sample design, sample size and population variability.
Statistical Area Level 1 (SA1)
Statistical Areas Level 1 (SA1s) have been designed as the smallest unit for the release of Census data. SA1s generally have a population of 200 to 800 persons, and an average population of about 400 persons. They are built from whole Mesh Blocks and there are approximately 55,000 SA1s covering the whole of Australia.
Statistical Area Level 4 (SA4)
Statistical Areas Level 4 (SA4s) are part of the ASGS and are used for the output of a variety of regional data, including the 2011 Census Data. There are 106 SA4s covering the whole of Australia without gaps or overlaps. They are built up from SA1s. In regional areas, SA4s tend to have populations of between 100,000 to 300,000 people. In metropolitan areas, SA4s tend to have larger populations (300,000 – 500,000 people).
State/territory government concessions and exemptions
Any exemption or concession for first home buyers on stamp (transfer) duty and/or mortgage duty payable to a state or territory government. All jurisdictions offered exemptions and/or concessions on stamp duty and/or mortgage duty to first home buyers in the survey period, normally subject to property value and income thresholds.
State/territory government grants
Any monetary grant paid to eligible first home buyers that is in addition to the First Home Owner Grant and introduced by a state or territory government. Some jurisdictions offered grants to first home buyers in the survey period.
Study loans
Study loans are debts incurred under Higher Education Loans Program (HELP), the government education payment scheme, and other government higher education schemes. They also include loans incurred prior to 2005 under the Higher Education Contribution Scheme (HECS) and the Student Financial Supplement Scheme (SFSS). A feature of these loans is that the obligation to repay them only exists when the student's income exceeds a threshold. The debt is also extinguished upon death. The HELP scheme includes several education payment schemes, including HECS-HELP and FEE-HELP. Study loans also includes student loans from other countries.
Superannuation
A long-term savings arrangement which operates primarily to provide income for retirement.
Superannuation/annuity income
Income from superannuation, annuities and private pensions such as allocated pensions.
Superannuation coverage
Persons aged 15 years and over were considered to have superannuation coverage if they:
- had a superannuation balance above zero,
- were receiving regular income from superannuation, or
- had received a lump sum superannuation payment in the last two years.
Taxes on income
Taxes on income is the sum of personal income tax plus the Medicare levy and Medicare levy surcharge for all members of the household. Taxes on income were imputed according to the 2017–18 tax rules which were applied to the gross income of family members according to their characteristics as reported in the 2017–18 Survey of Income and Housing.
Tenure type
The nature of a household's legal right to occupy the dwelling in which the household members reside. Households are classified to one of the following categories:
- Owner without a mortgage
- Owner with a mortgage
- Life tenure scheme
- Participant of shared equity scheme
- Renter
- Rent-free
- Other.
Term annuities
Term annuities are a fixed-term product that gives people a guaranteed income for a specified term. This involves a series of payments purchased with a lump sum, usually from an insurance company.
Tertiary education benefits
Social transfers in kind relating to the administration, inspection, operation and support of education programs at higher education institutions and colleges of technical and further education. Tertiary education is a component of education benefits.
Topcoding
Reduction of all high values to a specified maximum value.
Trusts
Any type of managed fund which involves the pooling of investors' money in order for a trustee or professional manager to administer that fund. Examples include listed and unlisted public unit trusts, cash management trusts, property trusts and family trusts used only for investment purposes.
Unemployed
Persons aged 15 years and over who were not employed during the week before the interview and had actively looked for full-time or part-time work at any time in the four weeks before the interview and:
- were available for work in the week before the interview,
- were waiting to start a new job within four weeks from the interview and would have started in the week before the interview if the job had been available then.
Unincorporated business
A business in which the owner(s) and the business are the same legal entity, so that, for example, the owner(s) are personally liable for any business debts that are incurred. The business may be registered (in their own state) as a sole trader, partnership or firm; however they are not registered with the Australian Securities and Investments Commission and are not legally a company.
Unsecured loan
A loan not requiring any security or collateral.
Vacation care
A formal child care service provided to school children during the school holidays.
Value of dwelling
The estimated value of the dwelling and its land, as estimated and reported by the respondent. The data are only collected for owners.
Vehicles
Vehicles include registered and unregistered vehicles used for private purposes including cars, trucks, buses, motorcycles, caravans, aircraft, boats and bicycles.
Vehicle loans
Principal outstanding on loans used to purchase motor vehicles. Where only a proportion of a loan is used to purchase a vehicle, only that proportion of the principal outstanding is included.
Wealth
See Net worth.
Worker's compensation payment
Monies paid by insurance companies and sometimes by employers as compensation for loss of earnings while unable to attend work due to an illness or injury. It can also be paid as compensation for an injury itself that was caused by an accident or injury at work.
Year of arrival in Australia
The year a person (born outside Australia) first arrived in Australia from another country, with the intention of staying in Australia for one year or more.
Abbreviations
| $ | Dollars |
| '000 | Thousand |
| ABS | Australian Bureau of Statistics |
| ACT | Australian Capital Territory |
| ACCS | Additional Child Care Subsidy |
| ARIA | Accessibility/Remoteness Index of Australia |
| ASGC | Australian Standard Geographical Classification |
| ASGS | Australian Statistical Geography Standard |
| ASNA | Australian System of National Accounts |
| ATO | Australian Taxation Office |
| Aust. | Australia |
| AWE | Average Weekly Earnings |
| CAI | Computer Assisted Interviewing |
| cat. no. | Catalogue number |
| CATI | Computer Assisted Telephone Interviewing |
| CAPI | Computer Assisted Personal Interviewing |
| CAWI | Computer Assisted Web Interviewing |
| CCB | Child Care Benefit |
| CCR | Child Care Rebate (formerly known as Child Care Tax Rebate: CCTR) |
| CCS | Child Care Subsidy |
| CNOS | Canadian National Occupancy Standard |
| COAG | Council of Australian Governments |
| COICOP | Classification of Individual Consumption According to Purpose |
| COVID-19 | Coronavirus disease of 2019 |
| CPI | Consumer Price Index |
| CURF | Confidentialised Unit Record File |
| DSS | Department of Social Services |
| DVA | Department of Veterans' Affairs (Australian Government ) |
| excl. | Excluding |
| EDHI | Equivalised Disposable Household Income |
| ERP | Estimated resident population |
| FBT | Fringe Benefits Tax |
| FISIM | Financial intermediation services indirectly measured |
| FTB | Family Tax Benefit |
| GFC | Global financial crisis |
| GFS | Government Finance Statistics |
| GMI | Gross mixed income |
| GOS | Gross operating surplus |
| GST | Goods and services tax |
| HEC | Household Expenditure Classification |
| HECS | Higher Education Contribution Scheme |
| HELP | Higher Education Loan Program |
| HES | Household Expenditure Survey |
| HH | Household |
| IU | Income unit |
| LER | Low Economic Resource measure |
| MoE | Margin of Error |
| MSHI | Main Source of Household Income |
| nec | Not elsewhere classified |
| nfd | Not further defined |
| NHHA | National Housing and Homelessness Agreement |
| no. | Number |
| NPISH | Non-profit institutions serving households |
| NSW | New South Wales |
| NT | Northern Territory |
| OECD | Organisation for Economic Co-operation and Development |
| PAL | Primary Approach Letters |
| PAYG | Pay-as-you-go tax |
| PBLCI | Pensioner and Beneficiary Living Cost Index |
| PHIR | Private Health Insurance Rebate |
| PPL | Paid Parental Leave |
| Qld | Queensland |
| RA | Rent Assistance |
| RBA | Reserve Bank of Australia |
| ROGS | Report on Government Services |
| RSE | Relative Standard Error |
| SA | South Australia |
| SA1 | Statistical Area Level 1 |
| SA4 | Statistical Area Level 4 |
| SE | Standard Error |
| SEIFA | Socio-Economic Indexes for Areas |
| SIH | Survey of Income and Housing |
| STIK | Social Transfers In Kind |
| Tas. | Tasmania |
| Vic. | Victoria |
| WA | Western Australia |
Downloads
SIH 2019–20 Data Item List
SIH–ASNA Income Comparison
SIH–ASNA Wealth Comparison
Data comparability between SIH and other ABS sources
Related Information
Household Income and Wealth, Australia - 6523.0
Housing Occupancy and Costs - 4130.0
Household Expenditure Survey, Australia: Summary of Results - 6530.0
Microdata: Household Expenditure, Income and Housing - 6540.0
Government Benefits, Taxes and Household Income, Australia - 6537.0