PHYSICAL ENERGY SUPPLY AND USE
KEY STORIES FOR NET ENERGY
Australia's net energy increased 2.2% to 23,738 petajoules (PJ) in 2016-17.
Energy supplied from:
- The environment (21,563 PJ)
- Imports (2,176 PJ).
Energy used by:
- Industry (2,810 PJ)
- Households (1,270 PJ)
- Accumulation (68 PJ)
- Exports (17,536 PJ)
- Conversions and losses (2,054 PJ).
KEY STORIES FOR GROSS ENERGY
Australia's gross energy increased 3.6% to 52,364 PJ in 2016-17.
Energy supplied:
- Natural inputs from the environment (21,563 PJ)
- Energy products by the economy (28,747 PJ)
- Residuals back to the environment (2,054 PJ).
Energy used:
- Natural inputs by Australian industry and households (21,563 PJ)
- Industry use 7,060 PJ transforming nature inputs into energy products for the economy
- Energy products by Australian industry (2,810 PJ plus 68 PJ accumulation), households (1,270 PJ) and the rest of the world (17,536 PJ)
- Flows of energy residuals back to the environment (2,054 PJ).
GROSS ENERGY SUPPLY
- 21,563 PJ was sourced from the environment, up 2.2% (467 PJ) on the previous year
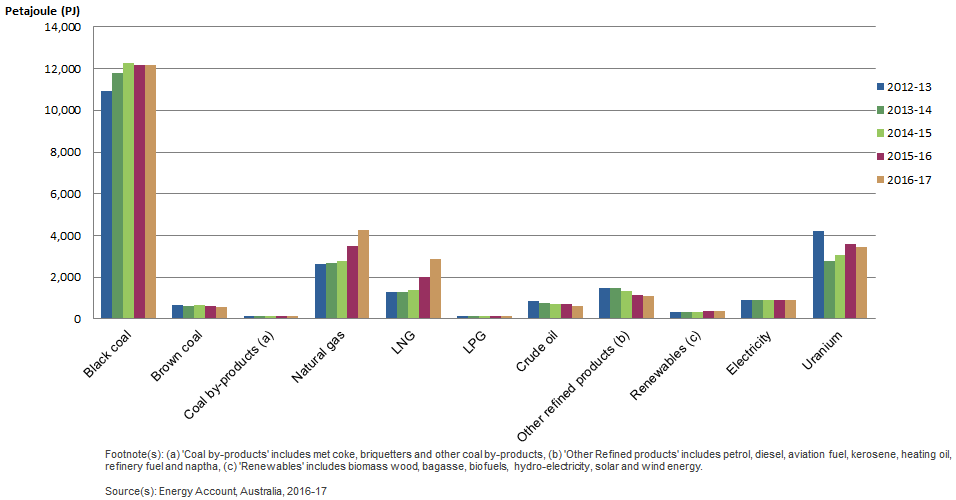
- Black coal (12,154 PJ), natural gas (4,372 PJ), uranium (3,429 PJ) and liquefied natural gas (2,864 PJ) were the largest sources of energy supply
- 26,571 PJ was supplied by the production of energy products by Australian industries
- 2,176 PJ was imported
- 2,054 PJ was supplied back to the environment as residuals.
Figure 1.1 - Gross domestic production of energy products, by product, Australia

INDUSTRY GROSS ENERGY USE
Use by Industries increased 4.5% to 31,435 PJ in 2016-17:
- 9,870 PJ through the transformation and end use
- Liquefied natural gas had strong growth (41.4%), pushing up energy used by industry for transformation.
HOUSEHOLD GROSS ENERGY USE
Households used 1,270 PJ in 2016-17, a 0.6% increase:
- Petrol increased 3.6% and solar energy increased 15.4%
- LPG use decreased 18.3%, diesel decreased 1.6% and electricity decreased 1.0%.
Figure 1.2 - Transformation & end use of energy products, by industry & households, Australia

 Quality Declaration
  Print Page
 Print All