MONETARY ENERGY SUPPLY AND USE
KEY STORIES FOR THE VALUE OF ENERGY
- Australia's supply of energy products worth $168 billion (23.2% increase) in 2016-17
- The value of coal increased by $21 billion (up 56.3%)
- Intermediate use of energy products increased by $6 billion (up 8.0%)
- Household final consumption of energy products increased by $2 billion (up 5.1%)
- Exports increased by $25 billion (up 42.2%), with coal exports increasing $20 billion (up 56.9%).
Energy supply
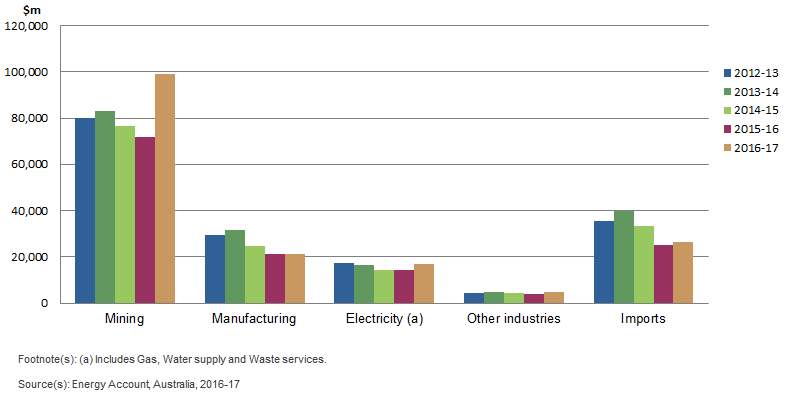
- The Mining industry produced 58.8% ($99 billion) of Australia's total supply of energy products in 2016-17, increasing $27 billion (37.8%)
- Imports produced 15.7% ($26 billion), with oil products about 27.7% ($7 billion) of this.
Figure 2.1 - Monetary energy supply, by industry and imports, Australia

Energy use
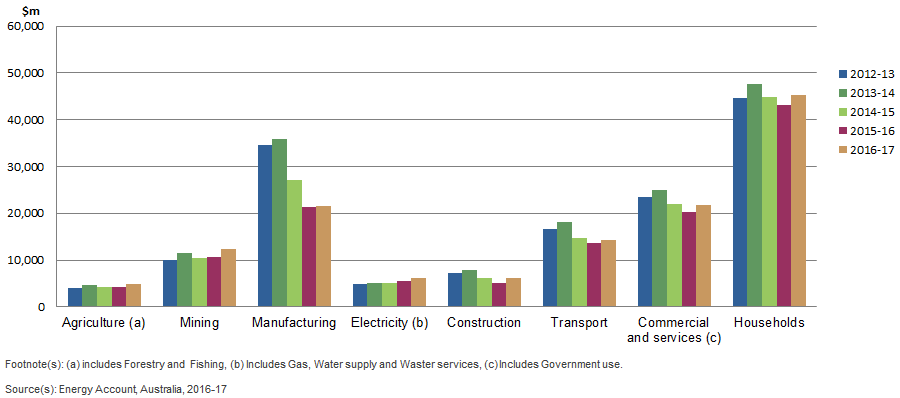
Figure 2.2 - Monetary energy use, by industry and households, Australia

- Households had more than a third ($45 billion) of Australia's total domestic energy use in 2016-17
- Just under half ($21 billion) of this use was expenditure on petrol products, while about a third ($16 billion) was expenditure on electricity and the remainder ($8 billion) on gas products
- The Manufacturing industry and Commercial and services industry each had around one sixth ($22 billion each) of Australia's total domestic energy use
- For Manufacturing, almost a third of this energy ($7 billion) was oil products, and for Commercial and services, over half ($12 billion) was electricity generation.
Energy exports
Figure 2.3 - Monetary exports, by products, Australia

- Australia's energy exports increased by 42.2% to $85 billion
- Coal exports were about 64% ($54 billion) of the total, while gas and oil respectively had 26.3% ($22 billion) and 6.3% ($5 billion).
 Quality Declaration
  Print Page
 Print All