| Dec Qtr 2022 to Mar Qtr 2023 (% change) | Mar Qtr 2022 to Mar Qtr 2023 (% change) | ||
|---|---|---|---|
| Selected Living Cost Indexes (LCIs) - Household type: | |||
| Pensioner and beneficiary LCI (PBLCI) | 2.2 | 7.3 | |
| Employee LCI | 2.0 | 9.6 | |
| Age pensioner LCI | 2.2 | 7.2 | |
| Other government transfer recipient LCI | 2.1 | 7.4 | |
| Self-funded retiree LCI | 1.3 | 7.1 | |
| Consumer Price Index (CPI) | 1.4 | 7.0 | |
In the March 2023 quarter, all five LCIs rose:
- Health, Housing, Food and non-alcoholic beverages, and Insurance and financial services contributed to the rises across all household types this quarter.
- Medical and hospital services rose due to an increase in non-hospital medical services, as general practitioners and other health service providers typically review their consultation fees in the March quarter, and the Medicare Safety Net (MBS) is reset on 1 January each year. This year, some private health insurance premiums also increased in January, contributing to the rise.
- Electricity prices rose due to price reviews in the September quarter 2022 reflecting higher wholesale prices. These price rises were partially offset, at the time, by the introduction of electricity rebates in Western Australia, Queensland, Tasmania, and the Australian Capital Territory. The unwinding of these rebates has seen the full effects of higher electricity prices reflected in the March 2023 quarter. Gas prices also rose reflecting higher wholesale gas prices being passed on by retailers, with rises in all eight capital cities.
- Food rose as Fruit and vegetables prices increased due to weather related impacts in 2022, and Snacks and confectionary prices rose due to higher input costs flowing through to consumers.
- Insurance and financial services rose due to increases in Mortgage interest charges.
| Main quarterly contributors to cost of living changes for each household type | |
|---|---|
| Pensioner and beneficiary (PBLCI) | Health (+8.6%) Housing (a) (+2.8%) Food and non-alcoholic beverages (+1.8%) Insurance and financial services (b) (+5.5%) |
| Employee | Insurance and financial services (b) (+8.1%) Food and non-alcoholic beverages (+1.5%) Housing (a) (+2.0%) Health (+3.4%) |
| Age pensioner | Health (+7.8%) Housing (a) (+3.0%) Food and non-alcoholic beverages (+1.8%) Insurance and financial services (b) (+4.4%) |
| Other government transfer recipient | Housing (a) (+2.9%) Health (+9.8%) Insurance and financial services (b) (+6.5%) Food and non-alcoholic beverages (+1.8%) |
| Self-funded retiree | Health (+4.3%) Food and non-alcoholic beverages (+1.6%) Insurance and financial services (b) (+4.4%) Housing (a) (+1.8%) |
- Housing includes Rents, Utilities, and Other housing (Property rates and Maintenance and repair of the dwelling).
- Mortgage interest charges is included in Insurance and financial services.
Pensioner and beneficiary, Age pensioner and Other government transfer recipient LCIs
- Pensioner and beneficiary and Age pensioner households recorded the largest quarterly rises across the five household types (+2.2%). Other government transfer recipient households recorded the second largest quarterly rise (+2.1%). Health and Housing were the main contributors for these household types.
- The cost of Pharmaceutical products rose due to the cyclical reduction in the proportion of consumers who qualify for subsidies under the Pharmaceutical Benefits Scheme (PBS). The safety net threshold for the PBS resets on 1 January each year.
- Pensioner and beneficiary, Age pensioner and Other government transfer recipient households pay concession prices for Pharmaceutical products. These households recorded a larger rise from the safety net threshold resetting compared with other household types.
- The PBS co-payment also changed from 1 January 2023, which had different impacts for different household types. The PBS co-payment rose for concession households but fell for non-concession households.
Employee LCIs
- Employee households recorded a rise of 2.0% with Insurance and financial services being the main contributor. Mortgage interest charges make up a higher proportion of spending for Employee households. Mortgage interest charges continued to rise this quarter (+11%), as banks passed on the Reserve Bank of Australia’s (RBA’s) cash rate rises to interest rates for variable and new fixed rate home loans.
Self-funded retiree LCIs
Self-funded retirees recorded the smallest quarterly rise (+1.3%). The lower rise for Self-funded retiree households is due to having the highest proportion of spending for International holiday travel and accommodation, which fell due to many destinations entering their off peak seasons.
Annual living costs
Over the past twelve months all LCIs rose by between 7.1% and 9.6%:
All household types recorded stronger annual rises compared to the CPI. The Pensioner and beneficiary household series commenced in 2008. The series for the remaining four household types commenced in 1999. Employee households recorded the largest annual rise (+9.6%). The last time the CPI recorded an annual rise of 9.6% was in 1986.
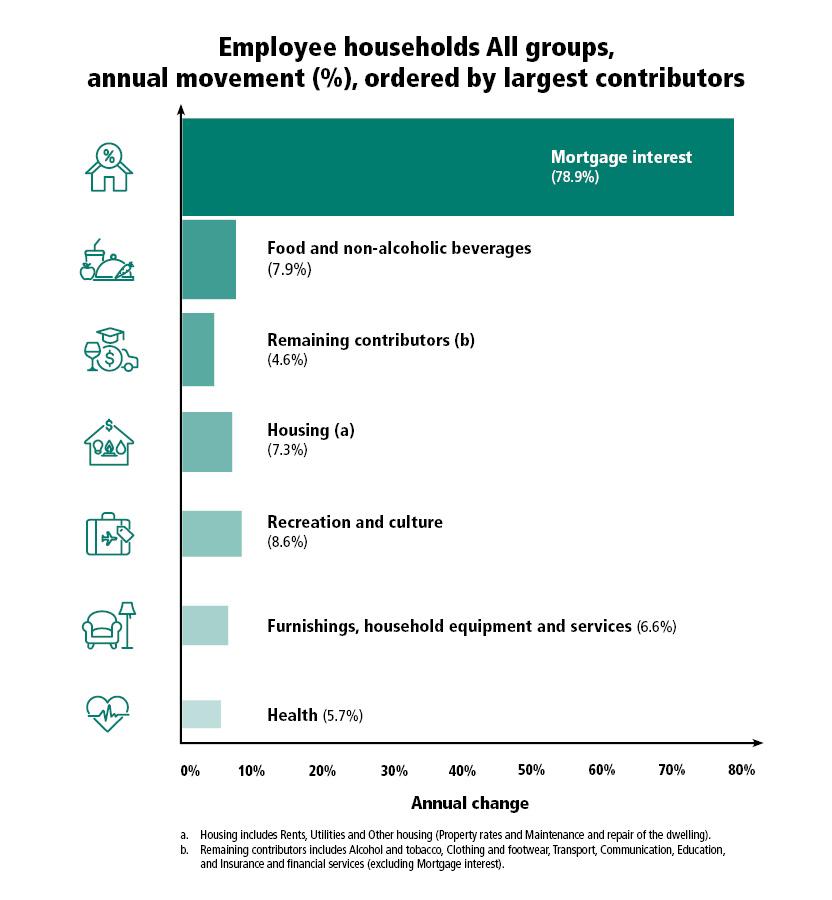
Mortgage interest charges was the main contributor for Employee households which rose strongly over the year (+78.9%), reflecting increases in home loan interest rates. Mortgage interest charges makes up a higher proportion of expenditure for Employee households.
Image
Description
Employee households All groups, annual movement (%), ordered by largest contributors to the All groups:
Mortgage interest, 78.9%
Food and non-alcoholic beverages, 7.9%
Remaining contributors (b), 4.6%
Housing (a), 7.3%
Recreation and culture, 8.6%
Furnishings, household equipment and services, 6.6%
Health, 5.7%
- The remaining four household types recorded rises between 7.1% and 7.4%, compared to the CPI which rose 7.0%. Housing and Food and non-alcoholic beverages were the main contributors across these household types.
- Self-funded retirees recorded the smallest annual rise (+7.1%), due to having the lowest proportion of expenditure for Mortgage interest charges in Insurance and financial services.
| Main annual contributors to cost of living changes for each household type | |
|---|---|
| Pensioner and beneficiary (PBLCI) | Housing (a) (+7.8%) Food and non-alcoholic beverages (+8.3%) Insurance and financial services (b) (+19.5%) Recreation and culture (+8.8%) |
| Employee | Insurance and financial services (b) (+43.1%) Food and non-alcoholic beverages (+7.9%) Housing (a) (+7.3%) Recreation and culture (+8.6%) |
| Age pensioner | Food and non-alcoholic beverages (+8.2%) Housing (a) (+8.4%) Recreation and culture (+9.7%) Insurance and financial services (b) (+11.9%) |
| Other government transfer recipient | Housing (a) (+7.4%) Food and non-alcoholic beverages (+8.3%) Insurance and financial services (b) (+28.5%) Recreation and culture (+7.3%) |
| Self-funded retiree | Recreation and culture (+10.0%) Food and non-alcoholic beverages (+8.0%) Housing (a) (+8.4%) Insurance and financial services (b) (+11.6%) |
- Housing includes Rents, Utilities, and Other housing (Property rates and Maintenance and repair of the dwelling).
- Mortgage interest charges is included in Insurance and financial services.