UNSC (2008) 2008 International Recommendations on Tourism Statistics. New York: United Nations Statistical Commission (UNSC), paras.2.21–2.25.
Ibid., para.2.4.
Ibid., para.2.9.
UNSC, 2008, para.4.2.
This is not the latest release View the latest release
Chapter 23 Satellite accounts
Australian System of National Accounts: Concepts, Sources and Methods
Reference period
2020-21 financial year
Released
9/07/2021
Introduction
23.1 A great strength of the 2008 SNA (and ASNA) framework is that its articulation allows a great deal of flexibility in its implementation while remaining integrated, economically complete, and internally consistent. A classic example of its flexibility is the development of satellite accounts where an account is linked to, but distinct from, the central system. Satellite accounts allow an expansion of the national accounts for selected areas of interest while maintaining the concepts and structures of the core national accounts.
23.2 There are two types of satellite accounts serving two different functions, namely those that involve:
- elaboration or extension of detail; and
- alternative concepts and classifications.
23.3 The first type involves some rearrangement of the classifications and the possible introduction of complementary elements, but they do not change the underlying concepts of the SNA. The main reason for developing such a satellite account is that to encompass all the details for all areas of interest as part of the standard system would overburden it and possibly distract attention from the main features of the accounts. Examples include environmental protection expenditure and information, communication, and technology satellite accounts.
23.4 The second type is mainly based on concepts that are alternatives to the SNA. These include a different production boundary, an enlarged concept of consumption or capital formation, an extension of the scope of assets, etc. This type may also involve changes in classifications, but the main emphasis is on the alternative concepts. It is a particularly useful way to explore new areas in a research context, i.e. they allow experimentation with new concepts and methodologies with a wider degree of freedom that is possible within the central system. An example may be the role of volunteer labour in the economy as well as the tourism satellite account.
23.5 Some sets of satellite accounts may include features of both types of satellite accounts.
23.6 The ABS has produced several satellite accounts over two decades. One of them is the Australian tourism satellite account (ATSA). The first issue was released in 2000 for the year, 1997-98. This account has been released annually in the ABS publication, Australian National Accounts: Tourism Satellite Account. The latest issue was released in 2020 for the years, 2004-05 to 2019-20. In 2020, a supplementary publication, the Quarterly tourism labour statistics, Australia, experimental estimates, commenced. The second one is an experimental Transport Satellite Account which the ABS released in 2018 for the period 2010-11 to 2015-16. The third one is a non-profit institutions satellite account. The ABS has released three non-consecutive accounts in the publication, Australian National Accounts: Non-Profit Institutions Satellite Account. The first issue was released in 2002 for the year, 1999-00. The latest account was published in 2014, based on data from the 2012-13 Economic Activity Survey, and a re-presentation of 2006-07 data on a 2008 SNA basis. The fourth one is an information and communication technology satellite account. This account was released in 2006 as Australian National Accounts: Information and Communication Technology Satellite Account, 2002-03.
23.7 The ABS has maintained an environmental statistical program since the early 1990s, when it began recording in the national balance sheet the value of those environmental assets falling within the SNA asset boundary. The environmental-economic accounts (''environmental accounts'') program has expanded markedly over the past decade; in particular, accounts related to water and energy have improved in their extent, quality, and frequency. Experimental accounts have been released in respect of spatial land accounts, waste, environmental protection expenditures and environmental taxes. The ABS aims to further improve the range, frequency and quality of its suite of environmental accounts.
23.8 The ABS has produced three papers to provide measures of unpaid work which is outside the production boundary as defined in the 2008 SNA but does constitute production in a broad sense. The latest publication is Unpaid Work and the Australian Economy, 1997. The ABS has not produced a household satellite account as such to date. A number of conceptual, methodological and funding issues would need to be resolved prior to its production, given there is no agreed standard for a household satellite account.
23.9 The rest of this chapter outlines the general approach the ABS has taken to produce the tourism, non-profit institutions and information and communication technology satellite accounts as well as the environment-related accounts. Also included is a discussion on the issues surrounding the production of a household satellite account, including an outline of the approach used to measure unpaid work. The ABS has a program of future work associated with satellite accounts and environmental accounting.
Tourism satellite account
23.10 The Australian tourism satellite account (ATSA) is based on the international standard, Tourism Satellite Accounts: Recommended Methodological Framework 2008 (TSA RMF) (Eurostat, the OECD, the UN Statistical Division and the UN World Tourism Organisation) which is an update of the first version published in 2000. Along with other statistical agencies, the ABS contributed to the TSA RMF development, and helped ensure consistency with the 2008 SNA.
23.11 The TSA provides a means by which the economic aspects of tourism can be drawn out and analysed separately; however, within the structure of the ASNA. The ATSA is set in the context of the whole economy so that tourism's contribution to major national accounting aggregates can be determined and compared with other industries.
23.12 The key aggregates of the TSA are:
- tourism consumption;
- direct tourism output;
- direct tourism gross value added (GVA);
- direct tourism gross domestic product (GDP); and
- direct tourism employment.
Scope of the TSA
23.13 The ATSA measures the direct impacts of tourism only. Indirect impacts are outside the scope of the ATSA; however, they are measured by Tourism Research Australia, using the tourism supply-use table.
23.14 A direct impact occurs where there is a direct relationship (physical and economic) between a visitor and a producer of a good or service.
23.15 Alternatively, the indirect effect of tourism consumption is a broader notion that includes downstream impacts of tourism demand. For example, a visitor buying a meal generates indirect effects for the food manufacturer, the transporter, the electricity distributor, etc., all of which provide the necessary inputs required to make the meal.
23.16 In the case of goods purchased by visitors, only the retail margin contributes to key tourism supply measures. This is because it is deemed that only the retailer has a direct relationship with the visitor and is, therefore, part of the tourism industry. The implication of this treatment is that the value added generated in the chain of supply of goods to visitors up to, but not including, the retail level will be treated as an ''indirect effect'' of tourism consumption, while only the value added generated from retail trade activities provided to visitors will be considered as a direct effect.
Concepts of Tourism
Tourism
23.17 An important conceptual distinction concerns the difference between travel and tourism, and consequently between a traveller and a visitor. The term 'tourism' in the international standards is not restricted to leisure activity. It also includes travel for business or other reasons, such as education, provided the destination is outside the person's usual environment. A person's 'usual environment' is defined by the 2008 International Recommendations for Tourism Statistics (IRTS) as:
. . . the geographical area (though not necessarily a contiguous one) within which an individual conducts his/her regular life routines.¹⁰⁹
23.18 Travel is a broad concept which encompasses the activity of travellers and includes commuting to a place of work, migration and travel for business or leisure. A traveller is defined by the 2008 IRTS as:
. . . someone who moves between different geographic locations, for any purpose and any duration.¹¹⁰
Visitors
23.19 The central statistical entity in tourism statistics is the ''visitor''. The scope of tourism in the international standards comprises the activity of visitors. A visitor is defined in the 2008 IRTS as:
. . . a traveller taking a trip to a main destination outside his/her usual environment, for less than a year, for any main purpose (business, leisure or other personal purpose) other than to be employed by a resident entity in the country or place visited.¹¹¹
23.20 If a person stays in the one place for longer than one year, their centre of economic and social interest is deemed to be in that place, so they no longer qualify as a visitor.
23.21 The following types of persons are not considered to be visitors:
- persons for whom travel is an intrinsic part of their job (e.g., bus driver, air crew);
- persons who travel for the purpose of being admitted to or detained in a residential facility such as a hospital, prison or long stay care;
- persons who are travelling as part of a move to a new permanent residence;
- persons who are undertaking military duties; and
- persons who are travelling between two parts of their usual environment.
23.22 Visitors can be classified into national and international visitors. National or ''domestic'' visitors consist of Australian residents who travel outside their usual environment within Australia. They include both overnight visitors, people that travel more than 40kms from home (staying one or more nights at a location) and same day visitors, people who travel over 50kms in a round trip, outside of their usual environment. International visitors are those persons who travel to a country other than that in which they have their usual residence.
23.23 The one-year rule for length of stay for an international visitor is consistent with the principle applied in determining residency which requires the length of stay in an economic territory to be less than one year to qualify as a non-resident. The ATSA includes as visitors all international students undertaking short term courses with an actual length of stay of less than one year. If a student stays longer than one year (ignoring short-term interruptions to their stay, for example at vacation break), their usual environment is deemed to be the school or university, and they do not fit the definition of a visitor. They are considered a visitor if they travel outside their usual environment.
23.24 The consumption of Australian residents travelling overseas (outbound visitors) is excluded for the purposes of measuring direct tourism gross value added and direct tourism GDP in the ATSA, except to the extent they consume domestically produced products before or after their overseas trip. This is because their consumption overseas does not relate to the value of goods and services produced within the Australian economy.
Tourism expenditure
23.25 Tourism expenditure covers actual expenditure by the visitor, or on behalf of the visitor, and is defined in the 2008 IRTS as:
...the amount paid for the acquisition of consumption goods and services, as well as valuables, for own use or to give away, for and during tourism trips. It includes expenditures by visitors themselves, as well as expenses that are paid for or reimbursed by others.¹¹²
23.26 As per the above definition, tourism expenditure also includes expenditure by visitors whose main purpose is business, even if this is totally or partly paid for by their employer. It also accounts for expenditure before or after the trip that related to the trip e.g. purchase of luggage or printing of photographs.
23.27 Some expenditure by Australians travelling abroad is also included in tourism expenditure. The purchase of these goods and services must be before or after the trip in Australian domestic territory. With the exception of inbound services provided by Australian international air carriers, anything that is purchased by an Australian whilst overseas is considered an import of a good or service.
Tourism consumption
23.28 Tourism consumption includes consumption by both domestic and international visitors.
23.29 It also includes imputations for consumption by visitors of certain services for which they do not make a payment. Imputed consumption in the ATSA includes:
- services provided by one household to the visiting members of another household free of charge, including the value of goods such as food and purchased services provided by host family/friends;
- housing services provided by vacation homes on own account (imputed services of holiday homes deemed to be consumed by their visitor owners); and
- imputed values of non-market services provided directly to visitors such as public museums even though these may be provided free or at a price which is not economically significant.
Direct tourism GVA and direct tourism GDP
23.30 Direct tourism GVA and direct tourism GDP are the major economic aggregates derived in the ATSA.
23.31 Direct tourism GVA is measured as the value of the output of tourism products by industries in a direct relationship with visitors less the value of the inputs used in producing those tourism products. Output is measured at basic prices; that is, before any taxes on tourism products are added (or any subsidies on tourism products are deducted). Taxes on tourism products include the GST, wholesale sales taxes and excise duties on goods supplied to visitors. Direct tourism gross value added is directly comparable with estimates of the gross value added of ''conventional'' industries such as mining and manufacturing that are presented in the national accounts.
23.32 Direct tourism GDP measures the value added of the tourism industry at purchasers' prices. It therefore includes taxes paid less subsidies associated with the productive activity attributable to tourism and will generally have a higher value than direct tourism value added. Direct tourism GDP is a satellite account construct to enable a direct comparison with the most widely recognised national accounting aggregate, GDP.
23.33 While direct tourism GDP is useful in this context, the direct tourism GVA measure should be used when making comparisons with other industries or between countries.
Endnotes
Classifications
23.34 Not all products and industries in the standard national accounts product and industry classifications are related to tourism. Therefore, the TSA distinguishes between products and industries that are related to tourism, and those which are not. Tourism related products and industries are further classified into tourism characteristic and tourism connected resulting in three categories of industry and product in the ATSA.
Tourism related products
23.35 Tourism characteristic products are defined as those products which would cease to exist in meaningful quantity, or for which sales would be significantly reduced, in the absence of tourism. Under the international TSA standards, core lists of tourism characteristic products, based on the significance of their link to tourism in the worldwide context, are recommended for implementation to facilitate international comparison. International TSA standards also recommend that country-specific tourism characteristic products are identified. In the ATSA, for a product to be a country-specific tourism characteristic product, at least 25 per cent of the total output of the product must be consumed by visitors.
23.36 Tourism connected products are those products that are consumed by visitors but are not considered as tourism characteristic products. These products are not typical to the tourism industry only.
23.37 All other products in the supply-use table not consumed by visitors are classified as ''all other goods and services'' in the ATSA.
Tourism related industries
23.38 Tourism characteristic industries are defined as those industries that would either cease to exist in their present form or would be significantly affected if tourism were to cease. Under the international TSA standards, core lists of tourism characteristic industries, based on the significance of their link to tourism in the worldwide context, are recommended for implementation to facilitate international comparison.
23.39 In the ATSA, for an industry to be a country-specific tourism characteristic industry, at least 25 per cent of its output must be consumed by visitors. Whether or not an industry is classified as characteristic has no effect on total value added resulting from tourism. This is because the ATSA measures the gross value added resulting from the production of products directly consumed by visitors, not the total gross value added generated by tourism related industries.
23.40 Tourism connected industries are those, other than tourism characteristic industries, for which a tourism related product is directly identifiable (primary) to it, and where the products are consumed by visitors in volumes which are significant for the visitor and/or the producer.
23.41 Industries that do not fall into characteristic or connected industries are classified as ''all other industries'', though some of their products may be consumed by visitors and are included in the calculation of direct tourism gross value added and direct tourism GDP.
Tourism satellite account framework
23.42 The supply-use tables for the Australian economy provide the framework in which data for visitor expenditure (demand) and industry output (supply) are integrated and made consistent in the ATSA benchmark process. Moreover, they provide the means of calculating direct tourism gross value added and direct tourism GDP.
23.43 The Supply table is a matrix showing (in the rows) the basic price values of products produced by each major industry. It also shows the supply of products from imports, and the net taxes on products and trade and transport margins that are required to derive supply at purchasers' prices. The Use table shows the use of each product, both as intermediate consumption by industries and in domestic final demand and exports. The use table also shows the primary inputs (compensation of employees and gross operating surplus) required by each industry.
23.44 The supply-use tables are brought to balance so that the supply of each product equals its use. Some disaggregation of the products and industries shown in the standard tables is required, as the objective of the ATSA is to focus on tourism-related products, and the industries that produce them. It is therefore necessary to augment the standard supply-use tables. The non-tourism products and industries are compressed for operational convenience in constructing the ATSA, but the details remain in the underlying supply-use tables.
23.45 An important characteristic of tourism products is that they are not uniquely defined by their nature, but by who purchases them. Therefore, the consumption of each product has to be divided into the part consumed by visitors and the part consumed by non-visitors. This information is used to partition industries into their tourism and non-tourism components, enabling the derivation of direct tourism value added and direct tourism GDP.
23.46 An important part of the compilation process is to check the consistency of data for visitor expenditures on products with the total supply of products. Apparent inconsistencies are resolved by further data investigations and adjustment.
Sources and methods
23.47 The data sources and methods used to compile the Australian TSA are outlined in detail in the ABS publication, Australian National Accounts: Tourism Satellite Account.
23.48 The usual TSA methodology involves estimating a full benchmark every third year. The method for compiling benchmark estimates involves the use of fully balanced supply-use tables that underlie the ASNA. Further, the latest industry data in respect of tourism related industries is incorporated. In order for tourism output and value added to be derived, the satellite accounts need to be supplemented with data from the demand side; that is, tourism consumption. Where there are extraordinary events, for example the COVID-19 pandemic, resulting in sudden structural change, the frequency and timing of the benchmark may need to be reviewed.
23.49 A number of steps are required to then compile direct tourism value added. These are detailed in the Australian National Accounts: Tourism Satellite Account. After removing product taxes and subsidies, margins and imports from internal tourism consumption (for each tourism product), it is possible to derive tourism product ratios to determine the output of each product consumed by tourists. Tourism intermediate consumption is then derived using relationships from the supply-use tables. Direct tourism gross value added is then estimated as direct tourism output less intermediate consumption required to produce this output, and sum for all industries in the economy,
23.50 It is not feasible to collect the detailed supply-side data required to produce a timely full-scale TSA every year. Therefore, the key aggregates are updated annually using relationships in the benchmark TSA and demand-side data that are available annually.
23.51 Where there is a structural change in tourism related industries or the general economy in the non-benchmark years, it is likely that there will be revisions when the next benchmark is compiled.
23.52 The main data sources are from:
- Tourism Research Australia – the National Visitor Survey and the International Visitor Survey; and
- The ABS – the Census of Population and Housing, the Household Expenditure Survey, the Balance of Payments and International Investment Position, the Economic Activity Survey, the Labour Force Survey and Overseas Arrivals and Departures.
23.53 Additional data sources are used in a benchmark year. They can be found in the ABS publication, Australian National Accounts: Tourism Satellite Account.
Transport satellite account
23.54 The experimental Australian Transport Economic Account (ATEA) released in 2018 covered the period 2010-11 to 2015-16 and presented information on the contribution of transport activity across all industries of the Australian economy.
23.55 For the purposes of the ATEA, total transport activity is the movement of people or goods from one location to another and is comprised of:
- For-hire transport activity, which is that activity undertaken on a fee for-hire basis in ANZSIC Division I Transport, postal and warehousing. This corresponds with transport as it is viewed in the national accounts.
- In-house transport activity within the four primary modes of transport – road, rail, air and water – as defined in the ANZSIC Subdivisions 46 to 49.
- The majority of this activity is own-account (or ‘ancillary’) output, which is not intended for market, and is consumed in the production of the industry’s primary output for example a retail business using its own truck to deliver goods from a warehouse to the retail outlet.
- In-house transport in this account also encompasses any secondary production of transport activity for market, outside of Division I.
- The In-house production of transport services in scope of the ATEA is restricted to the movement of people or freight that could potentially be outsourced to transport units in ANZSIC Division I. As such, Transport activity that cannot be disentangled from the primary production process of the unit is considered out of scope of the ATEA. However, there is no practical way to separately identify this activity, and it is likely that estimates include activity such as that of waste collection services and police and emergency services patrols.
23.56 To maintain links to the national accounts, transport services provided by households for their own use are not in scope of the ATEA.
Assumptions
23.57 The ATEA draws on existing datasets that were not designed for the purpose of an ATEA, and therefore a number of underlying assumptions have been made, which should be considered in interpreting results. These include the following:
- For each mode of transport, non-transport industries are assumed to exhibit the same input structure and production function of the Division I industry. For example, In-house Road Transport is assumed to have the same structure as that of the Road transport industry in Division I.
- All economic activity within Division I is assumed to be For-hire transport. No adjustments are made to exclude secondary activity undertaken within that industry that is not related to the provision of transport services.
- Division I products have not been used as an input to the In-House Transport industry, as it is assumed these activities will be captured within Division I.
- Extrapolation of the time series from base year data assumes that the relative use of in-house transport products remains constant over time.
International standards
23.58 There are currently no international standards or guidelines for developing a Transport Satellite Account, although their development is currently being considered by the Organisation of Economic Cooperation and Development (OECD). The methodology for the ATEA therefore closely followed that of the United States and Canadian accounts, with some variation due to differences in available data sources.
Methodology
23.59 The supply-use tables for the Australian economy provide the framework in which transport activity across the economy can be identified. Moreover, they provide the means of calculating transport gross value added and gross domestic product.
23.60 In broad terms, the ATEA involves reorganising the information in the supply-use tables in a way that is consistent with the ASNA framework and respects the same industries and classifications. In doing so, the ATEA introduces four new In-house transport industries within the supply-use framework – one for each of the four primary modes of transport: road, rail, air and water.
23.61 The supply of each of these new industries is compiled by identifying the inputs, both intermediate and primary, used in the production of In-house transport by non-transport industries. Each of these new industries only produces a single output, which is In-house transport relating to the specific mode.
23.62 These new in-house transport industries thus explicitly capture supply and use relating to in-house transport activity.
Identifying and calculating transport-related inputs
23.63 Estimates of inputs used in the production of In-house transport are identified from the supply-use tables in three components:
- Transport related inputs (TRIs) such as fuel, insurance and repairs, are inputs considered essential to transport activity. In the main, these inputs are used solely in the production of transport. An exception is fuel products, which have significant use for other purposes, such as the running of plant and machinery.
- Non-transport related inputs (NTRIs) are other intermediate inputs which are used in the production of In-house transport, but are not specific to transport. These may include inputs such as accounting services and office supplies.
- Primary inputs (value added components) include compensation of employees, gross operating surplus, and other net taxes on production.
23.64 For the ATEA, the new In-house transport industries are assumed to use the same input structures as those used in producing For-hire transport. NTRIs are imputed based on the ratios of TRI to NTRI in the corresponding For-hire industry, recognising that input structures vary between modes of transport produced.
23.65 Primary inputs, or value-added components of In-house transport, are calculated using the ratio of each value-added input to total intermediate inputs of the corresponding For-hire transport industry. Value-added components.
Taxes and subsidies
23.66 To complete the picture of transport's contribution to the economy, an estimate of taxes less subsidies on products is required. No such adjustment is necessary for in-house transport, as the input-based approach to measurement ensures its supply and use are already valued consistently. In principle, some net taxes on products for secondary production of transport within in-house transport is payable; however, it has not been estimated in this account due to its relative insignificance.
23.67 Taxes and subsidies on any products produced by the for-hire industries are allocated based on the contribution of each industry to the output of that product. For example, the 'Rail transport' industry (ANZSIC Subdivision 47) is the sole producer of the product ‘Rail passenger transport services’, so the full values for both taxes and subsidies on this product are allocated to this industry.
Secondary transport production and margins
23.68 In-house transport activity comprises of three distinct components:
- In-house transport activity for own use (ancillary production);
- In-house transport supplied to another institutional unit (secondary production); and
- Transport margins.
23.69 As In-house transport estimates in the ATEA have been built up from inputs related to transport activity, they represent all in-house transport activity, regardless of whether it has been supplied to another institutional unit or not. However, where transport activity is undertaken as secondary production, and services have been supplied to another institutional unit, output relating to this activity will already be captured in the supply-use tables. Thus, in-house transport output would be overstated with the introduction of the new transport products.
23.70 To prevent this overstatement, existing secondary production of transport services and transport margins are removed from the industries in which the activity occurred.
23.71 On the use side, an adjustment is also made to shift the total value of the transport margins to each of the new In-house transport products – Road, Rail, Air and Water.
Data sources
Economic Activity Survey
23.72 The Economic Activity Survey (EAS) produces estimates of the economic and financial performance of Australian industry, with the purpose of feeding into the National Accounts and several publications, specifically Australian Industry. These data have been incorporated in the ATEA to inform industry use of transport by mode, and transport specific use of fuel.
Supply-use tables (2010-11 through 2015-16)
23.73 This experimental ATEA has been compiled using supply-use tables, as incorporated in Australian System of National Accounts, 2016-17.
23.74 Employment and productivity relating to transport have been derived from both the Labour Force Statistics and Labour Account Statistics.
Non-profit institutions satellite account
23.75 A Non-profit institutions satellite account, highlights non-profit institutions (NPIs) within the national accounting framework. This account records the activities of market and non-market NPIs. The concepts and methods used in the Australian NPI satellite account are based on The Handbook on Non-profit Institutions in the System of National Accounts. The handbook was endorsed by the United Nations Statistical Commission in 2002. Chapter 23 of the 2008 SNA discusses and summarises non-profit institutions satellite accounts.
23.76 An NPI satellite account provides a means by which the economic aspects of NPIs can be drawn out and analysed separately within the structure of the main accounts. One of the major features of an NPI satellite account is that it is set within the context of the whole economy, so that NPIs' contribution to major national accounting aggregates can be determined.
23.77 The NPI satellite account has two dimensions. The first is referred to as measurement on a national accounts basis. This is equivalent to production and other economic aggregates as defined in the national accounts. Therefore, the estimation of output is based on whether the NPI is a market producer or a non-market producer in accordance with the ASNA. Consequently, NPI gross value added and NPI GDP are also consistent with the ASNA.
23.78 The second dimension is referred to as measurement on an NPI satellite account basis. This dimension extends the boundary of national accounts to include values for the non-market output of market producers and NPI services provided by volunteers. Measurement on an NPI satellite account basis provides a more complete picture of the value of NPIs to society than is evident in estimates included in the national accounts.
Non-market output of market producers
23.79 The non-market output of market producers measures that component of the output of market NPIs which is not captured when output of market units is valued under the standard SNA convention of valuation by sales. The handbook argues that if such an adjustment is not made to value any non-market output produced by market units, then the value of the output of market NPIs is understated as such units can produce significant amounts of output which are supported by charitable contributions or other transfers that is not evident in sales revenue.
23.80 The non-market output of market producers is valued as the difference between the output of market units when calculated by the standard SNA valuation method for non-market units of cost summation, and output as calculated by the standard SNA method for market units of valuation by sales. Where output on a cost valuation basis exceeds output on a sales valuation basis, the difference is taken to be the non-market output of market producers. Where output on a sales basis exceeds output on a cost basis, non-market output of market producers is assumed to equal zero.
Volunteer services
23.81 The UN handbook recognises that as volunteer labour is critical to the output of NPIs and their ability to produce a level and quality of service, it is important to capture and value this activity in the NPI satellite account. The handbook proposes three methods by which volunteer services can be valued. Each method involves assigning a wage rate to the total number of hours worked by volunteers.
23.82 The first such valuation method mentioned in the UN handbook is referred to as the "opportunity cost" approach. The notion behind this approach is that each hour of volunteer time should be valued at what the time is worth to the volunteer in some alternative pursuit. The applicable wage rate at which an hour of volunteer time is valued in this instance is therefore the wage rate associated with the usual occupation of the volunteer. The handbook recognises that while theoretically desirable for some analytical purposes, this valuation approach is not often used. The ABS has considerable reservations as to the appropriateness of this valuation method, as it assumes that paid work is foregone in order to undertake voluntary work. Most workers, however, have limited choices in the hours they work and are more likely to be giving up leisure time for voluntary work. This being the case, the opportunity cost should not be based on the wage they receive in the market but on the value they place on leisure. Valuation of goods and services at market prices is fundamental to national accounting. In this context, two volunteers involved in identical unpaid activity should be valued at the same hourly rate irrespective of what they could each earn in their paid occupations. Additionally, this method raises the issue as to which is the appropriate wage rate to apply to those volunteers who do not have a usual occupation, for example those who are retired or unemployed or otherwise not in the labour force.
23.83 The second valuation method proposed in the UN handbook is the "replacement cost" or "market cost" approach. This approach recommends that each hour of volunteer time be valued at what it would cost the organisation to replace the volunteer with paid labour. The applicable wage rate at which an hour of volunteer time is valued in this instance relates to the particular activity being undertaken by the volunteer. While this method is preferred over the opportunity cost approach, the value of volunteer services may be under or over-estimated using this approach depending on variations in the productivity of volunteers compared with labour provided to the market sector. The estimate of volunteer services included in this satellite account is based on this approach.
23.84 The UN handbook recognises that both the opportunity and replacement cost methods require more information on the activities in which volunteers engage than is likely to be available in most countries. Where detailed data on volunteering are not available, the handbook recommends a fall-back option which values each hour of volunteer time at the average gross wage for the community, welfare and social service occupation category. It argues that the work of volunteers is most likely to resemble this occupation category, and that the associated wage rate is conservative, and typically towards the low end of the income scale, but not at the very bottom.
Classifications
23.85 The classification system used in the Australian NPI satellite account is a reduced version of the classification that is recommended in the UN handbook, the International Classification of Non-Profit Organizations (ICNPO). ICNPO is fundamentally an activity classification, although inclusive of some purpose criteria. ICNPO permits a fuller specification of the components of the non-profit sector than the ANZSIC. In some instances, the detailed ANZSIC codes cut across several ICNPO groups and subgroups. In keeping with the current availability of data, a number of the broad level ICNPO groups have been combined, and estimates are not produced for classifications below the group level. A full version of ICNPO and the concordance between ICNPO and the ANZSIC classification are shown as part of the satellite account publication.
23.86 Data on voluntary work was collected using an activity classification which is similar to ICNPO, at least at the group level. A concordance between ICNPO and the type of organisation for which volunteers worked is also available.
Scope of the NPI satellite account
23.87 The Australian NPI satellite account does not attempt to measure the universe of entities that could be defined as NPIs. This is partly for practical and partly for conceptual reasons.
23.88 The UN handbook defines non-profit institutions in paragraphs 2.15 to 2.19 as organisations which are:
- not-for-profit and non-profit-distributing;
- institutionally separate from government;
- self-governing; and
- non-compulsory.
23.89 This definition forms the basis of what is included within the scope of the NPI satellite account.
Organisational existence
23.90 Organisational existence means that in order to meet the definition of an NPI, an entity must have some institutional reality and a meaningful organisational boundary separate and distinct from its members.
23.91 For the purposes of the satellite account, a practical means to identify that an entity meets this criterion is the existence of an ABN. Without an ABN, an entity cannot have employees or accept tax deductible donations. There are many non-profit groups in Australia who do not have an ABN, some of which if examined closely could be argued to have a separate organisational existence. The economic significance of such units is likely to be negligible if such groups are unable to employ or accept tax deductible donations.
Not-For-Profit and Non-Profit Distributing
23.92 To meet the definition of an NPI, an entity must be both not-for-profit and non-profit-distributing. This means that the organisation does not exist primarily to make a profit, and any surplus it accumulates must not be distributed to owners or members.
23.93 For the purposes of the satellite account, this means that units are excluded from the scope of the account if they are able to distribute surpluses to members, either on an ongoing basis or on liquidation. The handbook mentions that to the extent that they are able to distribute profits to members, co-operatives and mutual societies are excluded from the NPI sector. Also excluded from the satellite account on this basis are strata titles, credit unions and building societies and any other units classified to either the finance or insurance industries such as religious charitable development funds.
Institutionally separate from Government
23.94 To meet the definition of an NPI, an entity must be institutionally separate from government. This means that the organisation must have sufficient discretion with regard to both its production and use of funds, and that its operating and financing activities cannot be fully integrated with government finances.
23.95 For the purposes of the satellite account, this means that any unit classified to the general government sector is excluded on the basis that if the unit is sufficiently controlled by government to be included in the general government sector, its finances are integrated with those of the government and the unit is not sufficiently separate from government to satisfy this criterion.
Self-governing
23.96 To meet the definition of an NPI, an organisation must be self-governing. This means that the organisation must be able to control its own activities and is not under the effective control of any other entity.
Non-compulsory
23.97 To meet the definition of an NPI, an organisation must be non-compulsory. This means that membership or contributions of time and money cannot be required or enforced by law or otherwise made a condition of citizenship. A unit is still considered to be an NPI if membership is a necessary condition to practice a particular profession. For the purposes of the satellite account, this means that professional associations are within scope.
Sources and methods
23.98 The NPI satellite account has been compiled from a variety of data sources, including ABS economic and social collections. The sources used to compile the various data contained in the satellite account are outlined below.
Monetary aggregates
23.99 The bulk of the data contained in the NPI satellite account are monetary aggregates. This includes data about income, use of income, capital expenditure and asset stocks, as well as the national accounting measures of output of goods and services and gross value added.
23.100 The main data source for the NPI satellite accounts is the annual Economic Activity Survey or EAS. Over 4,000 NPIs were surveyed in the 2012–13 EAS, almost double the number of NPIs that were included in the 2006–07 survey. The survey covered all employing and significant non-employing non-profit organisations and collected a range of information from a sample of these organisations, including detailed information about their financial performance over the reporting period. The identification of NPIs on the ABS Business Register of organisations was reviewed and improved. This review led to the removal of some organisations, which are not NPIs for the purpose of the NPI Satellite Account, from the EAS and NPI organisation counts for 2012–13.
23.101 Micro non-employing non-profit organisations with turnover below a set threshold were excluded from the scope of the 2012-13 EAS. Information for these organisations was therefore taken from Business Activity Statement (BAS) data as collected by the Australian Taxation Office. Data available from BAS records included in the satellite account relate to sales and service income, labour costs (wages, salaries and superannuation), non-capitalised purchases and capital expenditure. Data for other survey questionnaire items, including transfers and donations paid and received, were not available from BAS records, nor was a suitable imputation method apparent for these items.
Employment and volunteers
23.102 Data in respect of permanent full time, permanent part time and casual paid employees of NPIs were also collected as part of the EAS. Given the nature of the administrative arrangements for deducting tax with respect to paid employees, the ABN based survey frame should cover all employing NPIs.
23.103 The 2006–07 EAS also collected information as to the number of volunteers that each organisation surveyed reported had worked for their organisation during the reporting period. More detailed information on volunteering was available from the ABS publication, Voluntary Work, Australia 2006 (cat. no. 4441.0); estimates from this publication were used for the satellite account. For this reason, the 2012–13 EAS did not collect information about volunteers. Updated estimates on voluntary work will not be available until 2015. Once the voluntary work data are available, the ABS will compile the number and contribution of volunteers to non–profit organisations for 2012–13. These data will be released in a second issue of this publication in June 2015.
Volunteer services
23.104 The compilation of data about the value of volunteer services involves taking information on the annual hours volunteered from the General Social survey and assigning a wage rate from the Employee Earnings and Hours publication. As detailed in the conceptual framework appendix, the Handbook on Non–Profit Institutions in the System of National Accounts recommends three alternative methods for estimating the value of volunteer services (see also paragraphs 23.61 to 23.64).
Information and Communication Technology satellite account
23.105 The Information and Communication Technology (ICT) satellite account developed by the ABS used the national accounts framework to present a picture of the value of transactions in ICT products within the Australian economy. One role of this satellite account was to review and, where necessary, make improvements to ICT data series used in the ASNA itself.
23.106 Satellite accounts such as tourism and non-profit institutions use a set of recommended classifications and frameworks developed from international research and discussion over a number of years, with international agencies usually taking the lead. There were no such guidelines available for an ICT satellite account, although there have been international initiatives on some aspects important to this work.
Framework for the ICT satellite account
23.107 The basic compilation framework for the ICT satellite account is the supply-use framework of the ASNA. It was adapted to focus on ICT products and the industries producing or distributing those products. Fundamentally, the system consisted of a supply table that tracked the supply of ICT products from imports and from Australian producers, and a use table that tracked the use of those products by industries, government, households and for export.
Concepts for the ICT satellite account
23.108 The concepts for the ICT satellite account were consistent with the ASNA and are outlined below.
ICT output
23.109 The value of ICT output was the market value of ICT goods and services produced within Australia. ICT output may be produced by units in any industry, though in practice the great majority of ICT output was produced by a small number of industries.
23.110 Capital goods produced on own account for own use were valued according to their estimated market value, or, if this was not possible, on the basis of production costs; that is, the value of labour and non-labour costs, and consumption of fixed capital used to produce the capital good. There are two significant ICT-related items of capital work produced on own account - own account computer software and own account production of telecommunication assets. The latter item relates wholly to telecommunication service providers and comprises the physical infrastructure required to put various telecommunication equipment in place (e.g. construction of mobile phone towers). All industries engage in producing computer software on own account.
ICT gross value added and ICT GDP
23.111 ICT gross value added at basic prices was measured as the value of output of ICT goods and services less the value of intermediate consumption inputs used in producing these ICT products. ICT gross value added is comparable with estimates of the gross value added of conventional industries such as mining and manufacturing as presented in the ASNA.
23.112 ICT GDP, on the other hand, measured the gross value added of the ICT industry at purchasers' prices. It therefore included taxes (less subsidies) on ICT related products. ICT GDP has a higher value than ICT gross value added.
23.113 ICT GDP was a construct to allow comparison with the most widely recognised national accounting aggregate, GDP. While it is useful in this context, the ICT gross value added measure should be used in comparisons with other industries and between countries. There is no generally accepted way to allocate deductible taxes such as GST to industry, and substantially different results can be obtained for industry GDP depending on the method chosen. This is a further reason for gross value added to be the preferred measure for industry comparisons.
ICT investment
23.114 ICT investment was gross fixed capital formation plus changes in inventories relating to ICT products. Gross fixed capital formation is the value of acquisitions less disposals of new or existing fixed assets. Assets consist of tangible or intangible assets that have come into existence from processes of production, and that are themselves used repeatedly or continuously in other processes of production over periods of time exceeding one year
ICT Government final consumption expenditure
23.115 Government final consumption expenditure is current expenditure by general government bodies on services to the community such as defence, public order and safety. Because these are provided free of charge or at prices which cover only a small proportion of costs, the government is considered to be the consumer of its own output. This output has no directly observable market value, and so is valued in the national accounts at its cost of production. In 2002-03, general government bodies in Australia did not produce any market output that could be considered ICT in nature and therefore government final consumption expenditure on ICT products was estimated as zero.
23.116 Current expenditure by general government bodies on such things as telecommunication services and computer services was treated as intermediate consumption by these units.
Scope and classifications
23.117 The scope of the ICT satellite account is effectively determined by the range of products (goods and services) defined as information and communication technology. At the time, the satellite account was published the Working Party on Indicators for the Information Society convened by the OECD has produced a draft 'Classification of ICT Goods' and was working on a classification of ICT services. The ABS had significant input into this work and the classification used by the ABS in ICT Industry Survey (ICTIS) 2002-03 was broadly consistent with, but not identical to, the OECD classification as far as it relates to goods. The OECD definition included a broader range of goods than the Australian definition. The Australian definition only included ICT goods if they were able to be networked or were components of goods that could be networked. It also excluded a range of medical, scientific and audio visual equipment.
23.118 The scope of 'ICT industries' relates closely to the set of ICT products defined above. ICTIS 2002-03 was a major data source for the satellite account and covered the main industries involved in the production and distribution of ICT goods in Australia. Its scope was broadly consistent but not identical with the OECD ICT Sector definition. The Australian definition only included ICT products if they were able to be networked or were components of products that could be networked. Units that manufactured or distributed products such as industrial process equipment were included in the OECD classification but excluded from the ABS classification.
23.119 Within the 'ICTIS industries', businesses were further classified as either ICT specialists or non-specialists. Businesses in these industries were defined as ICT specialists if more than 50 percent of their income was derived from production of ICT outputs.
Economy-wide ICT industry
23.120 An alternative view was to group all similar activities together as an 'industry', regardless of whether the ICT products were produced as primary activities of businesses that were commonly thought of ICT producers, or as secondary activities of businesses that were not regarded as ICT producers. For example, ICT products such as software produced as a secondary activity by businesses (and government organisations) outside the ICT industries would be included. Likewise, non-ICT products produced by ICT specialist industries would be excluded. This leads to a wider definition of the 'ICT industry'. The disadvantage of this view is that estimates of ICT gross value added on this basis require use of assumptions because it is not possible to collect all the required information on the costs of producing ICT products or the value of output.
23.121 This wider activity concept of an ICT 'industry' is clearer in practice where it involves actual sales of ICT products. Defining the boundary becomes more complicated where ICT goods and services are produced in-house for own use. For example, a bank (classified to the financial services industry) may use its own employees to provide help desk services, data processing, system maintenance and software development, etc., or it may purchase these services from other businesses. Where these services are purchased, and regardless of the source of the purchase, they become part of the economy-wide ICT industry for inclusion in the satellite account. In the national accounts, goods and services produced for own use are not regarded as part of output where they are consumed as part of the process of producing other goods and services. In that case, their value is reflected in the other outputs of the business; in this example, financial services. In-house ICT products are included as products in their own right in the national accounts, being products in the nature of gross fixed capital formation (e.g. software development).
23.122 In principle, the scope of the ICT satellite account could conceivably be defined to include all ICT activity including in-house activity. Using the above example of a bank, help desk activities could be separately valued and included as part of ICT output and value added. The services would be deemed as being both 'sold' and then 'purchased' by the bank for input to the production of financial services. This quickly becomes an artificial construct. Businesses make different decisions about which functions to outsource and which to provide in-house across a whole range of activities, including accounting, payroll, transport, storage, recruitment and so on. In practice, it is not possible to collect the information required or to satisfactorily value such activities provided in-house.
23.123 An 'economy-wide' scope was adopted in the satellite account. ICT products produced in-house for own use were excluded from the output and use of ICT products, apart from in-house production of ICT capital goods (software and telecommunication assets).
Sources and methods
23.124 The ICT satellite account data was sourced primarily from ABS collections, namely:
- ICT Industry Survey (ICTIS)
- Economic Activity Survey
- Balance of Payments and Trade
- Government Technology Survey
- Household Use of IT Survey
- Business Use of IT Survey
- Internet Activity Survey
- Surveys of Research and Experimental Development
- Household Expenditure Survey
- Labour Force Survey
23.125 As previously mentioned, the basic compilation framework for the ICT satellite account was the national accounts 'supply and use' system. It was adapted to focus on ICT products and the industries producing or distributing those products. Fundamentally, the system consisted of a supply table that tracked the supply of ICT products from imports and from Australian producers, and a use table that tracked the use of those products by industries, government, households and for export. In order to satisfy the identity that the supply and use of products must be equal, discrepancies due to deficiencies in the source data were identified and resolved. A great strength of the framework was that it facilitated this data confrontation and provided a basis for optimising the quality of the overall estimates in the face of deficiencies and gaps in data coverage.
23.126 International experience showed that the measurement of ICT transactions was not easy, particularly given the intangible nature of software, the licencing and leasing arrangements involved and the bundling of ICT products. It was therefore inevitable that a range of significant data and other issues required close attention in producing the ICT satellite account. An outline of these issues is provided in Appendix 5 of the Australian National Accounts: Information and Communication Technology Satellite Account, 2002-03 (cat. no. 5259.0). Inevitably, a number of judgement calls were necessary to integrate the data. Consequently, the results were considered experimental.
Household satellite account and unpaid work
Household satellite account
23.127 The 2008 SNA recommends inclusion of part of households' non-market production within the production boundary and the use of a satellite account for recording the other part. The 2008 SNA production boundary includes subsistence production in agriculture, other goods produced by households for their own consumption, the own-account construction of dwellings and housing services provided by owner-occupied dwellings, and paid services of domestic servants in the household sector. Excluded are services generated from unpaid work, including services for the producing household, services for other households and volunteer and community work.
23.128 The 2008 SNA suggests that, in practice, goods produced in households for own use are to be included within the production boundary if the production is believed to be quantitatively important in relation to the total supply of those goods in the country concerned. The ASNA includes an imputation for the market value (less the input cost) of the more common types of such production in Australia (fruit, vegetables, eggs, beer, wine and meat) for inclusion in estimates of household final consumption expenditure. An estimate for such 'backyard production' is also included on the income side of the accounts, as part of gross mixed income.
23.129 A number of commentators, including Ironmonger¹¹³, have expressed concern that the production boundary records only a partial picture of the production of household goods and services and the accompanying use of capital and labour. For example, household members can obtain goods and services by buying them from the market. This activity is fully captured in the national accounts. Households can also produce goods and services entirely themselves, using their own labour and capital. While such production of goods will be captured if it is significant, the production of services (other than housing services provided by owner-occupied dwellings) is not measured in the national accounts. The use of market inputs would be measured in the national accounts to the extent that the non-market production of services involves the use of market inputs.
23.130 The exclusion of most forms of household non-market production of services from the national accounts is due, in part, to the difficulties in measuring non-market output. In particular, non-market activities, by their very nature, must be valued using imputations and it is not always clear what these imputations should be. Also, it is more difficult to define non-market production than to determine the scope of market activity. Because of these concerns, national accountants generally hold the view that broadening the accounts to include a wide range of non-market activity would produce a less useful tool for analysing overall economic activity.
23.131 Nonetheless, as economic activity crosses over from non-market to market, or vice versa, this can lead to distortions in the accounts. A classic example is the marriage of a housekeeper to his or her employer. Prior to the marriage, the housekeeper's output (presuming that housekeeper was being paid a wage) was included in GDP. After the marriage, the same output is excluded if the new spouse is not paid a wage; however, there has been no change in underlying economic activity. Only the institutional arrangements underlying the activity have changed.
23.132 In order to provide a more comprehensive picture of economic activity, the 2008 SNA suggests that satellite accounts be used. Household satellite accounts are where the concepts, in particular the production boundary, underlying the core accounts are altered, but they do this in such a way that there are clear linkages with the core accounts. These can be compiled in both monetary and non-monetary terms. Thus, it would be possible, for example, to make non-monetised comparisons based on time spent in formal and informal economic activity as well as to monetise unpaid work, if so desired. Therefore, a household satellite account can provide comprehensive information on household economic activity within a framework that is consistent with the core national accounts, without subjecting the core accounts to the vagaries associated with defining and measuring household non-market output.
23.133 It is possible to widen the scope of household activity to look at frameworks that encompass not only household production but also describe consumption, saving and accumulation of wealth activities in households. This could be done at either the macro or micro level; that is, at the level of the household sector as a whole or disaggregated by types of household. A macro framework has been developed by Eurostat and a provisional micro framework has been developed by the ABS. Statistics Netherlands has developed a framework that seeks to show macro-micro linkages. Each of these frameworks is discussed below.
Valuation approaches
23.134 As mentioned above, one of the main issues in measuring non-market household production is to determine an appropriate method for valuing the production. Three approaches have been suggested:
- the unpaid work approach;
- the input approach; and
- the output approach.
23.135 The most common method used to date has been the unpaid work approach, which takes account only of (unpaid) working time and its imputed value. ABS studies to date have used this approach.
23.136 The input approach values household production as the sum of the values of all its inputs: time use, intermediate consumption, and capital costs.
23.137 The output approach values household production at its imputed output value, in the same way that in-scope household non-market production is valued in the core national accounts.
Unpaid work approach
23.138 The essence of this approach is to multiply hours of unpaid work, usually obtained from a time-use survey (TUS) by an appropriate wage rate. The first Australian unpaid work study, published in 1990, used data from a 1987 pilot TUS. Three basic methods of valuation were used:
- the opportunity cost method;
- the individual function replacement cost method; and
- the housekeeper replacement cost method.
23.139 Each of these methods used wage rates that were on a 'before-tax', or gross, basis.
23.140 The second study, completed in 1994, used data from the first national TUS of 1992, and retained these three methods. It refined the housekeeper replacement cost method, and also distinguished between a gross opportunity cost method and a more appropriate net opportunity cost method, based on after-tax wage rates. The individual function and housekeeper replacement cost methods remained on a gross basis.
23.141 The third Australian study, completed in 2000 and based on the results of the 1997 national TUS, used the same methods as the second study. The study also introduced a hybrid of the individual function and housekeeper replacement cost methods.
23.142 A more detailed discussion of this approach is outlined in the Unpaid work section below.
Input-based approach
23.143 Under this approach, the household is regarded as a production unit in which commodities and services are produced by combining work, intermediate consumption and household durables. This approach allows for better integration of household production into the system of national accounts. The formula used is as follows:
| Value of labour | |
| + | wages paid to domestic servants |
| + | taxes less subsidies on production |
| = | net value added |
| + | consumption of fixed capital |
| = | gross value added |
| + | intermediate consumption |
| = | gross output |
23.144 This formula is similar to that used in the national accounts to value the non-market output of the general government and non-profit institutions serving households sectors. The input-based approach was used by the German Federal Statistical Office in its estimates of the value of German household production in 1992.
23.145 The input-based method is used to measure the non-market output of households, such that the value of labour component relates to unpaid labour. Accordingly, the observations in the preceding section on the unpaid work method also pertain to this component.
23.146 The taxes less subsidies on production component refers to transfer payments made by households to governments and vice-versa that are recorded as secondary income transactions in the core national accounts but would be considered to relate to non-market household production. These transfer payments would then be reclassified in the household satellite account.
23.147 The consumption of fixed capital component relates to the depreciation of household durables used in the household production process. In the core accounts, purchases of durables (e.g. motor vehicles, refrigerators, washing machines) by households are recorded as final consumption expenditures and not as capital formation. In the satellite accounts, household expenditure on consumer durables would need to be reclassified from final consumption to gross fixed capital formation.
23.148 The more difficult aspect of measuring the consumption of fixed capital component would be in actually determining the appropriate amounts of depreciation in each period. The 'perpetual inventory method' (PIM) would require information about the decline in the efficiency of assets as they age, asset lives, the distribution of these lives about the average life, and changes in the price of assets. The ABS currently provides estimates of the stock of household durables as a memorandum item in the national accounts balance sheets. These data could be used as a starting point for deriving estimates of consumption of fixed capital.
23.149 The intermediate consumption element would consist of goods and services acquired by households that are used up in household production. To the extent that this production fell outside the production boundary, measuring the associated intermediate consumption would require identifying and reclassifying expenditures treated as final consumption in the core accounts. For some goods or services, it would be reasonable to assume that all expenditure on them should be classified to intermediate consumption. For example, meat purchases would all be classified to intermediate consumption because meat products generally have to be prepared or cooked before they are ready for a meal. Other goods or services could be used in production or as final consumption. For example, ice-cream can be eaten as such or used as an ingredient in desserts. As it is usually eaten directly, it would probably be allocated to final consumption. On the other hand, fruit, even though it is eaten mostly fresh, might have to be allocated to intermediate consumption as most fruits that are eaten fresh need to be rinsed, peeled, stored and distributed. The alternative to allocating expenditure on a particular product to either intermediate consumption or final consumption would be to split expenditure based on studies of the use of the product.
23.150 In deciding which expenditures should be classified as capital and intermediate in the household satellite account, the ABS would consider work already undertaken internationally in this area.
23.151 Estimates of household production developed using the input-based method could be presented in their own right or used to develop alternative estimates to those shown in the core accounts.
Output based approach
23.152 In the output-based valuation method, the gross output from household non-market production is valued by multiplying the volume of household output for different activities by market-equivalent prices for each activity. The rationale for this approach is that market goods and services could replace those generated in the household; therefore, the most appropriate way of valuing household non-market production is to use the prices of similar market production. Under the output-based method, the gross value added in household production is equal to the value of gross output less the value of intermediate inputs (where intermediate inputs are as described in the preceding section).
23.153 This method is considered to be the best for comparisons with national accounting aggregates, which are generally based on the use of market prices for valuing output. Valuing output in this way ensures that outputs are valued independently of their inputs, and avoids problems arising because of productivity differences between market and non-market producers.
23.154 The output-based approach resolves the issue of the joint production of services through simultaneous or parallel uses of time. The value of the labour used simultaneously can be found by deducting intermediate inputs and capital costs from the market value of the joint outputs.
23.155 The data requirements for the output-based approach are extensive and not readily available, particularly data on the volume of household output for different activities and corresponding market-equivalent prices. For this reason, there have been very few output-based studies to date.
Examples of household satellite accounts
Input-output tables
23.156 A satellite account for household production could be presented in the form of an input-output table. Such a presentation would provide breakdowns of the value added (into capital and labour components) and intermediate consumption (into the various types of products used up in the production of household output) for each type of household output. Non-household production would also be shown so that the relationships between the economic activity of households and that of the other sectors of the economy could be explored. Supplementary information on the volume of household outputs or the time spent in the production of the outputs could also be shown. The value of household outputs could be derived using either the input- or output-based methodologies.
23.157 Ironmonger and others have argued that the development of such an input-output table is essential for a proper analysis of household economic activity. Thoen lists the advantages of placing household production within an input-output framework:
Household production can be linked to the SNA through the development of a satellite account with links through 'personal expenditures' which are common to both accounts: the complex interdependence between household and market activities in terms of the raw materials, intermediate goods and services, or labour inputs required to produce outputs can be analysed within a familiar accounting framework: the impact of macroeconomic policy on the 'household sector of the economy' can be analysed in terms of the substitutability of market supplied services for household production and the household capital/labour ratio and, consumer demand can be linked to the underlying household activities.¹¹⁴
23.158 Deriving a household satellite account in the form of an input-output table would be a more difficult exercise than deriving estimates of household production in aggregate because each of the components of production (labour, capital and intermediate consumption) would have to be allocated across the various types of household products. Ideally, this would be done based on studies of the various types of household activities. In the absence of pre-existing studies, it would be expensive to undertake such studies and it is highly unlikely that such expense could be justified. Alternatively, in cases where the allocation of a component is not clear-cut, indicators (such as the time spent on activities) could be used as a basis of allocation. This would reduce the usefulness of the input-output approach, as any analysis based on the relationship between inputs and outputs would be affected by (unknown) errors in the allocation process.
Eurostat proposal
23.159 Eurostat commissioned Statistics Finland to develop a harmonised satellite system of household production. The Eurostat proposal is based on the European System of National and Regional Accounts (ESA 95), which is broadly consistent with the 1993 SNA. While Eurostat acknowledges that the output-based method has analytical advantages compared with the input-based method, it advocates the latter as the basis for measuring household production as there are currently insufficient data available to implement the former. The proposal however recognises that an output-based method could eventually be implemented. The focus of the system is the production account. The proposal has guidelines for adjusting the core income and capital accounts to provide comprehensive information on the consumption, income, saving and wealth of households. Such information would increase the analytical usefulness of the system as a whole.
23.160 If a satellite production account could be compiled that covered household production comprehensively, relatively little effort would be required to compile consistent income and capital accounts along the lines suggested in the Eurostat proposal.
Household income, consumption, saving and wealth (ICW)
23.161 The ABS has been at the forefront in the development of a conceptual framework for household income, consumption, saving and wealth (ICW). This framework was developed by the ABS in response to the process of revising the provisional 1977 United Nations (UN) Guidelines on Distribution of Income, Consumption and Accumulation of Households (known as M61). The UN guidelines were issued to assist countries to collect and disseminate income distribution statistics and to provide for international reporting and publication of comparable data. The provisional guidelines had a particular emphasis on linking income distribution statistics to current national accounting standards; they relate to the 1968 version of the System of National Accounts. There have been continuing demands for revisions to the 1977 UN guidelines to supplement the 1993 SNA. In particular, a need is seen to broaden the concept of income and develop analytical techniques to measure income inequality.
23.162 The ABS framework, published in A Provisional Framework for Household Income, Consumption, Saving and Wealth, describes how the range of flows and stocks of household economic resources can be brought together to provide a comprehensive measure of economic wellbeing for individual households. The framework also provides a conceptual link between these components of individual household economic wellbeing and those of the national economy as a whole. As such, the concepts and terminology used in the ICW framework are consistent with those used in the national accounts. Concepts, definitions and terminology have been modified where necessary because the focus of the ICW is on the individual household, rather than the household sector.
23.163 More specifically the framework is designed to allow for the measurement of:
- a household's power or command over economic resources;
- the extent to which a household is able to both consume and accumulate wealth and to make choices between these options; and
- the changes that take place in a household's economic wellbeing over time.
23.164 Together, these measures constitute a model that reconciles the various elements of income, consumption and net worth at the individual household level. Such a reconciliation will enable derivation of measures of both household saving and total accumulation of wealth. The ICW presents a synthesis between economic and social statistics, particularly as they relate to the household economy. The framework, however, has a provisional status, and the ABS has not yet begun to make it operational.
23.165 It is worthwhile elaborating on the differences between the ICW and the Eurostat satellite accounting system for the household. Eurostat's system focuses on the macro-side of the economy, with the household sector being the main statistical unit. The production side of the household economy tends to be the central area of analytic interest. Production and generation of income accounts are seen as 'crucial' for the system of household satellite accounts. The input-output tables are a detailed elaboration of the household production account but represent only one part of a system of accounts for the household sector. The Eurostat framework does not provide as detailed an insight into the income flows and financing decisions of households as the ICW system does. It has guidelines for an extended system of accounts that describes the behaviour of the household sector in relation to consumption, disposable income and wealth. The ICW focuses on the micro-side of the economy, with four possible statistical units to measure the economic wellbeing of the population: persons, households, families and income units. The area of analytic interest is broader than the Eurostat central focus on production, with emphasis on how economic resources are mobilised within households and affect the different variables of household income, consumption, saving and wealth. Considerable work would be needed to further integrate the two systems. Integration would give better information on the dynamics of individual households, the household sector and the linkages to the market economy.
The Netherlands approach
23.166 The Netherlands Central Bureau of Statistics started the development of satellite accounts of household production in 1991, using data from their national TUS conducted in 1987. Another TUS was conducted in 1998 and the data from that TUS are to be incorporated in the development of a System of Economic and Social Accounting Matrices and Extensions (SESAME), a form of a social accounting matrix (SAM). Traditionally, SAMs have been applied to specific types of analysis, focusing on causes and consequences of various aspects of inequality among household groups.
23.167 A SESAME is a 'core' SAM that has associated satellite tables and it provides a set of monetary and non-monetary macro-indicators potentially encompassing social, economic and environmental change. Such an integrated set of satellite tables can show:
- various stocks underlying the SAM flows, such as size and composition of the population by household group (including the potential labour force), production capacity by industry and the possession of assets (e.g. agricultural land, consumer durables and financial assets) and liabilities (e.g. external debts) by sub-sector;
- a decomposition of (changes in) values into (changes in) volumes and prices: this refers not only to products but also to various categories of labour services, and to fixed capital formation by industry;
- related non-monetary socioeconomic indicators, such as life expectancy, infant mortality, adult literacy, nutrient intake, access to (public) health and education facilities, and housing situation by household group; and
- some re-routings (e.g. final consumption by household group paid for by government and non-profit institutions serving households).
23.168 The Dutch system utilises an extra layer of operational principles to define the framework of its SAM for the household economy. In addition to defining productive activities by utilising the third person criterion (Chapter 3), it also defines productive activities in terms of formal and informal activities. The operational principle used is as follows:
23.169 Informal activities are productive activities which do not contribute to the national income as currently defined, and in which unpaid labour is involved.
23.170 When these principles are operationalised into a SAM there is a consistent representation of both the production processes and the income distribution and income spending processes. The system makes explicit the linkages between the formal and informal economies in terms of production and income generation and distribution and has entry points for data on fixed capital and consumption of fixed capital in the informal economy.
23.171 A key feature of this system is that goods and services in the informal sector are not always given a monetary valuation. The SAM is split up into two parts, making the module independent from the valuation of informal labour. The first part shows all transactions, expressed in monetary value, with the value of informal labour as zero. In the second part, all informal transactions are expressed in informal labour equivalents, such as working years, derived from the TUS. The Dutch see this framework as allowing formal and informal labour to be merged without disturbing the consistency in valuation. Various kinds of multiplier analyses can be applied where pricing is not a prerequisite. Future extensions will include informal fixed capital formation and a further disaggregation of labour by type, for example, by education level or position within household. Any number of disaggregations and micro-economic analyses could be made if the data were available, for example, data by household type. At this stage the framework is in place but very few of the cells have been developed.
Endnotes
Unpaid work
Production boundary and unpaid work
23.172 In the 2008 SNA, the 'general production boundary' is defined in paragraph 6.24 as encompassing all activities 'carried out under the control and responsibility of (institutional units) that use inputs of labour, capital and goods and services to produce outputs of goods and services'. Most unpaid work fits within this definition. The production boundary used in the 2008 SNA is more restricted than the general production boundary. Production is defined in paragraph 6.27 as excluding the value of most unpaid work and as comprising:
- the production of all goods and services that are supplied to units other than their producers, or intended to be so supplied, including the production of goods or services used up in the process of producing such goods or services;
- the own-account production of all goods that are retained by their producers for their own final consumption or gross capital formation;
- the own-account production of knowledge-capturing products that are retained by their producers for their own final consumption or gross capital formation but excluding (by convention) such products produced by households for their own use;
- the own-account production of housing services by owner-occupiers; and
- the production of domestic and personal services by employing paid domestic staff.
23.173 Therefore, the 2008 SNA excludes from production all own-account production of services (which are the equivalent of 'unpaid household work') within households other than services produced by employing domestic staff and housing services produced by owner-occupiers. The 2008 SNA also omits from production the value of volunteer and community work that is provided free by householders to non-profit institutions or other households. The value of this work is not included in the costs of production of the recipients of the services generated by the unpaid work.
Definition and scope
23.174 A prerequisite for the measurement of total unpaid work is a satisfactory definition of what constitutes such work. The boundary between productive and non-productive activity is not clearly distinguishable in many cases. For example, the distinction between unpaid work and leisure is often very difficult to draw.
23.175 A widely accepted principle for determining the scope of total unpaid work is the 'third person' or 'market replacement' criterion originally stated by Reid in 1934, and re-quoted by many writers:
23.176 Household production consists of those unpaid activities which are carried on, by and for the members, which activities might be replaced by market goods or paid services, if circumstances such as income, market conditions and personal inclinations permit the service being delegated to someone outside the household group.¹¹⁵
23.177 Under this criterion a household activity would be considered as unpaid work if an economic unit other than the household itself could have supplied the latter with an equivalent service.
23.178 Arguments can be made for and against the inclusion of some of the activities that would qualify as unpaid work by applying Reid's 'third-party' criterion. Many household activities that meet the Reid criterion, for example cooking and shopping, could be considered leisure activities in a number of circumstances. In the Australian studies, travel to/from work has been excluded from unpaid work because it is not possible to hire someone to travel to work on one's behalf and it is also clearly associated with paid employment rather than household production. Work done from home in relation to paid employment (for example, telephoning clients) which is unpaid but frequently a necessary part of the job, has been classified with paid activities and excluded from estimates of unpaid work. The unpaid assistance provided by relatives and others in family businesses has also been excluded, as the value added by such activities is already included in production in the national accounts.
23.179 Caring for others, for example playing with children, from some perspectives is a debatable inclusion in unpaid household work, even though it satisfies the third person criterion. Individuals perceive the status of these activities differently. Some people would view the raising of children as unpaid work, while others would view it as something more akin to leisure. Some would argue that these caring activities should not be classified as work or leisure but something else—they are activities that satisfy biological and cultural codes of behaviour to ensure desirable outcomes for the whole of society. Despite these reservations, the Australian studies include caring in the scope of unpaid household work. The ABS continues to recognise that the distinctions between paid work, unpaid work and leisure are still subject to world-wide debate and refinement.
23.180 In summary, unpaid work is defined in the Australian studies as comprising unpaid household work and volunteer and community work. Unpaid household work consists of domestic work about the house, childcare and shopping and associated communication and travel. The following list gives a broad indication of the activities included under various categories of unpaid work.
- domestic work has been classified into broad groups as follows:
- food preparation and clean-up: includes the cooking and serving of meals, and washing dishes;
- laundry and clothes care: includes washing, ironing, mending and making clothes;
- general housework: includes cleaning the bathroom/toilet, vacuuming, dusting and tidying;
- grounds and animal care: includes gardening, pool care and feeding and tending to animals;
- home maintenance: includes repairs or improvements to the home, equipment, and motor vehicles and chopping wood; and
- household management: includes paperwork, bills, budgeting, organising, packing, selling household assets and disposing of rubbish.
- childcare – includes the physical, emotional and educational care of children and general interaction with, and supervision of, children;
- shopping – includes the purchasing of a wide range of goods and services for people in the household - purchasing durables and consumer goods and purchasing repair services, administration services, childcare, domestic and gardening services etc.;
- volunteer and community work – includes the physical care of adults, doing favours for others and active involvement in various forms of unpaid voluntary work; and
- all communication and travel associated with unpaid work is also included within the scope of unpaid work.
Valuation methods
23.181 Two basic approaches to measuring unpaid work are identified: the 'direct' or 'output' method; and the 'indirect' or 'input' method. The first method involves the measurement of output by direct observation of prices and requires data on the quantities of services produced. This method is considered to be conceptually superior because it adopts the same approach as that as used to value market production and is therefore appropriate for comparisons with national accounting aggregates. In general, data to apply the output method are not available and the ABS, like most statistical agencies, has used ‘indirect' or 'input' methods to measure the value of unpaid work.
23.182 'Indirect' or 'input' methods involve valuing output in terms of the cost of inputs and require information about the time spent on household work which, in Australia, is provided by TUSs. It is similar but not identical to the approach adopted in the 1993 SNA for valuing other non-market output, for example, non-market services produced by government. However, non-market output is valued using all relevant costs of production. In valuing unpaid work, the ABS and most other practitioners use only labour inputs. There are two broad approaches to this application of the input method:
- The market replacement cost approach: that is, what it would cost households in wages to hire others to do the household work for them. Three variants of this approach are:
- individual function replacement cost approach;
- housekeeper replacement cost approach; and
- replacement cost hybrid approach.
- The opportunity cost approach: that is, what household members would have earned in wages had they spent the same amount of time on paid work as actually spent on unpaid work. Two variants of this approach are:
- gross opportunity cost approach; and
- net opportunity cost approach.
23.183 The ABS recommends the replacement cost approaches in preference to the opportunity cost approaches. However, estimates based on opportunity cost have continued to be derived to provide data that can be compared with opportunity cost estimates produced in the past or by other countries.
Replacement cost approach
Individual function replacement cost approach
23.184 The individual function replacement cost approach assigns values to the time spent on unpaid work by household members according to the cost of hiring a market replacement for each individual function. Thus, for example, time spent on cleaning is valued using a rate of pay for commercial cleaners, and time spent on child minding is valued according to the rate of pay for childcare workers. Use of this method is based on the key assumption that household members and market replacements are equally productive in their work activities.
23.185 It is not easy to determine an appropriate market rate of pay for household activities because commercial rates may embody a level of skill, responsibility or capital not required or reflected in household work.
23.186 The estimates derived using the replacement cost approaches will underestimate or overestimate the contribution of unpaid work to GDP depending on the relationship between the productivity of households and the market sector. If households and market producers are equally productive, that is, if they have the same average output per hour, the replacement cost approaches undervalue unpaid work by ignoring the contribution of non-labour inputs (e.g. capital). If households are more productive, the replacement cost approaches further understate the value of unpaid work because a household will do more work in a given time than a replacement would. If, on the other hand, households are less productive, (if they have, say, access to less capital or technology), the value estimates will be too high because they will be derived by multiplying market wages by the longer time that will be taken by households to do the same amount of work.
23.187 Two questions concerning the choice of an appropriate average wage concept are:
- Whether gross or net wages are most appropriate?
- Whether actual or paid working time should be used?
23.188 In the Australian compilations for 1992 and 1997, a gross wages concept, weekly ordinary time earnings, was preferred.
23.189 It could be further argued that total labour costs should be used, including employers contributions to superannuation, fringe benefits and workers compensation schemes. However, such data are not available in Australia by occupation on a per hour per employee basis. For this reason estimates of unpaid work including such additions to gross wages have not been calculated.
23.190 Regarding use of actual or paid working time, the latter is determined by law or collective agreements, and includes paid holidays and paid sick leave. Actual working time refers to the time spent actually working and includes paid and unpaid overtime but excludes public holidays and weekends (except in cases where a worker does work at those times).
23.191 In Australian studies the concept of paid working hours was used. Hourly wage rates were obtained by dividing weekly ordinary-time earnings by ordinary-time hours paid for. (Ordinary-time excludes overtime.) 'Ordinary-time hours paid for' refers to employees' standard or agreed hours of work that are paid at the ordinary-time rate. It includes stand-by or reporting-time hours that are part of standard hours of work, and any part of annual leave, paid sick leave or long service leave taken during the reference period.
Housekeeper replacement cost approach
23.192 The housekeeper replacement cost approach values the time spent on unpaid household work by household members according to the cost of hiring a housekeeper to undertake the relevant tasks.
23.193 The key assumption underlying this approach is that household members and housekeepers are equally productive in performing household work, which may or may not be true. For example, a housekeeper is likely to be more productive at cleaning than a household member who may also be looking after small children. Alternatively, a housekeeper may clean more quickly but less thoroughly than the household member. Use of this approach also assumes that there is a well-established labour market for persons who undertake all household tasks, which is not the case in Australia in the 1990s.
23.194 In both the 1992 and 1997 estimates, a female wage rate for domestic housekeepers was used as there was no male wage rate available. The tasks identified in the category included:
- preparing, cooking and serving meals and refreshments;
- purchasing food and household supplies;
- washing dishes, kitchen utensils and equipment, sweeping and washing floors and vacuuming carpets, curtains and upholstered furnishings;
- dusting and polishing furniture, and cleaning mirrors, bathrooms and light fixtures; and
- washing and ironing garments, linen and household articles.
23.195 In the 1992 and 1997 estimates, the housekeeper wage rate was used to value all household tasks including those that would not normally be undertaken by a housekeeper.
23.196 The housekeeper replacement cost approach is only applicable to the derivation of the value of unpaid household work and does not apply to the derivation of the value of volunteer and community work. Estimates of the value of total unpaid work under a housekeeper replacement cost heading are derived by adding estimates of unpaid household work derived using the housekeeper replacement cost approach to estimates of volunteer and community work derived using the individual function replacement cost approach, based on the persons wage rate.
Replacement cost hybrid approach
23.197 Under this approach, the housekeeper wage rate was applied to those tasks normally carried out by a housekeeper (as described in the previous section). The value of tasks not normally undertaken by a housekeeper was estimated using the wage rates employed in the individual function replacement cost approach. The hybrid approach would appear to be appropriate given that Australians typically hire housekeepers to clean house interiors, manage laundry and occasionally prepare meals while they hire specialists to carry out childcare, household maintenance and gardening tasks. The hybrid approach was not used in the compilation of the published estimates for 1992.
Opportunity cost
Gross opportunity cost
23.198 The gross opportunity cost approach values unpaid work in terms of the earnings assumed to be foregone by householders when they devote time to unpaid work rather than paid employment. The approach assumes that the value of time spent doing unpaid work at home equals its 'opportunity cost' elsewhere, i.e. the valuation of the next best alternative use. The assumption is made that the worker has given up paid work to perform unpaid work and that its value per hour is equal to the individual's marginal hourly wage in the market. In other words, to do an extra hour of unpaid work, an hour of paid (market) work is given up. However, in practice, the total time spent on unpaid work is multiplied by the average wage applicable to relevant groups in the population.
23.199 There are many problems with this approach. Some reservations are outlined below:
- Labour market structures – the gross opportunity cost approach does not represent the way the choice between paid and unpaid work is made. Most workers have limited choice in the short run regarding the hours they have to work and few have the option to refuse overtime.
- Employment status – this method does not hold up well when patterns of labour force participation other than a rigid fixed-hours working week are considered.
- 'Psychic income' – a probably unquantifiable but theoretically precise valuation would take account of the worker's net psychic income from doing unpaid work and from doing paid work, i.e. where the net psychic benefit equals the psychic benefit from doing unpaid work minus the psychic benefit from paid employment.
- Relevance of market wage rates for individual workers – the question is how is the 'foregone wage' to be determined when an unpaid household worker has had no market employment and therefore an indeterminable potential wage?
23.200 Opportunity cost measures tend to be higher than those for the housekeeper replacement cost approach because wages for professional housekeepers are lower than the economy-wide average wage which is used for the opportunity cost approach. In view of the above discussion, the opportunity cost approach will give useful results only if very strict and probably implausible assumptions apply:
- at the margin, time devoted to unpaid work precludes market work;
- the value of time at the margin is gross hourly wages; and
- the average potential hourly earnings of the not employed are equal to the average hourly earnings of the employed.
23.201 In the Australian studies relating to 1992 and 1997, estimates of unpaid work using the gross opportunity cost approach have been produced using average male and female wage rates, and also using the persons' average wage rate. The ABS regards the gross opportunity cost approach as the least appropriate of the estimation methodologies.
Net opportunity cost
23.202 The decision to undertake paid work as an alternative use of time to unpaid work could reasonably depend on the remuneration (wages and salaries, superannuation, and fringe benefits) after tax and any work-related costs. The net opportunity cost approach recognises this and recommends valuation of unpaid work at the after-tax hourly wage rate less work-related expenses plus income by way of employer costs of superannuation and fringe benefits.
23.203 The rationale behind this approach is that the unpaid worker will be equating the value of doing unpaid work with the net benefit of working in paid work conferred by this 'adjusted' hourly wage rate. In the Australian context, estimates of the wage rate applicable to a net opportunity cost valuation are derived by subtracting from average annual ordinary time earnings, the relevant taxes and levies payable and work-related expenses, and adding to the result the imputed employer on-costs relating to superannuation and fringe benefits and then converting the final result to an hourly wage rate.
23.204 The calculation of the net opportunity cost wage rate is really an attempt to find the appropriate and most realistic net wage rate. Ideally, a number of other factors should also be taken into account, if it were possible to measure them. For example, there is the question of whether tax rebates and social security benefits should be considered. In the Australian context, these include family allowances, family income supplements, medical insurance rebates, and a variety of means-tested welfare programs. Indeed, the net opportunity cost of working in the paid work force could well be negative in some cases.
Data sources
23.205 The preparation of the 1997 estimates of total unpaid work presented in this paper required the following sets of data:
- estimates of average time spent on household work obtained from the 1997 TUS;
- population estimates from the Census of Population and Housing;
- appropriate wage rates from the Survey of Employment, Earnings and Hours as well as the Labour Force Survey; and
- work related expenses from the Household Expenditure Survey.
Limitations
23.206 The main limitations of the unpaid work approach are:
- the contribution to the value of household production that comes from other inputs (e.g. intermediate consumption and capital) is not captured;
- it cannot provide information on the labour productivity of household production;
- it cannot be used to analyse whether households are more efficient in their production than comparable market units;
- it does not take into account the joint production of services through simultaneous or parallel uses of time; and
- a choice is required among multiple wage rates and valuation methodologies, each of which have their limitations.
23.207 With regard to the last point, the pros and cons of the various approaches are well summarised in a 1999 Eurostat document entitled, Proposal for a satellite account of household production.¹¹⁶ (This proposal is discussed in more detail in the section 'The Eurostat Proposal'.) The document provides the broad consensus of national accountants in Europe about the preferred method of valuation of the labour input into household production. Of the possibilities, Eurostat recommends that the housekeeper replacement cost method is the most appropriate method to use to value household labour. The reasons cited include:
- the nature of the work performed by a housekeeper is rather similar to the nature of housework performed by a household member;
- housekeeper productivity is similar to that of the householder, as regards the performance of several household activities simultaneously, the quality of household equipment used and the amount of intermediate consumption involved; and
- the method of valuation is simple and straightforward.
23.208 A potential problem with the housekeeper replacement cost method is that a housekeeper does not perform all the tasks undertaken in households, such as household management, home maintenance, servicing vehicles and volunteer work. Using this approach then could possibly see an undervaluation of the labour input to household production unless those tasks not typically undertaken by a housekeeper were also included in the valuation on the basis of specialists' wages (in effect, utilising a hybrid of the housekeeper replacement cost and individual market replacement cost methods).
23.209 As to the issue of gross or net wages Eurostat recommends that gross wages, which include income tax and social security contributions paid by the employer and employee, be used, although it acknowledges that net wages do have certain advantages from a theoretical point of view. However, net wage statistics are generally not available on an occupational basis. (This is one of the reasons that Australia uses the gross wage concept in its valuation of unpaid work using the replacement cost methods).
Endnotes
Environmental-economic accounts
Introduction
23.210 This section describes the notion of environmental-economic accounts and the underpinnings of the environmental-economic accounts produced by the ABS. Those accounts follow the recommendations of the United Nations' System of Environmental-Economic Accounting (SEEA). The SEEA is an international statistical standard that had its genesis as a satellite system of the SNA. As a result, the SEEA utilises concepts, structures and methods that are largely consistent with those used in the SNA, allowing the SEEA to integrate environmental and economic information within a single framework.
23.211 Over the past 50 years, macroeconomic policy has largely been based on information flowing from the SNA framework and the aggregates it produces. However, gross domestic product and national income fail to capture many vital aspects of national wealth and well-being, such as changes in quality of health, extent of education, social connection, political voice, unpaid household work, and changes in quality and quantity of natural resources. Further, GDP actually includes ''defensive expenditures'' such as spending on household security, health and environmental protection. This is because the SNA measures activity within ''the market''.
23.212 It is well understood that much of what maintains and enhances well-being occurs outside the market. For example, environmental goods and services are considered 'non-market' within the SNA, and well within the production boundary. They are implicitly superabundant, free inputs to production. As a result, they are used as inputs to production, but not charged as costs of production; in effect:
23.213 A country could exhaust its mineral resources, cut down its forests, erode its soil, pollute its aquifers, and hunt its wildlife to extinction, but measured income would not be affected as these assets disappeared.¹¹⁷
23.214 A key limitation of the economic information system is that it cannot answer some of the higher order questions policymakers (and society) are asking. In particular, it does not appropriately describe the relationship between the environment and economy.
23.215 Therefore, a comprehensive analysis of environmental issues, and the policy responses to deal with these, must be informed by socio-economic information about drivers, pressures, impacts and responses. This information should be integrated with the associated bio-physical information so that relationships and linkages can be properly understood.
23.216 Environmental-economic accounts provide a conceptual framework for integrating the environmental and economic information systems. Similarly, organising environmental and economic information into an accounting framework has the capacity to improve basic statistics, and allows for the calculation of indicators which are precisely defined, consistent and interlinked, as illustrated in the figure below:
Figure 23.1 The information pyramid

This image in an information pyramid that is split into three layers. Basic data (economic and environmental) forms the bottom layer. Next layer up is the Accounts (SEEA) which allow for the top layer of the pyramid, Indicators, to be calculated.
Endnotes
The System of Integrated Environmental and Economic Accounting
23.217 The conceptual model adopted by the ABS and the international statistical community for environmental accounts is the United Nations' System of Environmental-Economic Accounting (SEEA). SEEA was endorsed by the United Nations Statistical Commission as an international standard in February 2012. The structures, concepts and classifications used in the SEEA are consistent with those used in the SNA, meaning that accounts produced under the SEEA support the bringing together of environmental and economic information within a common framework. This allows for consistent analysis of the contribution of the environment to the economy, the impact of the economy on the environment, and the efficiency of the use of environmental resources within the economy.
23.218 The SEEA framework, like the SNA, utilises flow and stock accounts containing estimates expressed in both physical and monetary terms. More broadly, the SEEA utilises the following four types of accounts:
- Physical flow accounts record flows of natural inputs from the environment to the economy, flows of products within the economy and flows of residuals generated by the economy. These flows include water and energy used in production (e.g. of agricultural commodities) and waste flows to the environment (e.g. solid waste to landfill).
- Functional accounts for environmental transactions record the many transactions between different economic units (i.e. enterprises, households and governments) that concern the environment. Functional accounts may explicitly identify environmentally-related transactions contained within standard SNA accounts (such flows are not explicitly shown within typical SNA presentations). For example, Environmental Protection Expenditure (EPE) accounts disaggregate traditional national accounting flows to reveal those monetary transactions relevant to environmental protection.
- Asset accounts in physical and monetary terms measure the natural resources available and changes in the amount available. Asset accounts focus on the key individual components of the environment: mineral and energy resources; timber resources; fish/aquatic resources; other biological resources; soil resources; water resources; and land. They include measures of the stock of each environmental asset at the beginning and end of an accounting period and record the various changes in the stock due to extraction, natural growth, discovery, catastrophic loss or other reasons.
The compilation of asset accounts in physical terms can provide valuable information on resource availability
and may help in the assessment of sustainability. A particular feature of the SEEA asset accounts is the
estimation of depletion of natural resources in physical and monetary terms. For non-renewable resources the
quantity of depletion is equal to the quantity of resource extracted but for renewable resources the quantity of
depletion must consider the underlying population, its size, rate of growth and associated sustainable yield.
- The SEEA Central Framework is complemented by two other publications: namely, SEEA Ecosystem Accounting (SEEA EA) and SEEA Applications and Extensions. In terms of the former, ecosystem accounts are a relatively new and developing field. The United Nations Statistical Commission, in March 2021, adopted chapters 1-7 of the System of Environmental-Economic Accounting—Ecosystem Accounting (SEEA EA) as an international statistical standard. In the same document, chapters 8-11 present internationally recognised statistical principles and recommendations for valuation of ecosystem services and assets. The SEEA Ecosystem Accounting (SEEA EA) constitutes an integrated and comprehensive statistical framework for organising data about habitats and landscapes, measuring the ecosystem services, tracking changes in ecosystem assets, and linking this information to economic and other human activity.Ecosystems are areas containing a dynamic complex of plant, animal and micro-organism communities and their non-living environment interacting as a functional unit. Ecosystem accounts are structured to summarise information about these areas, their changing capacity to operate as a functional unit, and their delivery of benefits to humanity.
- The benefits received by humanity are known as ecosystem services. They are delivered in different forms and are grouped into three broad categories:
- provisioning services – the benefits received from the natural inputs provided by the environment such as water, timber, fish and energy resources;
- regulatory services – the benefits provided when an ecosystem operates as a sink for emissions and other residuals, when an ecosystem provides flood mitigation services or when an ecosystem provides pollination services to agriculture; and
- cultural services – the benefits provided when an ecosystem such as a forest, provides recreational, spiritual or other benefits to people.
23.219 Each of the different types of accounts is connected within the SEEA framework but each one focuses on a different part of the interaction between the economy and the environment. Examples of the relationships between the different accounts include:
- Asset accounts and ecosystem accounts focus on the stock and changes in the stock of environmental assets, with asset accounts focusing on the individual components and ecosystem accounts focusing on the interactions within and between these components.
- Changes in the stock are often the result of economic activity which in turn is the focus of physical flow accounts. Measurement of flows of natural inputs in the physical supply and use tables is consistent with the measurement of extraction in the asset accounts and the measurement of provisioning services in ecosystem accounts.
- Measurement of flows of residuals to the environment as recorded in physical supply and use tables is an important consideration in the measurement of ecosystem services, particularly regulatory services.
- Measures of the flows of natural inputs and residuals can also be related to transactions recorded in functional accounts for environmental protection and resource management, including investment in cleaner technologies and flows of environmental taxes and subsidies. For example, payments for emission permits recorded in functional accounts can be related to the flows of emissions recorded in the physical supply and use tables and to the operating surplus of emitters and final expenditures by households.
- The effectiveness of the expenditure for environmental purposes may, ultimately, be assessed by changes in the capacity of ecosystems to continue their delivery of ecosystem services as recorded in ecosystem accounts.
23.220 These examples serve to highlight the many and varied relationships between the accounts, each taking a different perspective. These relationships are supported using common concepts, definitions and classifications throughout the SEEA.
Valuation
23.221 One of the most challenging aspects of environmental-economic decision-making is obtaining appropriate information to inform trade-offs between the environmental assets that deliver a range of non-market goods and services, including ecosystem services, against development alternatives for which there are clearly defined economic values. The SNA and the SEEA Central Framework include the value of environmental assets that have direct economic values. For example, land, timber, minerals and energy resources are included in the national balance sheet in the Australian System of National Accounts.
23.222 The preferred valuation in the SNA and the SEEA Central Framework is based on market transactions. Some environmental assets (and many ecosystem services) are not transacted in markets; in these instances, non-market valuation techniques must be used. For example, mineral deposits are owned by the Commonwealth and state governments in Australia, and are not sold on active markets; rather, they are extracted under a mining lease arrangement. Under these circumstances, it is recommended that the value of the mineral deposit be calculated as the net present value of future expected income resulting from the extraction of this mineral deposit.
23.223 In some cases, the value of certain ecosystem services may be included in the value of goods and services traded in markets. For example, the value of pollination is captured in the value of agricultural crop production, while tourism operators derive income from the people visiting natural attractions such as Uluru and the Great Barrier Reef.
23.224 The development of standardised methods for identifying and separately distinguishing the value of environmental assets and ecosystem services is an on-going area of work in the SEEA. The recognition of the value of these assets and services potentially provides important information to decision-makers; for example, in informing comparisons between various development alternatives.
Integrating the environmental and economic information systems
23.225 A comprehensive national environmental information system should be built on two pillars:
- the essential bio-physical information pertaining to the state of the environment; and
- the complementary socio-economic information on drivers, pressures, impacts and responses.
23.226 The pillars should be 'integrated' to ensure that the bio-physical and socio-economic dimensions of environmental issues can be considered concurrently in policy formulation and in other decision making. Integration is achieved by the use of common frameworks, classifications and standards. The information in each pillar should be organised so that, for each environmental domain of interest, users could seamlessly move from the bio-physical aspects to the socio-economic aspects and vice versa.
23.227 This implies that there should be a common logic for organising both the bio-physical and socio-economic information. Such logic could be built around the various environmental domains (e.g. water, air, land) organised in a driver-pressure-state-impact-response (DPSIR) framework – as depicted in Figure 23.2 below. The integration of information would also ensure that environmental issues that cut across domains, such as biodiversity and greenhouse gas emissions can be appropriately analysed.
Figure 23.2 The DPSIR framework
The image illustrates the driver-pressure-state-impact-response (DPSIR) framework. It describes the interactions between society (Socio-economic) and environment (Biophysical). The flow chart starts with Driver and then flows onto Pressure. Next is a flow to State, then a flow to Impact and finally to Response. Flows from Response can be to any of the previous four items.
23.228 The physical stores of information could be disparate, with the expectation that much of the bio-physical information would be stored by agencies such as the Bureau of Meteorology (BoM) and much of the socio-economic information would be stored by the ABS. However, the information for both pillars would be locatable and accessed through a single portal. From a user perspective, there would be a single virtual information system, although the source of particular information sets would be clearly identifiable within this system.
23.229 To develop such a virtual information system and to achieve integration, the ABS, BoM and other agencies would work in partnership. This would involve working together on relevant frameworks, standards and classifications, as well as the underlying logic for organising environmental information, including determining appropriate metadata requirements. Developing and maintaining the portal would be a joint responsibility of the contributing agencies.
23.230 Figure 23.3 below illustrates the domain that integrated environmental-economic accounts seek to inform – in particular, it is the interaction between the economy and the environment that is the focus of our information framework. The figure further describes the various agencies engaged in integrating environmental and economic information systems, and the location of their primary institutional responsibilities.
Figure 23.3 Integrating information systems - Primary institutional responsibilities
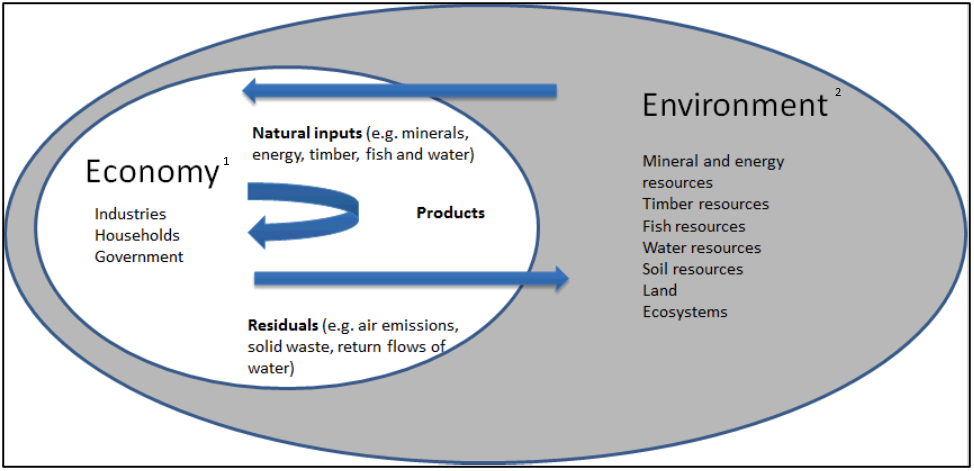
The image illustrates the domain that integrated environmental-economic accounts seek to inform. It shows the interaction between the economy and the environment.
Listed under Economy are: Industries, Households, and Government.
Listed under Environment are: Mineral and energy resources, Timber resources, Fish resources, Water resources, Soil resources, Land, and Ecosystems.
The image shows that Residuals (e.g. air emissions, solid waste, return flows of water) flow from the economy to the environment.
Natural inputs (e.g minerals, energy, timber, fish and water) flow from the environment to the economy.
Products are produced by the economy.
- Australian Bureau of Statistics; Australian Bureau of Agricultural and Resource Economics and Sciences; Department of Climate Change, Energy, the Environment and Water; Department of Prime Minister and Cabinet; Productivity Commission; Treasury; state/territory organisations, etc.
- ABARES; Bureau of Meteorology; Commonwealth Scientific and Industrial Research Organisation; Department of Agriculture, Fisheries and Forestry; Geoscience Australia; Murray-Darling Basin Authority; state/territory organisations, etc.
Changes made to Figure 23.3 Integrating information systems - Primary institutional responsibilities
From 28/10/2024,
Footnotes
- References to the Department of Industry, Science, Energy and Resources have been changed to Department of Climate Change, Energy, the Environment and Water.
- References to the Department of Agriculture, Water and Environment have been changed to Department of Agriculture, Fisheries and Forestry.
- This reflects current administrative arrangements.
ABS integrated Environmental-Economic Accounts
Introduction
23.231 Over the last twenty years, the ABS has produced a range of individual environmental accounts, including accounts for water, energy, waste, land, fish and environmental taxes. The ABS program of environmental accounts is evolving and intends to produce environmental accounts across a greater range of dimensions on a regular basis. This will support the great analytical power of integrated comparisons across dimensions and over time.
23.232 A range of Australian organisations produce environmental accounts. These include the Bureau of Meteorology (National Water Account); Department of Climate Change, Energy, the Environment and Water (energy balances, GHG emissions accounts); the Wentworth Group (regional accounts); and the Department of Agriculture, Fisheries and Forestry (ecosystem accounts). While the degree varies, each of these accounts has links to the SEEA. These accounts are compiled using either Australian principles, such as the Australian Water Accounting Standards (BoM), or as a part of international efforts to monitor particular pressures, such as the GHG emission accounts (DCCEEW).
23.233 A variety of environmental accounts have been compiled by the ABS. These accounts are at different stages of maturity, and some accounts that have been compiled in the past, such as environment protection expenditure accounts, are no longer produced. Other ones are in regular annual production, such as the natural resources on the national balance sheet, or energy and water accounts.
23.234 In some cases, the ABS undertakes substantial primary data collection activity to support the production of accounts, such as for the Water Accounts Australia. In other cases, the ABS does not undertake the primary data collections. For example, the ABS reconfigures existing data for the Energy Account from the energy balances and and emissions data compiled by DICCEEW to match with SEEA and SNA concepts.
ABS collections
23.235 Below is a very brief listing of current and proposed ABS environmental-economic accounts - their key features, followed by a table outlining expected timeframes for their future release.
- Water Account, Australia – annual publication, includes information on the physical and monetary supply and use of water in the Australian economy. It also includes information on water use and consumptive practices of key industries (Agriculture, Water supply, sewerage and drainage services) and households, as well as presenting data cubes for Australia and the States and Territories.
- Energy Account, Australia – annual publication, includes physical supply and use tables that identify physical volumes by industry and energy product; hybrid supply and use estimates; that is, accounts that present related data in both monetary and physical units; physical energy asset tables that identify economically demonstrated reserves of non-renewable primary energy assets; and energy indicators including energy intensity and energy use per household.
- Land Account: land accounts have been produced on an ad hoc basis for various regions and states, including Queensland, South Australia, Victoria and the Great Barrier Reef Region – these accounts include physical and monetary land use by industry, land cover by industry and changes in land cover over time. In addition, land accounts could potentially include terrestrial biodiversity and carbon. The ABS and DAWE are developing a set of National land accounts for release in 2021.
- Waste Account, Australia –presents integrated monetary and physical waste information using an internationally recognised conceptual framework to assist in informing waste policy and discussion in Australia.
- Experimental Environmental-Economic Accounts for the Great Barrier Reef – one-off publication, includes a wide range of environmental-economic accounts, including: marine and terrestrial extent and condition; biodiversity; expenditure on environmental goods and services; provisioning ecosystem services for agriculture, forestry, fishing and aquaculture; regulating ecosystem services; tourism cultural services; water; and carbon.
- From Nature to the Table: Environmental-Economic Accounting for Agriculture – one-off publication representing the first experimental step by the ABS and its data partners to implement the international SEEA for Australia’s agriculture, forestry and fishing industries.
23.236 Other types of accounts, such as those for emissions and material flows, EPE accounts, as well as the classification and valuation of natural resource assets will be addressed in a research agenda.
23.237 Table 23.1 provides a summary of current ABS environmental-economic accounts.
| Theme | Stock | Flow | Environmentally Related Transaction |
|---|---|---|---|
| Water | ✔ Physical, Monetary and Emissions | ||
| Energy | ✔ Physical and Monetary | ✔ Physical, Monetary and Emissions | |
| Minerals | ✔ Physical and Monetary | ✔ Physical only | |
| Timber | ✔ Monetary | ||
| Fish | ✔ Physical only | ✔ Physical only | |
| Waste | ✔ Physical and Monetary | ||
| Greenhouse gas emissions | ✔ Physical only | ||
| Land cover and land use (sub national) | ✔ Monetary and Spatial | ||
| Environmental Taxes | ✔ Monetary only | ||
| Environmental Protection Expenditure | ✔ Monetary only |
Addressing public policy issues
23.229 There has been a significant amount of work done recently to provide data to inform the various public policy debates concerning the environment in Australia and the SEEA framework has been integral to this process. In April 2018 the Australian Government and all states and territory governments agreed on a National Strategy and Action Plan to implement EEA across Australia. The Strategy and Action Plan builds on the efforts of the ABS, and state and territory governments to deliver a nationally consistent approach to Environmental-Economic Accounting.