- SNA, 2008, paras. 2.27-2.30.
- SNA, 2008, paras. 2.33-2.35.
- SNA, 2008, para. 2.47.
This is not the latest release View the latest release
Chapter 2 Overview of the conceptual framework
Australian System of National Accounts: Concepts, Sources and Methods
Reference period
2020-21 financial year
Released
9/07/2021
Introduction
2.1 The conceptual framework of the ASNA is based on the standards set out in 2008 SNA. The ASNA does not include all the elements of the 2008 SNA framework, although Australia's implementation is extensive. Some minor variations have been adopted in the ASNA to allow for specific Australian data supply conditions or user requirements; these are noted at appropriate points throughout this manual.
2.2 The ASNA records key elements of the Australian economy: production, income, consumption (intermediate and final), accumulation of assets and liabilities, and wealth. These elements comprise economic flows and stocks that are grouped and recorded, according to specified accounting rules, in a set of accounts for the economy as a whole and for various sectors and subsectors. The sectors and subsectors comprise groups of institutional units with the same economic role. Statistics are also produced for industries, which comprise groups of producing units with common outputs. At a more detailed level, I-O statistics are produced that record the supply and use of different types of goods and services, or products, by the various industries. Many of the statistics in the ASNA are compiled as current price and chain volume measures by application of 2008 SNA recommendations for price and volume measures.
The conceptual elements of ASNA
Institutional units and sectors
2.3 In 2008 SNA, the basic unit for which economic activity is recorded is the institutional unit. An institutional unit is an economic entity that is capable, in its’ own right, of owning assets, incurring liabilities and engaging in economic activities and transactions with other entities. In the Australian system, the legal entity unit is closest to the 2008 SNA concept of the institutional unit. However, in the ASNA, the unit used is the enterprise, which can be a single legal entity or a group of related legal entities that belong to the same institutional subsector. Four main types of institutional units are recognised in 2008 SNA and the ASNA: households, non-profit institutions, government units and corporations (including quasi-corporations).
2.4 Institutional units are grouped into institutional sectors according to their characteristics and institutional role. All households are allocated to the household sector. Corporations and quasi-corporations are allocated to the non-financial corporations sector or the financial corporations sector according to whether their predominant function is production of goods and non-financial services, or production of financial services. Government units are all allocated to the general government sector. The allocation of non-profit institutions depends on the nature of their operations. Those mainly engaged in market production are allocated to the relevant corporate sector. Those mainly engaged in non-market production are allocated to the general government sector if they are controlled and mainly financed by government; otherwise, they are allocated to the non-profit institutions serving households (NPISH) sector. In the ASNA, the NPISH sector is included in the household sector.
2.5 The various domestic sectors and subsectors include only resident institutional units. The concept of residency used in the ASNA is the same as the concept used in balance of payments statistics, and is based on the requirement that an institutional unit must have a centre of predominant economic interest in Australia's economic territory to be an Australian resident unit.
2.6 Further detail on institutional units and sectors is outlined in Chapter 4.
Transactions and other flows
2.7 Economic flows reflect the creation, transformation, exchange, transfer or extinction of economic value and involve changes in the volume, composition or value of assets and liabilities. In the national accounts, economic flows are divided between transactions and other flows. Transactions generally involve interactions by mutual agreement between institutional units, but also include certain events that occur within institutional units, such as consumption of fixed capital and some types of production for the unit's own use. Other economic flows are changes in the value or volume of assets and liabilities that arise from events other than transactions, such as mineral discoveries, catastrophic losses, depletion, write-offs, and growth of natural assets.
2.8 The 2008 SNA groups elementary transactions and other flows into a relatively small number of types according to their nature. They are:
- Transactions in goods and services (products) describe the origin (domestic output or imports) and use (intermediate consumption, final consumption, capital formation or exports) of goods and services. By definition, goods and services in the SNA are always a result of production, either domestically or abroad, in the current period or in a previous one. The term products is therefore a synonym for goods and services.
- Distributive transactions consist of transactions by which the value added generated by production is distributed to labour, capital and government and transactions involving the redistribution of income and wealth (taxes on income and wealth and other transfers). The SNA draws a distinction between current and capital transfers, with the latter deemed to redistribute saving or wealth rather than income.
- Transactions in financial instruments (or financial transactions) refer to the net acquisition of financial assets or the net incurrence of liabilities for each type of financial instrument. Such changes often occur as counterparts of non-financial transactions. They also occur as transactions involving only financial instruments. Transactions in contingent assets and liabilities are not considered transactions in the SNA.
- Other accumulation entries cover transactions and other economic flows not previously taken into account that change the quantity or value of assets and liabilities. They include acquisitions less disposals of non-produced non-financial assets, other economic flows of non-produced assets, such as discovery or depletion of mineral and energy resources or transfers of other natural resources to economic activities, the effects of non-economic phenomena such as natural disasters and political events (wars for example) and finally, they include holding gains or losses, due to changes in prices, and some minor items.²⁵
Assets and liabilities
2.9 The 2008 SNA (with the ASNA being consistent) states that:
- Assets and liabilities are the components of the balance sheets of the total economy and institutional sectors. In contrast to the accounts that show economic flows, a balance sheet shows the stocks of assets and liabilities held at one point in time by each unit or sector or the economy as a whole. Balance sheets are normally constructed at the start and end of an accounting period, but they can in principle be constructed at any point in time. However, stocks result from the accumulation of prior transactions and other flows, and they are modified by future transactions and other flows. Thus, stocks and flows are closely related.
- The coverage of assets is limited to those assets which are subject to ownership rights and from which economic benefits may be derived by their owners by holding them or using them in an economic activity as defined in the SNA. Consumer durables, human capital and those natural resources that are not capable of bringing economic benefits to their owners are outside the scope of assets in the SNA.
- The classification of assets distinguishes, at the first level, financial and non-financial (produced and non-produced) assets. Most non-financial assets generally serve two purposes. They are primarily objects, usable in economic activity and, at the same time, serve as stores of value. Financial assets are necessarily and primarily stores of value, although they may also fulfil other functions.²⁶
Products and producing units
2.10 Goods and services, also called products, are the result of production. They are exchanged and used for various purposes: as inputs in the production of other goods and services, as final consumption or for investment. Institutional units may produce a variety of products and therefore can be too heterogeneous in terms of their productive activity to provide useful information about industries. Hence 2008 SNA specifies the use of narrower units than institutional units for the purpose of providing statistics about production classified by industry.
2.11 The producing unit recommended in 2008 SNA is the kind-of-activity unit, which is a part of an institutional unit that engages in one productive activity. However, 2008 SNA also suggests that an alternative unit can be used, namely the establishment, which covers all productive activity at a single location.
2.12 In the ASNA, the producing unit is the type of activity unit (TAU), which is the largest unit within a business for which relevant accounts are kept, having regard for industry homogeneity. However, ASNA does not recognise an establishment unit as outlined in 2008 SNA.
2.13 In the ASNA, each TAU is classified to an industry that is defined in the ANZSIC06, which is based on the principles and classification structure set out in the United Nations' International Standard Industrial Classification of All Economic Activities (ISIC), Rev.4. ISIC is the industry classification that the 2008 SNA recommends for use in national accounts.
2.14 Further detail on products and producing units is outlined in Chapter 5.
Relationship with other conceptual frameworks
2.15 The national accounts are important for providing a framework for economic statistics. The accounts provide a conceptual framework for ensuring the consistency of the definitions and classifications used in different, but related, fields of statistics. It also acts as an accounting framework to ensure the numerical consistency of data drawn from different sources. Consistency between different statistical systems enhances the analytical usefulness of all the statistics involved. Therefore, the harmonisation of 2008 SNA and related statistical systems is a key feature of the system.
2.16 ASNA is also harmonised with other statistical systems: the balance of payments, government finance statistics, and monetary and financial statistics. Australia's balance of payments was updated and aligns with BPM6, which was updated simultaneously with the 2008 SNA. Australia's government finance statistics, which feed into the national accounts, align with the International Monetary Fund's revised GFSM released in 2014.
Rules of accounting
2.17 Fundamental to the national accounts is the measurement of economic activity within the economy, i.e. the recording of the transfer of products from one unit to another. 2008 SNA states:
… a distinction is made between legal ownership and economic ownership. The criterion for recording the transfer of products from one unit to another in the SNA is that the economic ownership of the product changes from the first unit to the second. The legal owner is the unit entitled in law to the benefits embodied in the value of the product. A legal owner may, though, contract with another unit for the latter to accept the risks and rewards of using the product in production in return for an agreed amount that has a smaller element of risk in it. Such an example is when a bank legally owns a plane but allows an airline to use it in return for an agreed sum. It is the airline that then must take all the decisions about how often to fly the plane, to where and at what cost to the passengers. The airline is then said to be the economic owner of the plane even though the bank remains the legal owner. In the accounts, it is the airline and not the bank that is shown as purchasing the plane. At the same time, a loan, equal in value to payments due to the bank for the duration of the agreement between them is imputed as being made by the bank to the airline.²⁷
2.18 The 2008 SNA and ASNA accounting rules cover the valuation, time of recording and grouping by aggregation, netting and consolidation of individual stocks and flows.
2.19 All entries in the national accounts should be recorded at the market price current at the time of recording. The appropriate value for exchanges of goods and services is generally the transaction price. Where no transaction price is available, reference is made to the market value of similar goods and services. When no market prices of equivalent goods and services are available, the goods and services are valued at cost. By convention, all non-market goods and services produced by government units and non-profit institutions are valued at cost. Some goods are valued by writing down (depreciating) the initial acquisition costs. Where none of the foregoing methods is feasible, use can be made of the present value of expected future returns. However, this method is not generally recommended.
2.20 2008 SNA recommends that all economic flows be recorded in the national accounts on an accrual basis (i.e. when economic value is created, transformed, exchanged, transferred or extinguished). Accrual recording ensures that economic events are recorded consistently and without distortion arising from leads and lags in accompanying cash flows. In general, use of accrual recording means that:
- flows involving change of ownership are recorded when ownership changes;
- services are recorded when provided;
- distributive transactions, which are those associated with the distribution of income to owners of the factors of production, are recorded as amounts payable accumulate;
- interest is recorded as it accumulates rather than when it falls due for payment;
- output is recorded as production takes place; and
- intermediate consumption is recorded when goods and services are used
2.21 For the most part a strict accrual basis of recording is applied in the ASNA, although special procedures are sometimes required to estimate certain flows on an accrual basis.
2.22 In the national accounts, data are recorded in aggregates (i.e. the sums of the values of stocks and flows of a given type such as total output) and balancing items (i.e. the differences between aggregates on each side of an account or between other balancing items such as saving). A degree of netting is employed in the national accounts in as much as transactions with opposite sign are often combined (e.g. acquisitions and disposals of financial assets are recorded as 'net acquisitions'). Consolidation refers to the elimination of transactions between units in the same sector or subsector from aggregates. In the ASNA, consolidation is generally confined to transactions within establishments, to transfers between institutional units within the general government and household sectors, and to transactions in used fixed assets within sectors. In contrast to 2008 SNA, property income flows within institutional sectors and sectoral (or subsectoral) transactions in financial instruments are consolidated in ASNA. Transactions between establishments of the same enterprise are generally not consolidated, however transactions in financial instruments and related income flows are fully consolidated.
2.23 National accounting is based on the principle of double entry as in business accounting. Each transaction must be recorded twice, once as a resource (i.e. income) and once as a use (i.e. expense). The total of transactions recorded as resources and as uses must be equal, thus permitting a check on the consistency of the accounts. Economic flows that are not transactions have their counterpart directly as changes in net worth. The recording of the consequences of an action as it affects all units and all sectors is based on a principle of quadruple entry accounting, because most transactions involve two institutional units. Correctly recording the four flows involved ensures full consistency in the accounts.
2.24 Further detail on accounting rules is available from Chapter 3.
Endnotes
The Accounts
The full sequence of accounts
2.25 2008 SNA divides the accounts into two main classes: the integrated economic accounts and the other parts of the accounting structure. The integrated economic accounts use the institutional units and sectors, transactions, and assets and liabilities together with the rest of the world to form the accounts. These are the accounts presented in ASNA, but not in the same format. The other parts of the accounting structure bring in the conceptual elements of production units, products, purposes, employment and population to assist in the production of the integrated economic accounts (e.g. supply-use tables) or to present the data in different ways.
2.26 The integrated economic accounts are grouped into three categories:
- Current accounts - present production, and the generation, distribution and use of income;
- Accumulation accounts - present changes in assets and liabilities and changes in net worth (the difference between assets and liabilities for a given institutional unit or group of units); and
- Balance sheets - present stocks of assets and liabilities and net worth. Opening and closing balance sheets are included with the full sequence of accounts.
2.27 The main accounts in the ASNA are as follows:
- gross domestic product (GDP) accounts - record the value of production (i.e. production of GDP), the income from production (i.e. income from GDP) and the final expenditures on goods and services produced and net international trade in goods and services (i.e. expenditure on GDP);
- income accounts - show primary and secondary income transactions, final consumption expenditures and consumption of fixed capital;
- capital accounts - record the net accumulation of non-financial assets through transactions, and the financing of the accumulation by way of saving and capital transfers;
- financial accounts - show the net acquisition of financial assets and the net incurrence of liabilities; and
- balance sheets - record the stock of financial and non-financial assets, and financial liabilities at a particular point in time.
2.28 The ASNA accounts are based on the system of accounts outlined in 2008 SNA. Each of the accounts is produced for the economy as a whole and the set of accounts together constitute the consolidated summary accounts. The ABS produces annual income and capital accounts by institutional sector based on 2008 SNA. The quarterly sectoral accounts depict national accounts using the same concepts and definitions as the annual sector accounts. These accounts are compiled for each of the following institutional sectors and subsectors: non-financial corporations (private and public), financial corporations, general government (national and state and local), and households (including NPISH).
2.29 The national accounts also include supplementary tables which provide more detailed presentations of the individual sector accounts. Although production accounts could be constructed for the four individual institutional sectors, major interest centres instead around production on an industry basis. This cuts across the institutional sectors used in the income and capital accounts since the production units are classified by industry without regard to institutional sector.
2.30 Another account that is integral to the national accounts is the external account. This account records the transactions and financial positions of the nation with the rest of the world, from the point of view of the rest of the world. In one sense, the external account is simply another sectoral account. Because of the important role of the rest of the world sector, the account is a major focus of attention for economic analysts and international organisations.
GDP accounts
2.31 The measure of production for the economy as a whole is gross domestic product (GDP). GDP is the sum, for a particular period, of the gross value added of all resident producers (where gross value added is equal to output less intermediate consumption) and net taxes on products. This is referred to as GDP measured by the production approach (GDP(P)). GDP can also be derived as the sum of factor incomes (i.e. compensation of employees, gross operating surplus and gross mixed income) and net taxes on production and imports, or as the sum of all final expenditures by residents (final consumption expenditure and GFCF), changes in inventories and exports less imports of goods and services. These are referred to as GDP measured by the income approach (GDP(I)) and GDP measured by the expenditure approach (GDP(E)), respectively. All three approaches are presented in the ASNA publications. In Australia, the combined presentation of the three approaches is referred to as the GDP accounts. These reflect the 2008 SNA production account.
2.32 Although conceptually each measure should result in the same estimate of GDP, different estimates of GDP are obtained when the three measures are compiled independently using different data sources. However, integration of the annual Australian national accounts estimates with annual balanced supply-use tables ensures that the same estimate of GDP is obtained for all three approaches for years in which these tables are available. The supply-use tables have been compiled from 1994-95 up to the year preceding the latest completed financial year, except in the June quarter where it is the latest two years.
2.33 Prior to 1994-95, the estimates using each approach are based on independent sources and there are usually differences between the GDP I, E and P estimates. Nevertheless, for these periods, a single estimate of GDP has been compiled by taking a simple average of the I, E and P estimates.
2.34 As a result of the above methods:
- there are no statistical discrepancies in either current price or chain volume terms for annual estimates from 1994-95 up to the year prior to the latest year (and the latest two years in the June quarter); and
- statistical discrepancies exist in both current price and chain volume terms between estimates obtained from the GDP I, E and P approaches and the single estimate of GDP for years prior to 1994-95, for the latest year (and the latest two years in the June quarter), and for quarterly estimates. These discrepancies are shown in the relevant tables.
2.35 There is no institutional sector dimension to any of the GDP accounts, although the GDP(I) measure could be classified this way. GDP measured by the production approach (i.e. sum of value added) is presented by industry only. The valuation of GDP in ASNA is at purchasers' prices, so net taxes on products are added to total gross value added to obtain GDP(P).
Income account
2.36 2008 SNA splits the income account into several accounts, distinguishing between the distribution, redistribution and use of income. The distribution of income is decomposed into three main steps: primary distribution (i.e. primary income), secondary distribution (i.e. secondary income) and redistribution in kind (i.e. social transfers in kind). The balancing items at the various stages are meaningful concepts of income provided all kinds of distributive current transactions are included.
2.37 The ASNA includes all such transactions. Each stage is presented in the income account with the balancing items being gross income and gross disposable income for all sectors, and adjusted disposable income for the general government and household sectors. Australia's presentation of the income account differs from 2008 SNA in that transactions regarding the distribution and redistribution of income are presented in one table.
2.38 The sectoral income accounts are a disaggregation of the national income account, recording for each institutional sector. Their net income arising from production and transfers of other sectors, and their uses of income (disbursements). The difference between income and the use of income is net saving. This balancing item is carried forward to the capital account as saving must be used to acquire financial or non-financial assets, or to reduce liabilities.
2.39 The transactions as presented in the ASNA are:
- Primary income consists of factor incomes (e.g. compensation of employees, gross operating surplus and gross mixed income, and taxes less subsidies on production and imports) and property incomes (e.g. interest, dividends, rent on land and mineral and energy resources, and reinvested earnings of direct investors and investment funds). Gross national income is the balancing item and equals total factor incomes, plus taxes less subsidies on production and imports, plus net primary income receivable from non-residents.
- Secondary income consists of current transfers. Transfers are resources provided from one institutional unit to another for which nothing of economic value is provided in return. Current transfers include taxes on income and wealth, social contributions (e.g. for workers' compensation) and benefits (e.g. unemployment benefits), current grants between governments, and donations to non-profit institutions. Gross disposable income is the balancing item and is equal to the sum of net primary income receivable and net secondary income receivable.
- Social transfers in kind exist only in the general government and household sector. They consist of goods and services provided to households by government (or NPISHs) either free or at prices that are not economically significant. They consist of final consumption expenditure undertaken by government (and NPISHs) on behalf of households, for example, education and health services.
Capital account
2.40 The capital account is the first account in the sequence of the accumulation accounts, and records the acquisitions less disposals of non-financial assets, as well as capital transfers involving the redistribution of wealth. It shows sources of funds (receipts) for financing gross capital formation, and the use of these funds (disbursements). Sources of funds comprise consumption of fixed capital, net saving transferred from the national income account and net capital transfers receivable from non-residents. On the disbursements side are shown GFCF, changes in inventories and net acquisitions of non-produced non-financial assets. Conceptually, net lending to non-residents is the balancing item of the national capital account. However, if there are statistical discrepancies in the Expenditure on GDP account, then these discrepancies must also be taken into account before deriving the balancing item. When net lending is negative, the economy is a net borrower from non-residents. Where net lending is positive, the economy is a net lender to non-residents.
2.41 2008 SNA has an entry for acquisitions less disposals of valuables. While conceptually such transactions should be recorded in the capital account, they are currently not recorded in the ASNA due to a lack of a suitable data source. It is worth noting that household final consumption expenditure (HFCE) may include some expenditure on valuables by the household sector.
2.42 The sectoral capital accounts are a disaggregation of the national capital account and show the extent to which the sum of savings and capital transfers are used to finance the acquisition of non-financial assets. The balancing item, net lending/borrowing, reflects the net lending/borrowing of a particular sector to all other sectors. Net lending is the excess of capital finance for capital acquisition and measures the amount an institutional sector has available to finance other sectors. Net borrowing is the existence of a borrowing requirement to finance capital acquisitions due to an insufficient retention of financial resources through saving and capital transfers. Capital accounts are also compiled for selected subsectors.
2.43 As sectoral production accounts are not compiled, it is not possible to show any national statistical discrepancies by sector. Accordingly, the sectoral net lending balance implicitly includes each sector's share of the national statistical discrepancy.
Financial account
2.44 The financial account records the net acquisitions of financial assets and liabilities.
2.45 The financial account explains how net lending/borrowing is affected by changes in the holding of financial assets and liabilities. The sum of these changes, net change in financial position, is conceptually equal in magnitude to the net lending/borrowing item of the capital account. The financial account for each sector shows the financial transactions associated with the net lending transactions recorded in the capital account. These accounts, however, are compiled using different sources, giving rise to differences between the two balancing items, usually due to measurement error. These differences are recorded for each institutional sector in net errors and omissions.
2.46 In the national financial account, transactions in financial assets and liabilities with non-residents are shown. The national financial account is identical to the financial account in the balance of payments. Note that the signs are reversed between the two as the balance of payments is based on the point of view of the resident, whereas the national accounts take the view of the non-resident. Financial accounts are also compiled for each sector and for a wide range of subsectors. In these financial accounts, the transactions relate to financial assets and liabilities with other sectors/subsectors.
Other changes in the volume of assets account
2.47 The other changes in the volume of assets account records the effect of exceptional events that cause not only the value, but also the volume of assets and liabilities to change. They may be divided into three main categories:
- normal appearance and disappearance of assets other than by transactions, such as discovery and depletion of mineral and energy resources, and growth and depletion of native forests; economic recognition of produced assets such as public monuments and valuables; the initiation and cancellation of contracts, leases and licences such as patents, broadcast licences and taxi plates; changes in the value of goodwill and marketing assets; and the appearance or disappearance of financial assets;
- changes in assets and liabilities due to exceptional, unanticipated events, such as natural disasters (e.g. bushfires, floods and earthquakes), war or severe acts of crime, and uncompensated seizures of assets; and
- changes in classification and structure: in the event that the activities of an institutional unit change to the extent that the unit is reclassified from one institutional sector to another (for example, from the non-financial corporations sector to the financial corporations sector), the movements of assets and liabilities between the sectors are recorded as part of other flows in this category.
2.48 The balancing item for this account is changes in net worth due to other changes in the volume of assets. In ASNA, other changes in the volume of assets are recorded in an account that reconciles the values of assets and liabilities recorded in the opening and closing balance sheets.
Revaluation account
2.49 The revaluation account records holding gains and losses which result from changes in the prices of non-financial assets and financial assets and liabilities. Holding gains and losses accrue to the owners of assets and liabilities purely as a result of holding the assets or liabilities over time, without transforming them in any way. Holding gains and losses include not only gains/losses on capital goods (such as fixed assets, land and other natural resources) and financial assets and liabilities, but also inventories, including work-in-progress.
2.50 The balancing item for this account is changes in net worth due to nominal holding gains and losses. In ASNA, holding gains and losses are recorded in an account that reconciles the values of assets and liabilities recorded in the opening and closing balance sheets.
2.51 Holding gains and losses measured based on current prices are called nominal holding gains and losses. 2008 SNA notes that these nominal gains and losses can be further decomposed into neutral holding gains and losses, reflecting changes in the general price level, and real holding gains and losses, reflecting changes in the relative prices of assets. The ASNA shows this decomposition for the total economy and for the household sector.
Balance sheets
2.52 The national balance sheet shows, at certain points, the aggregate value of Australian residents' non-financial assets, their financial claims on non-residents, and their liabilities to non-residents. The balancing item is net worth, representing the difference between assets and liabilities. Net worth is equivalent to the present value of the stock of economic value a unit or sector holds.
2.53 Similar information is shown for each sector in the sectoral balance sheets. For financial assets and liabilities, the amounts shown are the outstanding claims on and liabilities to other sectors on the balance sheet dates. For non-financial assets, the amounts shown represent each sector's share of the Australian value as at the balance sheet dates.
2.54 The opening and closing balance sheets display assets, liabilities and net worth valued at the prices of the date for which the balance sheet is compiled. Conceptually, the entries for assets and liabilities in the closing balance sheet are equal to the entries in the opening balance sheet plus changes in the accumulation accounts; that is, the capital account; the financial account; the other changes in the volume of assets account; and the revaluation account.
2.55 2008 SNA includes entries for valuables and non-produced non-financial assets. Conceptually, these assets should be recorded in the balance sheets. However, valuables and certain non-produced non-financial assets are not recorded in the ASNA due to a lack of suitable data sources. The excluded non-produced non-financial assets are water resources, goodwill and marketing assets and contracts, leases and licences (except for spectrum licenses).
2.56 Supplementing the balance sheets are accounts that show the changes in balance sheet positions during a particular period. In these accounts, changes in balance sheets are decomposed into transactions (which are equivalent to the relevant transactions recorded in the capital and financial accounts), revaluations due to the effect of price changes, and other changes affecting the volume of assets and liabilities.
External account
2.57 The external accounts show the economy's transactions and stock positions with non-residents, from a non-resident perspective.
2.58 In ASNA, external income, capital, financial and balance sheet accounts are provided. The external income account is analogous to the balance of payments current account. As such, its balance is the same as, but opposite in sign to, the balance on the current account as recorded in the balance of payments. The balance on the external capital account (net lending) is the same as, but opposite in sign to, the sum of the current and capital account balances in the balance of payments. The external financial account includes the balance of payments financial account together with net lending of non-residents (the sum of the balance of payments current and capital account balances) and the difference between the two; that is, the balance of payments net errors and omissions item.
Integrated presentation of the Accounts
2.59 Once all elements have been produced, it is possible to present in detail the integrated accounts. The integrated accounts give a complete picture of the accounts of the total economy including balance sheets in a way that permits the principal economic relations and the main aggregates to be shown. The level of detail can vary depending on the purpose.
2.60 The following table provides a summary of the accounts, balancing items and main aggregates within the 2008 SNA and the comparison with the ASNA. The purpose of the table is to illustrate how the ASNA presentation compares with the 2008 SNA presentation.
| SNA presentation | ASNA presentation | |||
|---|---|---|---|---|
| Account | Balancing item | Main aggregate | Account | Main aggregate |
| Current accounts | ||||
| Production account | GDP accounts | |||
| Production account Goods and services account Generation of income account | Value added Operating surplus/mixed income | Domestic product | Production of GDP (GDP(P)) Expenditure on GDP (GDP(E)) Income from GDP (GDP(I)) | Gross Domestic Product |
| Distribution of income accounts | National income account | |||
| Allocation of primary income account | Balance of primary income | National income | Gross national income | |
| Secondary distribution of income account | Disposable income | National disposable income | Gross disposable income | |
| Redistribution of income in kind account | Adjusted disposable income | Adjusted disposable income | ||
| Use of income accounts | ||||
| Use of disposable income account | Saving | Use of gross disposable income Saving | ||
| Use of adjusted disposable income account | Saving | National saving | Saving | |
| Accumulation accounts | ||||
| Capital account | Net lending (+) / Net borrowing (-) | Capital account | Net lending (+) / Net borrowing (-) | |
| Financial account | Net lending (+) / Net borrowing (-) | Financial acounts | Net change in financial position | |
| Other changes in the volume of assets account | Changes in net worth due to other changes in volume of assets | Included in balance sheets | ||
| Revaluation account | Changes in net worth due to nominal holding gains and losses | Included in balance sheets | ||
| Balance sheets | Balance sheets | |||
| Opening balance sheet | Net worth | National wealth | Opening balance sheet | Net worth |
| Changes in assets and liabilities | Changes in net worth | Changes in assets and liabilities | Changes in net worth | |
| Non-financial assets | Net capital formation | |||
| Financial assets / liabilities | Financial transactions | |||
| Other changes in volume of assets | Other changes in volume | |||
| Revaluations | Revaluations | |||
| Closing balance sheets | Net worth | National wealth | Closing balance sheets | Net worth |
2.61 The following figure illustrates the integrated accounts as presented in the ASNA:
Figure 2.1 Illustration of the ASNA structure
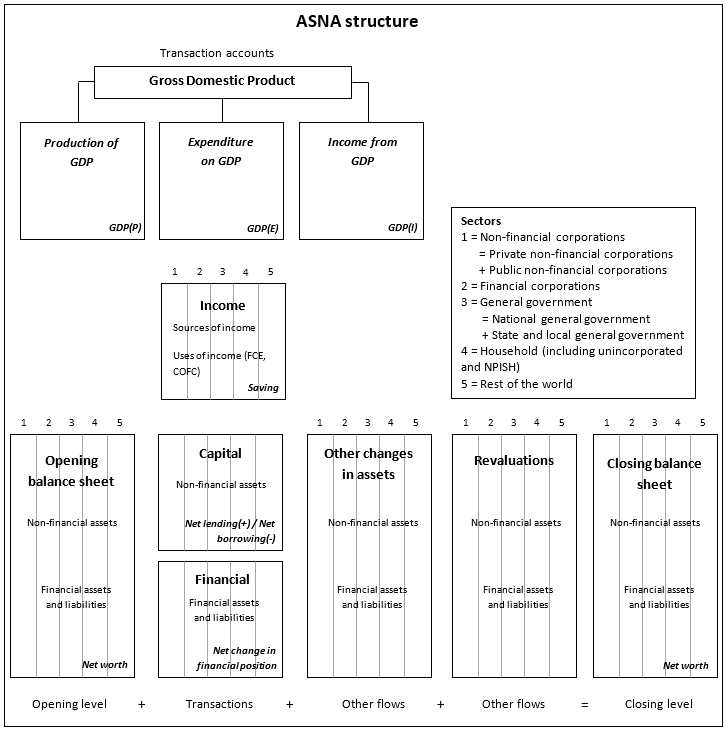
This image is an illustration of the ASNA structure.
The Gross Domestic Product (GDP) transaction account is produced from:
• Production of GDP (GDP(P)) - records the value of production.
• Expenditure on GDP (GDP(E)) - the final expenditures on goods and services produced and net international trade in goods and services.
• Income from GDP (GDP(I)) - the income from production.
The remaining structure of Income, Capital, Financial, Other changes in assets, Revaluations and balance sheets are compiled from 5 sectors:
1. Non-financial corporations = Private non-financial corporations + Public non-financial corporations
2. Financial corporations
3. General government = National general government + State and local general government
4. Household (Including unincorporated and NPISH)
5. Rest of the world
Income comprises Sources of income and Uses of income (FCE, COFC) (Saving).
Opening balance sheet comprises Non-financial assets and Financial assets and liabilities (Net worth).
Capital comprises Non-financial assets (Net lending (+)/Net borrowing (-)).
Financial comprises Financial assets and liabilities (Net change in financial position).
Other changes in assets comprises Non-financial assets and Financial assets and liabilities.
Revaluations comprises Non-financial assets and Financial assets and liabilities.
Closing balance sheet comprises Non-financial assets and Financial assets and liabilities (Net worth)
The equation to produce the ASNA is:
Opening level
+ Transactions
+ Other flows (other changes in assets)
+ Other flows (Revaluations)
= Closing level
The Aggregates
2.62 The aggregates, including value added, income, consumption and saving, are composite values which measure one aspect of economic activity. They are summary indicators and key magnitudes for purposes of macroeconomic analysis and comparisons over time. Some aggregates may:
- be obtained directly as totals of particular transactions (e.g. final consumption, GFCF and social contributions); or
- result from aggregating balancing items for the institutional sectors (e.g. value added, disposable income and saving).
2.63 Aggregates are commonly presented as net or gross measures. The distinction between the two is based on whether consumption of fixed capital has been deducted from the measure. A gross measure includes consumption of fixed capital, whereas net measures are obtained by deducting consumption of fixed capital from gross measures. 2008 SNA recommends that net measures should be produced where it is possible to do so as they take into account a reduction in the value of previously created fixed assets when they are used up in the production process. However, the SNA recognises that it is very difficult to measure consumption of fixed capital with any precision and acknowledges that gross measures will be commonly used in practice.
2.64 Aggregates are also presented in current price or volume measures. A key advantage of volume measures is that the price effect is eliminated and a real change from one period to another is obtained. However, some aggregates, such as income, are not able to be measured in volume terms as they cannot be broken down into quantity and price components.
Gross Domestic Product (GDP)
2.65 GDP derives from the concept of value added. Gross value added is the difference between output and intermediate consumption. GDP is the sum of gross value added of all resident producer units, plus taxes on products less subsidies on products. This derivation is referred to as GDP measured by the production approach (GDP(P)).
\(\small GDP(P) = Output - Intermediate \: Use + Taxes \: on \: Products - Subsidies \: on \: Products \)
2.66 GDP is also equal to the sum of the final uses of goods and services (all uses except intermediate consumption) measured at purchasers' prices, less the value of imports of goods and services. This derivation is referred to as GDP measured by the expenditure approach (GDP(E)).
\(\small {GDP(E) = Final \: Consumption \: Expenditure \: by \: Households \: (C) \: and \: Government \: (G) \\ \hspace{1.5cm}+ Gross \: Capital \: Formation + Exports \: of \: goods \: and \: services \: (X)\\ \hspace{1.5cm} - Imports \: of \: goods \: and \: services \: (M)}\)
2.67 Finally, GDP is also equal to the sum of primary incomes distributed by resident producer units. This derivation is referred to as GDP measured by the income approach (GDP(I)).
\(\small {GDP(I)=Compensation \: of \: Employees \: (COE) \: + \: Gross \: Operating \: Surplus \: (GOS) \\ \hspace{1.4cm} + \: Gross \: Mixed \: Income \: (GMI)+(Taxes \: on \: Production \: and \: Imports\\ \hspace{1.4cm}-Subsidies \: on \: Production \: and \: Imports \: (NT))}\)
Gross National Income (GNI)
2.68 GNI is equal to GDP less primary incomes payable to non-resident units plus primary incomes receivable from non-resident units. In other words, GNI is equal to compensation of employees, plus gross operating surplus and gross mixed income, plus taxes (less subsidies) on production and imports, less property income payable to the rest of the world plus the corresponding items receivable from the rest of the world. Thus, GNI is the sum of gross primary incomes receivable by resident institutional units or sectors. In contrast to GDP, GNI is not a concept of value added, but a concept of income. By deducting the consumption of fixed capital from GNI, net national income (NNI) is obtained.
\(\small {GNI=COE+GOS+GMI+NT+Net \: primary \: income \: receivable \: from \\ \hspace{1.3cm} non–residents \: (NPINR) \\ \hspace{0.8cm}=GDP+NPINR }\)
Gross National Disposable Income (GNDI)
2.69 Gross national disposable income is equal to GNI less current transfers (other than taxes, less subsidies, on production and imports) payable to non-resident units, plus the corresponding transfers receivable by resident units from the rest of the world. Gross national disposable income measures the income available to the total economy for final consumption and gross saving. By deducting consumption of fixed capital from gross national disposal income, net national disposable income is obtained. National disposable income is the sum of disposable income of all resident institutional units or sectors.
\(\small {GDNI=COE+GOS+GMI+NT+NPINR+Net \: current \: transfers \: receivable \\ \hspace{1.5cm} from \: non–residents \: (NCT) \\ \hspace{1.1cm}=GDP+NPINR+NCT }\)
Other parts of the accounting structure
Supply-use tables
2.70 2008 SNA states that the detailed analysis of production by industries and flows of goods and services by kind of products is an important part of the integrated central framework. A detailed analysis of production activities and product balances is made in the supply-use tables presenting:
- the resources and uses of goods and services for each type of product;
- the production and generation of income accounts for each industry according to kind of economic activity; and
- data on factors of production (labour and fixed capital) used by industries.
2.71 Supply-use tables are a powerful tool to compare and contrast data from various sources and improve the coherence of the economic information system. They permit an analysis of markets and industries and allow productivity to be studied at this level of disaggregation. S-U tables show, for the economy as a whole and for groups of products, the total resources in terms of domestic output and imports, and the uses of goods and services in terms of intermediate consumption, final consumption, gross capital formation and exports. They also provide information on the generation of income from production.
2.72 The S-U tables reconcile how the supply of products (either by domestic production or imports) within the economy in an accounting period is used for intermediate consumption, final consumption, capital formation or exports. Once both sides are equal (i.e. supply = use) for all products, the tables are said to be balanced: balanced supply-use tables provide the benchmarks for the annual current price and chain volume measures of GDP.
Input-output tables
2.73 The ASNA includes symmetric I-O tables which provide a means of undertaking more detailed analysis of the process of production and the use of goods and services (products), and of the income generated by that production than is possible with S-U tables. 'Symmetric' means that the same classifications or units (e.g. the same groups of products) are used in both rows and columns.
2.74 The I-O tables serve two purposes: statistical and analytical. They provide a framework for checking the consistency of statistics on flows of goods and services obtained from different kinds of statistical sources, for example, industrial surveys, household expenditure data, investment surveys, foreign trade statistics, etc. They serve as a coordinating framework for economic statistics, both conceptually for ensuring the consistency of the definitions and classifications used, and as an accounting framework for ensuring the numerical consistency of data drawn from different sources. The I-O framework is also appropriate for calculating much of the economic data contained in the national accounts and detecting weaknesses. This is particularly important for the decomposition of the values of flows of goods and services into prices and volumes for the calculation of an integrated set of price and volume measures. As an analytical tool, I-O data are conveniently integrated into macroeconomic models in order to analyse the link between final demand and industrial output levels.
2.75 The symmetric I-O tables are derived out of the S-U tables. As the latter are data-oriented in nature, adjustments are required in the compilation of the former, particularly with respect to valuation, the treatment of imports, and classifications. The links between the I-O tables and the S-U tables are described in Chapter 22 Input-Output Tables.
Tables of financial transactions and financial assets
2.76 In concept, the accounts show which sectors acquire which financial assets and incur which liabilities. In order to examine the workings of the financial sector, the financial account in ASNA distinguishes various subsectors within financial corporations and eleven categories of financial assets and liabilities.
2.77 Australian National Accounts: Finance and Wealth includes financial instrument market tables for the twelve financial instruments in a from-whom-to-whom framework with nineteen available counterparty sectors and subsectors. Each financial instrument is presented by issuing/accepting/borrowing sector/subsector by counterparty. Transactions and stocks between intra-sector/subsector are also presented for these tables; for example, authorised deposit-taking institutions (ADIs) deposits held by other ADIs. If required, the financial market tables would enable the ASNA to produce the flow-of-funds matrix as described in paragraph 2.150 of the 2008 SNA.
Sources and methods
2.78 ASNA records the essential elements of the Australian economy: production, income, consumption (intermediate and final), accumulation of assets and liabilities, and wealth. As such, many different data sources are used to compile the ASNA. In many cases, these data are infrequent, incomplete, lacking in scope or are simply not on a basis that aligns with national accounts standards. The upcoming chapters provide an overview of the sources and methods employed to convert these different data sources into a coherent set of national accounts.