KEY FIGURES
LAND USE, Australia, year ended 30 June 2016
|
 | Aust.
'000 ha | NSW
'000 ha | Vic.
'000 ha | Qld
'000 ha | SA
'000 ha | WA
'000 ha | Tas.
'000 ha | NT
'000 ha | ACT
'000 ha | |
|
| Area of farms | 371 078 | 53 438 | 10 676 | 127 551 | 47 580 | 76 802 | 1 459 | 53 546 | 25 | |
| Area of crops (a) | 24 628 | 6 374 | 4 142 | 2 336 | 3 544 | 8 104 | np | np | np | |
| Area of non-agricultural land | 398 124 | 26 626 | 12 065 | 45 514 | 50 768 | 176 185 | 5 381 | 81 367 | 210 | |
| Total land area (b) | 769 202 | 80 064 | 22 742 | 173 062 | 98 348 | 252 988 | 6 840 | 134 913 | 236 | |
|
np not available for publication
(a) Includes broadacre crops, hay and silage and horticulture
(b) Total land area supplied by Geoscience Australia
KEY LAND USE POINTS
- At 30 June 2016 there were 371 million hectares of agricultural land in Australia, a 1% increase compared with the previous year. Coinciding with this increase in agricultural land, there were 952 more agricultural businesses, representing a 1% increase since 2014-15.
- Of all the states and territories, Queensland had the highest proportion of agricultural land, accounting for 34% of total area of holding in Australia, a decline of 1% since 2014-15.
FARM MANAGEMENT, Australia, year ended 30 June 2016
|
| Aust. | NSW | Vic. | Qld | SA | WA | Tas. | NT | ACT | |
|
| Average age of provider (yrs) | 56 | 57 | 57 | 56 | 55 | 55 | 55 | 50 | 58 | |
| Average time provider involved in farming (yrs) | 35 | 36 | 36 | 36 | 34 | 34 | 34 | 24 | 30 | |
| Male providers (%) | 78 | 78 | 80 | 73 | 83 | 80 | 81 | 66 | 67 | |
| Female providers (%) | 22 | 22 | 20 | 27 | 17 | 20 | 19 | 34 | 33 | |
|
|
|
SOURCES OF FARM INCOME (%) |
|
| Agricultural production on holding | 84 | 82 | 84 | 82 | 88 | 87 | 83 | 82 | 66 | |
| Off-farm employment/business activities | 12 | 13 | 12 | 14 | 9 | 10 | 14 | 11 | 22 | |
| Other sources including grants, government transfers and relief funding | 4 | 4 | 4 | 5 | 3 | 3 | 3 | np | np | |
| Not stated | 0 | 0 | 0 | 0 | 0 | 0 | 1 | 1 | 0 | |
|
| | | | | | | | | | |
np not available for publication
KEY FARM MANAGEMENT POINTS
In 2015-16, key attributes of Australian farm management were:
- The average number of years respondents were involved in farming was 35. New South Wales, Queensland and Victoria had the highest average at 36 years and the Northern Territory the lowest at 24 years.
- The majority of business income for agricultural producers in 2015-16 was from agricultural production (84%), up from 83% in 2014-15.
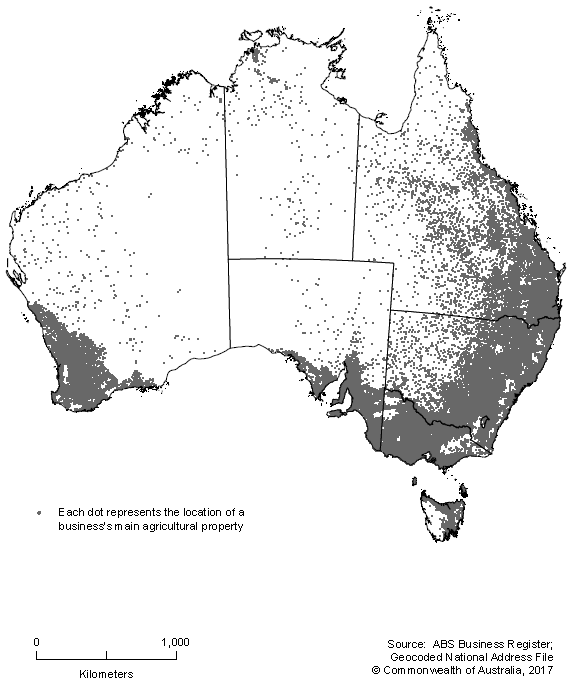
- Figure 1 shows the location of agricultural businesses in Australia
 CHANGE IN COLLECTION SCOPE
- The scope for the 2015-16 Agricultural Census was all agricultural businesses with an Estimated Value of Agricultural Operations (EVAO) of $40,000 or greater. This is a change from previous ABS rural environment and agricultural collections, where a scope of EVAO of $5,000 or greater was used. This change was foreshadowed in February 2016 in Agricultural Census: Nature and Content, 2015-16 (cat. no 7100.1).
- The 2014-15 estimates presented in this publication have been revised to use the new scope of $40,000 or greater.
- For more information about EVAO and the change in scope, refer to the Explanatory Notes within this release.
 Quality Declaration
  Print Page
 Print All