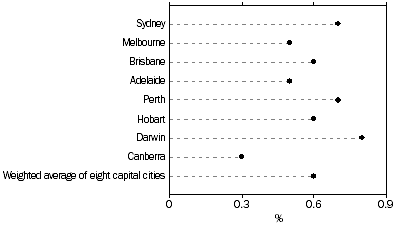
Capital cities comparison
All groups CPI
All Groups CPI, Percentage change from previous quarter

Main Positive Contributors
- Transport (+3.4%) driven by higher world oil prices and retail fuel margins resulting in an increase in automotive fuel (+10.2%). Automotive fuel rose in all capital cities this quarter, ranging from Canberra (+1.7%) to Sydney (+11.8%).
- Health (+1.8%) due to the cyclical increase in Private Health Insurance premiums in the medical and hospital services (+2.6%) from 1 April. Medical and hospital services rose in all capital cities, ranging from Canberra (+1.8%) to Adelaide (+3.8%).
Main Negative Contributors
- Food and non-alcoholic beverages (-0.4%) driven by an improved supply of fruit and vegetables with autumn/winter produce coming into season, and bananas returning to normal prices following adverse weather conditions in Queensland last quarter. Perth exhibited a smaller fall than the other cities due to localised drought conditions affecting fruit and vegetable supply.
- Housing (-0.2%) driven by utilities (-1.0%), new dwelling purchase for owner-occupiers (-0.2%), and continued weakness in rents (0.0%). Utilities fell in all cities excluding Perth (0.0%) and Darwin (+0.1%), ranging from Hobart (-0.1%) to Brisbane (-3.2%).
All Groups CPI, All groups index numbers and percentage changes |
|
 | Index number(a) | Percentage change |
 | Jun Qtr 2019 | Mar Qtr 2019 to Jun Qtr 2019 | Jun Qtr 2018 to Jun Qtr 2019 |
|
| Sydney | 115.9 | 0.7 | 1.7 |
| Melbourne | 115.3 | 0.5 | 1.3 |
| Brisbane | 114.8 | 0.6 | 1.7 |
| Adelaide | 113.7 | 0.5 | 1.4 |
| Perth | 112.0 | 0.7 | 1.6 |
| Hobart | 114.1 | 0.6 | 2.3 |
| Darwin | 111.0 | 0.8 | 0.8 |
| Canberra | 113.5 | 0.3 | 1.7 |
| Weighted average of eight capital cities | 114.8 | 0.6 | 1.6 |
|
| (a) Index reference period: 2011-12 = 100.0. |
Main contributors by city:
Sydney (+0.7%)
- Automotive fuel (+11.8%); largest rise in automotive fuel of any capital city this quarter,
- Medical and hospital services (+2.5%)
- International holiday, travel and accommodation (+2.6%).
The rise was partially offset by:
- Fruit (-4.0%)
- Vegetables (-2.6%)
- Electricity (-1.3%).
Melbourne (+0.5%)
- Automotive fuel (+10.1%)
- Medical and hospital services (+2.3%)
- Tobacco (+2.3%)
- International holiday, travel and accommodation (+2.5%).
The rise was partially offset by:
- Domestic holiday, travel and accommodation (-4.9%)
- Fruit (-3.9%)
- Electricity (-1.8%)
- New dwelling purchase by owner-occupiers (-0.4%).
Brisbane (+0.6%)
- Automotive fuel (+10.7%)
- International holiday, travel and accommodation (+3.6%)
- Medical and hospital services (+2.4%)
- Tobacco (+2.6%).
The rise was partially offset by:
- Electricity (-5.1%); due to the Affordable Energy Plan with households receiving a $50 electricity rebate,
- Fruit (-4.7%).
Adelaide (+0.5%)
- Automotive fuel (+10.2%)
- Medical and hospital services (+3.8%)
- Tobacco (+2.5%).
The rise was partially offset by:
- Domestic holiday, travel and accommodation (-3.1%)
- Fruit (-6.0%)
- Electricity (-1.5%).
Perth (+0.7%)
- Automotive fuel (+9.1%)
- Medical and hospital services (+2.7%)
- International holiday, travel and accommodation (+2.6%).
The rise was partially offset by:
- Telecommunication equipment and services (-1.3%).
Hobart (+0.6%)
- Automotive fuel (+5.0%)
- Tobacco (+3.1%)
- Medical and hospital services (+3.1%)
- New dwelling purchase by owner-occupiers (+2.1%)
- Rents (+1.3%).
The rise was partially offset by:
- Domestic holiday, travel and accommodation (-7.3%)
- Fruit (-5.7%).
Darwin (+0.8%)
- Domestic holiday, travel and accommodation (+14.0%); driven by increased demand during the peak tourist season this quarter,
- Automotive fuel (+8.9%)
- Tobacco (+2.8%)
- International holiday, travel and accommodation (+3.5%).
The rise was partially offset by:
- Other financial services (-6.9%),
- Rents (-1.8%)
- Fruit (-6.0%).
Canberra (+0.3%)
- International holiday, travel and accommodation (+3.0%)
- Motor vehicles (+3.2%)
- Medical and hospital services (+1.8%)
- Automotive fuel (+1.7%); recorded the smallest rise in automotive fuel of any capital city this quarter.
The rise was partially offset by:
- Fruit (-5.0%)
- Urban transport (-12.3%); driven by free bus and light rail travel during the month of April.
 Quality Declaration
  Print Page
 Print All