This document was added or updated on 12/08/2019.
Main contributors to change
CPI groups
The discussion of the CPI groups below is ordered in terms of their absolute significance to the change in All groups index points for the quarter (see Tables 6 and 7). Unless otherwise stated, the analysis is in original terms.
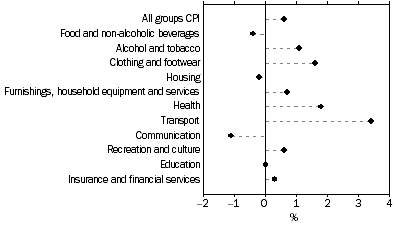
Weighted average of eight capital cities, Percentage change from previous quarter

Transport group (+3.4%)
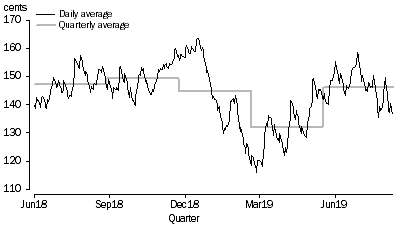
The main contributor to the rise in the transport group this quarter is automotive fuel (+10.2%) as rising world oil prices flow through to consumers. Automotive fuel rose in February (+4.2%), March (+5.2%), April (+5.7%) and May (+1.7%) and fell in June (-4.8%). Motor vehicles (+1.4%) also contributed to the rise with new motor vehicle models entering the market at higher prices.
The following graph shows the pattern of the average daily prices for unleaded petrol for the eight capital cities over the past fifteen months.
Average price of unleaded petrol (91 octane) cents per litre

Over the twelve months, the transport group rose 1.7%. The rise in motor vehicles (+3.4%) is partially offset by falls in automotive fuel (-0.5%).
In seasonally adjusted terms, the group rose 3.5% this quarter due to rises in automotive fuel (+10.2%).
Health group (+1.8%)
The main contributor to the rise in the health group this quarter is medical and hospital services (+2.6%) following the annual increase in Private Health Insurance premiums on 1 April.
In seasonally adjusted terms, the health group rose 0.2% this quarter due to a rise in medical and hospital services (+0.1%).
Over the twelve months, the group rose 3.0% due to the annual rise in medical and hospital services (+3.5%).
Alcohol and tobacco group (+1.1%)
The main contributor to the rise in the alcohol and tobacco group this quarter is tobacco (+2.4%).
Over the twelve months, the alcohol and tobacco group rose 5.9%.
In seasonally adjusted terms, the group rose 1.4% this quarter due to the rise in tobacco (+3.2%).
Food and non-alcoholic beverages group (-0.4%)
The main contributors to the fall in the food and non-alcoholic beverages group this quarter are fruit (-4.1%) and vegetables (-1.7%). The supply of bananas increased following adverse weather conditions in Queensland, while an increase in the supply of apples, citrus fruits and winter vegetables led to price falls this quarter.
Over the twelve months, the food and non-alcoholic beverages group rose 2.4%.
In seasonally adjusted terms, the group rose 0.1% this quarter due to the rise in milk (+1.9%).
Furnishings, household equipment and services group (+0.7%)
The main contributor to the rise in the furnishings, household equipment and services group this quarter is furniture (+1.6%).
Over the twelve months, the furnishings, household equipment and services group fell (-0.4%).
In seasonally adjusted terms, the group rose 0.3% this quarter due to the rise in child care (+1.6%).
Recreation and culture group (+0.6%)
The main contributor to the rise in the recreation and culture group this quarter is international holiday, travel and accommodation (+2.7%) as a result of Europe and America entering the start of their high tourist season.
Over the twelve months, the recreation and culture group rose 1.8%.
In seasonally adjusted terms, the group rose 1.3% this quarter due to domestic holiday, travel and accommodation (+2.5%).
Clothing and footwear group (+1.6%)
The main contributor to the rise in the clothing and footwear group this quarter is garments for women (+4.1%) as a result of winter clothing stock returning this quarter.
Over the twelve months, the clothing and footwear group rose 0.2% driven by the rise in garments for men (+4.8%).
In seasonally adjusted terms, the group rose 0.3% this quarter due to the rise in garments for women (+1.8%).
Housing group (-0.2%)
The main contributors to the fall in the housing group this quarter are electricity (-1.7%), gas and other household fuels (-0.5%) and new dwelling purchase by owner-occupiers (-0.2%). This is the first quarterly fall for the housing group since the March quarter 1998, driven by lower electricity and gas prices, weak housing market conditions and increasing rental vacancy rates in some capital cities.
Over the twelve months, the housing group rose 0.5%.
In seasonally adjusted terms, the group rose 0.2% this quarter due to the rise in maintenance and repair of the dwelling (+0.9%).
Communication group (-1.1%)
The main contributor to the fall in the communication group this quarter is telecommunication equipment and services (-1.3%).
Over the twelve months, the communication group fell 4.4%.
The communication group is not seasonally adjusted.
Insurance and financial services group (+0.3%)
The main contributor to the rise in the insurance and financial services group this quarter is other financial services (+0.4%).
Over the twelve months, the insurance and financial services group rose 0.9%.
In seasonally adjusted terms, the group rose 0.3% this quarter.
Education group (0.0%)
The group recorded no change this quarter.
Over the twelve months, the group rose 2.8% due to secondary education (+4.2%) and tertiary education (+2.4%).
In seasonally adjusted terms, the education group rose 0.7% this quarter with a rise in secondary education (+1.0%).
International trade exposure - tradables and non-tradables
Tradables (+1.2% quarter, +1.1% annual):
- Tradable goods component rose 1.2% due to automotive fuel (+10.2%).
- Tradable services component rose 2.5% due to international holiday, travel and accommodation (+2.7%)
Non-tradables (+0.2% quarter, +1.8% annual):
- Non-tradable goods component rose 0.2% due to tobacco (+2.4%)
- Non-tradable services component rose 0.3% due to medical and hospital services (+2.6%)
In seasonally adjusted terms, the tradables component of the All groups CPI rose 1.2% and the non-tradables component rose 0.5%.
Seasonally adjusted analytical series
In the June quarter 2019:
- All groups CPI seasonally adjusted rose 0.8%.
- The trimmed mean rose 0.4%, following a rise of 0.3% in the March quarter 2019.
- Over the twelve months to the June quarter 2019, the trimmed mean rose 1.6%, following a rise of 1.6% over the twelve months to the March quarter 2019.
- The weighted median rose 0.4%, following a rise of 0.1% in the March quarter 2019.
- Over the twelve months, the weighted median rose 1.3%, following a revised rise of 1.4% over the twelve months to the March quarter 2019.
 |  | Original | Seasonally adjusted |
 |  | Mar Qtr 2019 to Jun Qtr 2019 | Mar Qtr 2019 to Jun Qtr 2019 |
 |  | % | % |
|
| All groups CPI | 0.6 | 0.8 |
| Food and non-alcoholic beverages | -0.4 | 0.1 |
| Alcohol and tobacco | 1.1 | 1.4 |
| Clothing and footwear | 1.6 | 0.3 |
| Housing | -0.2 | 0.2 |
| Furnishings, household equipment and services | 0.7 | 0.3 |
| Health | 1.8 | 0.2 |
| Transport | 3.4 | 3.5 |
| Communication(a) | -1.1 | -1.1 |
| Recreation and culture | 0.6 | 1.3 |
| Education | 0.0 | 0.7 |
| Insurance and financial services | 0.3 | 0.3 |
| International trade exposure series |  |  |
 | Tradables | 1.2 | 1.2 |
 | Non-tradables | 0.2 | 0.5 |
|
| (a) not seasonally adjusted |
A detailed explanation of the seasonal adjustment of the All Groups CPI and calculation of the trimmed mean and weighted median measures is available in
Information Paper: Seasonal Adjustment of Consumer Price Indexes, 2011 (cat. no. 6401.0.55.003) available on the ABS website. Revisions to the seasonally adjusted estimates can be the result of the application of concurrent seasonal adjustment, described in paragraph 15 of the
Explanatory Notes.
 Print Page
 Print All
 Quality Declaration