ANALYSIS
TREND ESTIMATES
In trend terms the total number of jobs in Australia increased by 120,440 (or 0.9%), made up of 7,294 job vacancies and 113,146 filled jobs.
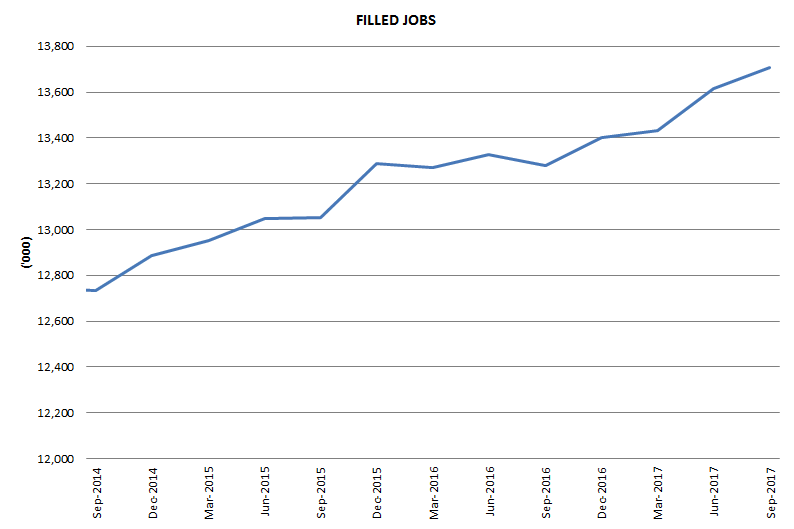
Filled jobs in Australia grew by 0.8% in the September quarter 2017, following a 1.0% rise in the June quarter 2017. Jobs grew 3.0% through the year in trend terms. The number of main jobs grew by 89,600 an increase of 0.7%; while secondary jobs grew by 23,546 an increase of 2.7% in the September quarter 2017.
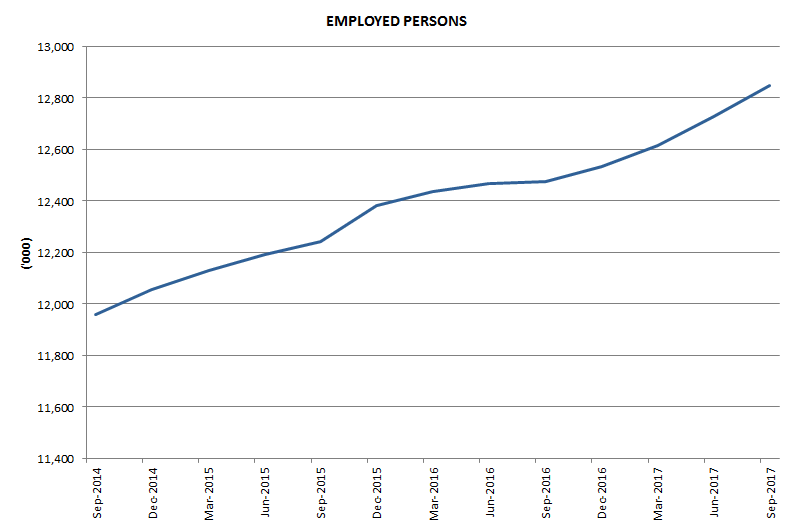
The total number of employed persons increased by 0.8% to 12.8 million in the September quarter 2017.
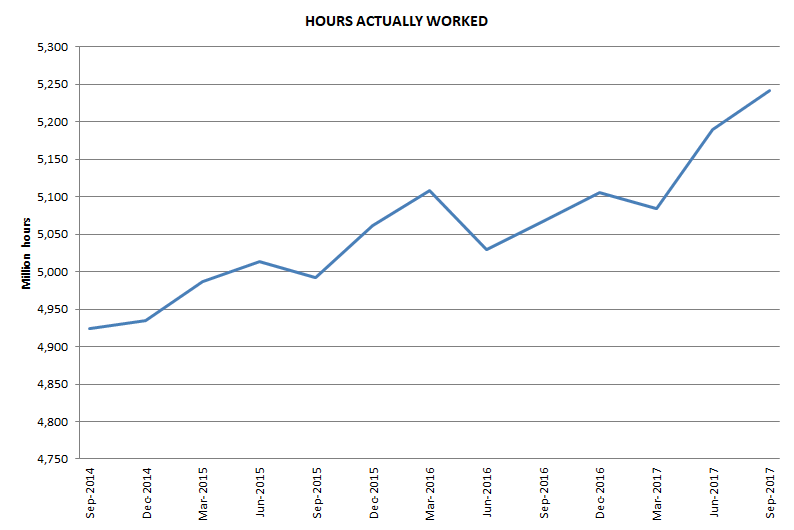
The total number of hours actually worked increased by 1.0% to 5,232 million hours and the total labour income increased by 1.1% to 235,856 million dollars.
SEASONALLY ADJUSTED ESTIMATES
Jobs
Filled jobs in Australia grew by 0.7% in the September quarter 2017, following a 1.4% rise in the June quarter 2017. Jobs grew 3.2% through the year in seasonally adjusted terms.
The total number of jobs in Australia increased by 104,901 (or 0.8%), made up of 12,155 job vacancies and 92,746 filled jobs.
The number of main jobs grew by 68,490 an increase of 0.5%; while secondary jobs grew by 24,256 an increase of 2.8% in the September quarter 2017.
Persons
The total number of employed persons increased by 0.9% to 12.8 million in the September quarter 2017.
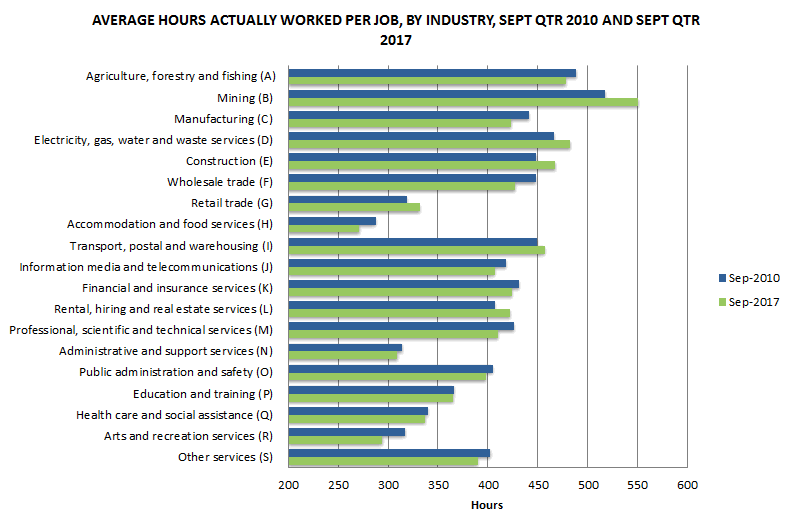
The proportion of employed persons working more than one job was 6.8% in the September quarter 2010 and 6.9% in the September quarter 2017.
Volumes
The total number of hours actually worked increased by 0.9% to 5,239 million hours; while the total number of hours paid increased 0.9% to 5,629 million hours.
Payments
Total labour income increased by 1.1% to 235,892 million dollars.
Total compensation of employees increased by 1.2% to 212,857 million dollars, and labour income from self-employment decreased by 0.2% to 23,034 million dollars.
Over the same period, total labour costs increased by 2,866 million dollars (1.2%) to 250,208 million dollars.
Ratios
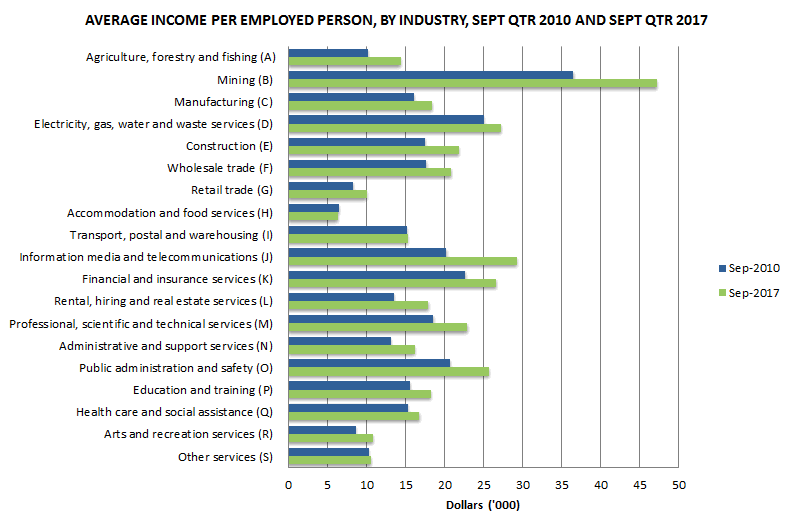
Average income per person increased by 0.2% to $18,361 in the September quarter 2017.
Average hours worked per job increased by 0.2% to 382 hours.
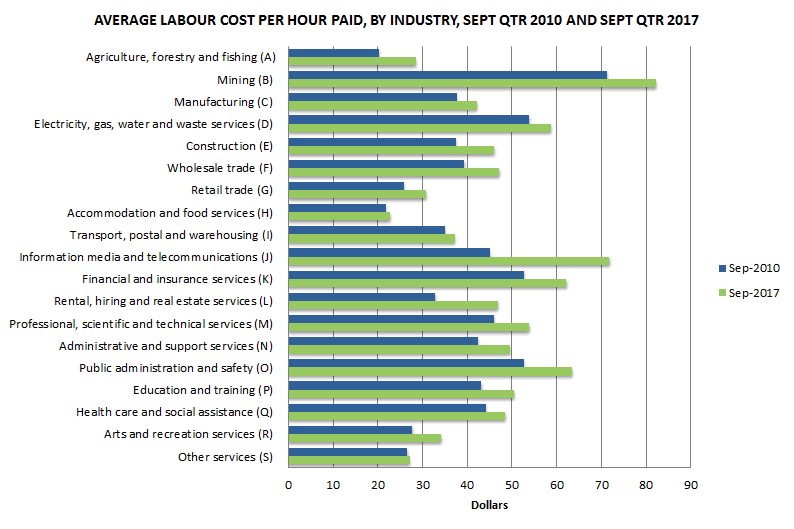
Average labour cost per hour paid remained the same at $44.
Average hourly income per Labour Accounts Employed Person worked per job is the hours actually worked divided by all filled jobs.
 Quality Declaration
  Print Page
 Print All