SPOTLIGHT: EDUCATION AND TRAINING INDUSTRY
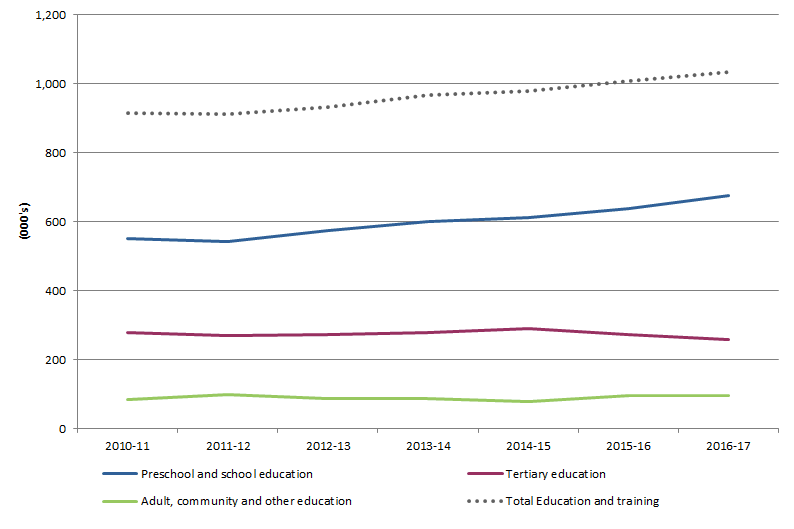
The latest data from the Australian Labour Account shows that there were over 1.0 million filled jobs in the Education and training industry, accounting for 7.7 per cent of all jobs.
In addition to providing information for the Education and training industry, the Labour Account also now provides useful insights into changes for the three subdivisions within it: Preschool and school education, Tertiary education, and Adult, community and other education. From this it is possible to see the relative contribution of the different parts of the industry to the total labour market over time.
Total jobs increased by 13.1 per cent from 2010-11 to 2016-17, making Education and training the fourth fastest growing industry over the period. This was driven by a growth of 22.6 per cent in Preschool and school education filled jobs, possibly due to a rise in the number of school aged children, and the standardisation of educator to child ratios by the National Quality Framework in 2012. There was also a 16.4 per cent increase in Adult, community and other education filled jobs. This may have been due to the combined demand for education support services, which are provided by Adult, community and other education, from the Preschool and school education and Tertiary education subdivisions.
Graph 1: Filled jobs
Source: Labour Account Australia, Quarterly Experimental Estimates (cat: 6150.0.55.003)
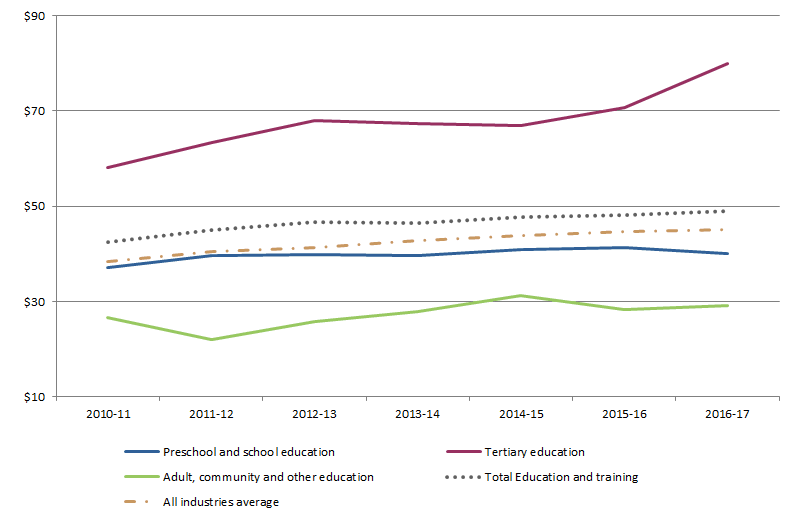
Labour income includes social contributions from employers, as well as wages and salaries and income from self-employment. The average hourly income per Labour Account employed person in the Education and training industry rose by 14.9 per cent, from $42.55 in 2010-11, to $48.90 in 2016-17. Tertiary education saw the most growth, increasing 37.7 per cent to $80.00. This was potentially driven by the increase in both international and domestic demand for services provided by this subdivision. Tertiary education has become more accessible in recent years, as advancements in the digital realm have enabled the shift to online delivery .
Graph 2: Average hourly income per employed person
Source: Labour Account Australia, Quarterly Experimental Estimates (cat: 6150.0.55.003)
A secondary job is any job worked by an employed person, other than their main job (note that people can have more than one secondary job). The Education and training industry accounted for 53,900 (or 6.4 per cent) of the 843,800 secondary jobs in Australia. This equated to 5.2 per cent of all Education and training filled jobs.
Secondary jobs have been in decline since 2013-14 for both Preschool and school education and Tertiary education. In 2016-17 there were 27,700 (down 11,000 since 2013-14) secondary jobs in Preschool and school education and 21,300 (down 11,700 since 2013-14) in Tertiary education.
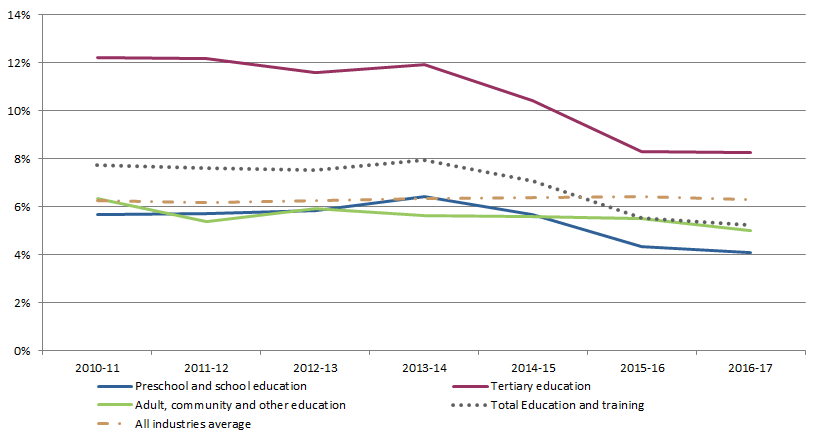
Secondary jobs as a share of filled jobs in the Education and training industry decreased from 7.9 per cent in 2013-14 to 5.2 per cent in 2016-17. Tertiary education (the subdivision with the greatest proportion of secondary jobs to filled jobs) dropped from 11.9 per cent in 2013-14, to 8.2 per cent in 2016-17. Similarly, Preschool and school education dropped from 6.4 per cent in 2013-14, to 4.1 per cent in 2016-17. Adult, community and other education remained relatively steady throughout the period, fluctuating between 6.3 per cent in 2010-11, and 5.0 per cent in 2016-17.
Graph 3: Secondary jobs as a share of filled jobs
Source: Labour Account Australia, Quarterly Experimental Estimates (cat: 6150.0.55.003)
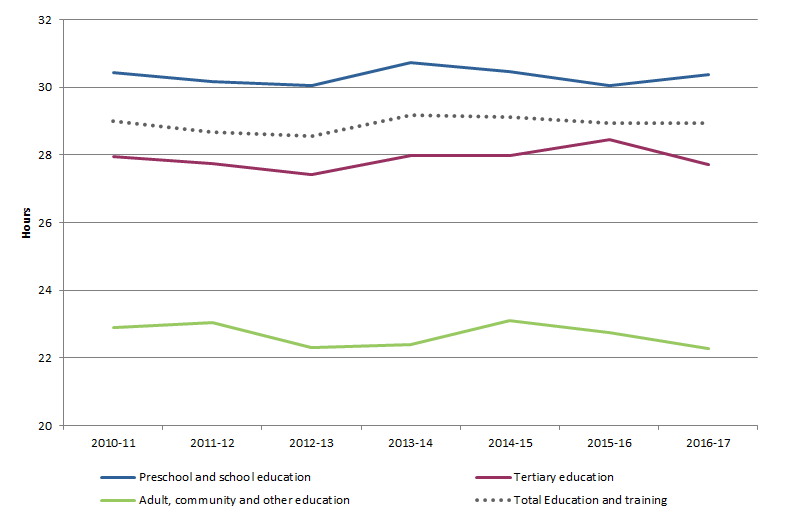
The number of average weekly hours actually worked per employed person remained steady across Education and training, decreasing by 0.2 per cent to 28.9 hours over the seven years since 2010-11. This decrease reflects a faster rate of growth in the number of employed persons (14.1 per cent) compared with the number of hours actually worked (13.9 per cent). Preschool and school education remained steady, with a decrease of 0.3 per cent to 30.4 hours over the period.
The digital disruption which may have affected the average hourly wage for Tertiary education may also have had an impact on the number of hours worked for that subdivision. As well as increasing the number of potential students, online delivery may also be accountable for the average weekly hours worked per employed person in Tertiary education declining by 2.6 per cent, to 27.7 hours in 2016-17.
Graph 4: Average weekly hours worked per employed person
Source: Labour Account Australia, Quarterly Experimental Estimates (cat: 6150.0.55.003)
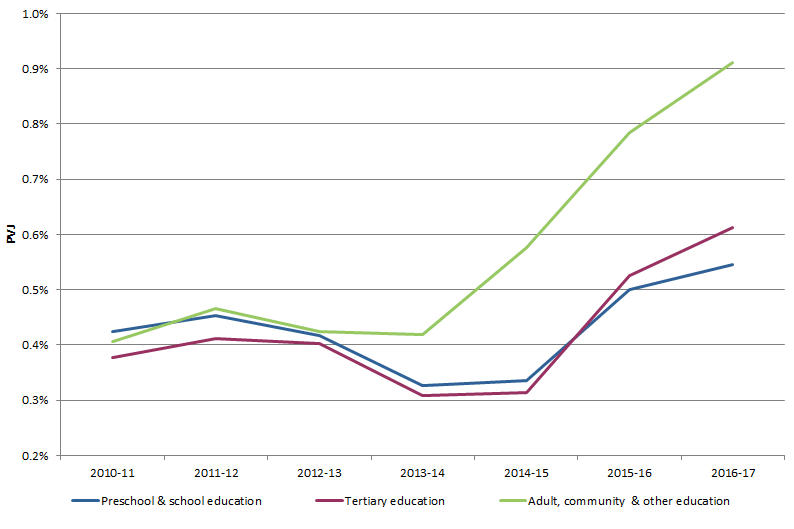
Job vacancies in Education and training rose by 65.3 per cent, from 3,800 vacancies in 2010-11 to 6,200 vacancies in 2016-17. This upwards trend was consistent across all three subdivisions. The Proportion of Vacant Jobs (or PVJ) is calculated from the ratio of Job Vacancies to the industry Labour Force. There was an increase in the PVJ in recent years in all three Education and training subdivisions, most prominently in Adult, community and other education which increased from 0.4% in 2013-14, to 0.9% in 2016-17. See Proportion of Vacant Jobs - A New Way to Analyse the Labour Market for further information on PVJ for a more in-depth explanation and analysis of the PVJ.
Graph 5: Proportion of Vacant Jobs
Source: Proportion of Vacant Jobs - A New Way to Analyse the Labour Market, Labour Account Australia, Quarterly Experimental Estimates (cat: 6150.0.55.003)
As this spotlight has shown, the Australian Labour Account provides an overarching picture of the Australian labour market. Through bringing together a range of data, it is possible to produce highly coherent estimates of the number of jobs, people, hours worked and labour income in each industry.
Information on the Education and training industry can be found in Table 17 (for quarterly information) or Table 38 (for annual information, including information for the three subdivisions).
 Print Page
 Print All
 Quality Declaration