|
|
TASMANIA
SUMMARY OF FINDINGS
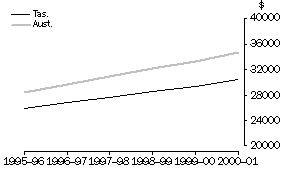
For the financial year 2000-01, the average individual annual wage and salary income for wage and salary earners in Tasmania was $30,411. This was an increase of 3.5% over the previous year ($29,385) and a 17.3% increase on the average in 1995-96 ($25,915). The average annual rate of increase over the last five years has been 3.3%. The overall increase of 17.3% since 1995-96 was the lowest of all the states and territories.
Over the period 1995-96 to 2000-01 Tasmanian employees had the lowest average wage and salary incomes in the nation. The difference between the average for Tasmania and the average for Australia was around $2,580 in 1995-96 and around $4,330 in 2000-01. The difference in average employee earnings between Tasmania and the state with the second lowest average earnings has more than doubled during the period 1995-96 to 2000-01, increasing from around $585 in 1995-96 to around $1,425 in 2000-01. In 2000-01 average earnings in Tasmania were $9,169 less than the average for employees in the Australian Capital Territory, the state/territory with the highest average ($39,580). It should be noted that in comparison to the other states and territories, Tasmania has the highest proportion of part-time employees which is a contributing factor to the low average incomes compiled from these ATO data.
Total wage and salary income paid to Tasmania's wage and salary earners increased from $4.4 billion in 1995-96 to $5.0 billion in 2000-01, an increase of 13.8%. The increase to 2000-01 over the last year was 4.4% (up from $4.8 billion) which was significantly higher than the average annual rate of increase for the last five years (2.6%). Over the five year period to 2000-01, the number of wage and salary earners has decreased by 3.1%, from around 170,270 people to 165,065 people.
AVERAGE ANNUAL WAGE AND SALARY INCOME,
Tasmania and Australia, 1995-96 to 2000-01
 Source: ATO Income Tax Data.
METROPOLITAN AND NON-METROPOLITAN TASMANIA
In 2000-01, 43.4% of the state's wage and salary earners resided in metropolitan Tasmania (i.e. Greater Hobart Statistical Division). Metropolitan Tasmania comprised 42.2% of the state's population aged 15 years and over in 2000-01.
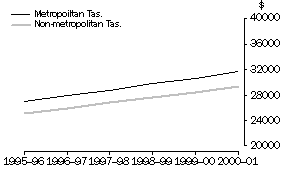
The average wage and salary income for persons in the metropolitan area in 2000-01 was $31,677 or 7.7% more than the average for employees in non-metropolitan areas. The percentage difference between the average for persons in the metropolitan and non-metropolitan areas has remained relatively steady over the five years from 1995-96 to 2000-01 fluctuating between a low of 6.9% in 1997-98 to a high of 8.2% in 1999-00. For the other years the percentage difference was around 7.7%.
WAGE AND SALARY EARNERS, Metropolitan(a) and non-metropolitan Tasmania, 1995-96 to 2000-01
 |  |  |  |  |  |  | % Change |
 |  |  |  |  |  |  |
|
 | 1995-96 | 1996-97 | 1997-98 | 1998-99 | 1999-00 | 2000-01 | 1999-00 to 2000-01 | 1995-96 to 2000-01(b) |
|
WAGE AND SALARY EARNERS (no.) |
|
| Metropolitan Tas. | 73,112 | 72,320 | 71,192 | 71,016 | 70,778 | 71,643 | 1.2 | -0.4 |
| Non-metropolitan Tas. | 96,432 | 94,725 | 93,302 | 92,850 | 92,196 | 92,741 | 0.6 | -0.8 |
| Total Tas.(c) | 170,273 | 167,719 | 165,200 | 164,483 | 163,623 | 165,065 | 0.9 | -0.6 |
|
WAGE AND SALARY INCOME ($m) |
|
| Metropolitan Tas. | 1,974.5 | 2,016.8 | 2,046.4 | 2,113.5 | 2,172.7 | 2,269.5 | 4.5 | 2.8 |
| Non-metropolitan Tas. | 2,416.9 | 2,454.0 | 2,508.7 | 2,567.0 | 2,614.8 | 2,727.6 | 4.3 | 2.4 |
| Total Tasmania(c) | 4,412.7 | 4,491.9 | 4,577.2 | 4,699.9 | 4,808.0 | 5,019.7 | 4.4 | 2.6 |
|
AVERAGE WAGE AND SALARY INCOME ($) |
|
| Metropolitan Tas. | 27,007 | 27,888 | 28,745 | 29,761 | 30,697 | 31,677 | 3.2 | 3.2 |
| Non-metropolitan Tas. | 25,064 | 25,907 | 26,888 | 27,647 | 28,362 | 29,411 | 3.7 | 3.3 |
| Total Tas.(c) | 25,915 | 26,782 | 27,707 | 28,574 | 29,385 | 30,411 | 3.5 | 3.3 |
 |  |  |  |  |  |  |  |  |
| Metropolitan/non-metropolitan difference(d) (%) | 7.8 | 7.6 | 6.9 | 7.6 | 8.2 | 7.7 | - | - |
|
(a) Metropolitan Tasmania has been defined as comprising the Greater Hobart Statistical Division.
(b) Average annual rate of increase.
(c) Total includes data that could not be allocated to either metropolitan or non-metropolitan.
(d) Non-metropolitan Tasmania used as denominator to calculate percentage difference.
Note: Indigenous persons engaged in CDEP projects may be included in the above data for the years 1995-96 to 1997-98 and excluded for 1998-99 onwards. Consequently changes between 1997-98 and 1998-99 and 1995-96 and 2000-01 in particular need to be treated with caution. For further details please refer to the Explanatory Notes.
Source: ATO Income Tax Data.
AVERAGE ANNUAL WAGE AND SALARY INCOME,
Metropolitan and non-metropolitan Tasmania, 1995-96 to 2000-01
 Source: ATO Income Tax Data.
LOCAL GOVERNMENT AREAS
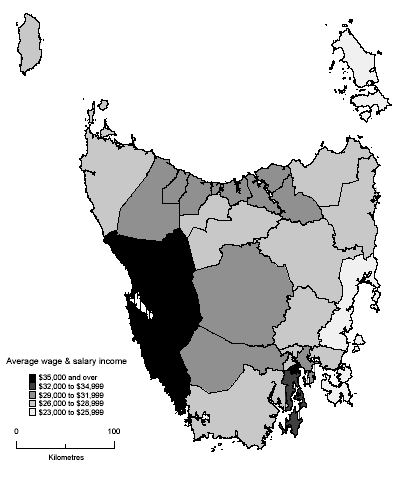
In 2000-01, the local government area with the highest average wage and salary income in Tasmania was West Coast (M), with an annual average of $37,586. The main economic activity in the West Coast municipality is the mining of metallic minerals and, as is the case in many other parts of Australia, areas with mining activity generally exhibit high average incomes. However, the average for West Coast (M) is significantly lower than the average in many of the other mining LGAs on the mainland.
Hobart City Council had the second highest average wage and salary income in 2000-01 ($35,202), followed by the neighbouring LGAs of Kingborough ($32,637) and Clarence ($31,532). In the north of the state near Launceston, on the banks of the Tamar River, West Tamar and George Town municipalities also had relatively high averages with $30,924 and $30,887 respectively. The average in Launceston, the most populated local government area in Tasmania, was $30,163 - ranked 8th.
Of the 29 local government areas in the state, seven had averages above that for the state ($30,411) while two had averages above the national figure of $34,745.
LGAs WITH HIGHEST AVERAGE ANNUAL WAGE AND SALARY INCOME, Tasmania, 2000-01
| LGA Code | LGA Name | $ |
|
| 65610 | West Coast (M) | 37,586 |
| 62810 | Hobart (C) | 35,202 |
| 63610 | Kingborough (M) | 32,637 |
| 61410 | Clarence (C) | 31,532 |
| 65810 | West Tamar (M) | 30,924 |
|
Source: ATO Income Tax Data.
Local government areas along the east coast recorded the lowest average wage and salary incomes in Tasmania in 2000-01. Tasman (M) had the lowest average with $23,829 while Glamorgan/Spring Bay, Break O'Day and Southern Midlands municipalities had averages around $26,000 per annum. Flinders (M), i.e. Flinders Island, had the second lowest average in Tasmania ($25,371) and Huon Valley in the south of the state had the fourth lowest ($26,016). Agriculture, fishing, forestry and tourism are the major industries in these LGAs and it should be noted that the wage and salary earner data presented here excludes persons in their own business such as farmers, fishermen and other local business owners. Low average incomes are also evident in areas with significant tourism activity as many employees are employed on a part-time basis.
LGAs WITH LOWEST AVERAGE ANNUAL WAGE AND SALARY INCOME, Tasmania, 2000-01
| LGA Code | LGA Name | $ |
|
| 65210 | Tasman (M) | 23,829 |
| 62010 | Flinders (M) | 25,371 |
| 62410 | Glamorgan/Spring Bay (M) | 25,797 |
| 63010 | Huon Valley (M) | 26,016 |
| 60210 | Break O'Day (M) | 26,155 |
|
Source: ATO Income Tax Data.
AVERAGE ANNUAL WAGE AND SALARY INCOME, LGAs, Tasmania, 2000-01
 Source: ATO Income Tax Data.
WAGE AND SALARY EARNERS, LGAs, Tasmania, 1999-2000 and 2000-01
 |  |  |  | 1999-2000 |  |  | 2000-01 |
 |  |
|
|
| LGA Code | LGA Name | Wage and salary earners | Wage and salary income | Average wage and salary income | Wage and salary earners | Wage and salary income | Average wage and salary income |
 |  | no. | $m | $ | no. | $m | $ |
|
| 60210 | Break O'Day (M) | 1,414 | 35.4 | 25,016 | 1,436 | 37.6 | 26,155 |
| 60410 | Brighton (M) | 4,380 | 121.4 | 27,721 | 4,451 | 127.4 | 28,613 |
| 60610 | Burnie (C) | 6,242 | 186.9 | 29,938 | 6,272 | 193.3 | 30,827 |
| 60810 | Central Coast (M) | 6,955 | 196.0 | 28,182 | 6,925 | 203.0 | 29,313 |
| 61010 | Central Highlands (M) | 835 | 23.6 | 28,240 | 829 | 24.2 | 29,188 |
| 61210 | Circular Head (M) | 2,818 | 73.5 | 26,077 | 2,771 | 76.1 | 27,467 |
| 61410 | Clarence (C) | 18,023 | 547.9 | 30,398 | 18,261 | 575.8 | 31,532 |
| 61510 | Derwent Valley (M) | 3,160 | 91.0 | 28,784 | 3,124 | 92.9 | 29,745 |
| 61610 | Devonport (C) | 8,725 | 246.3 | 28,228 | 8,715 | 253.3 | 29,065 |
| 61810 | Dorset (M) | 2,509 | 65.0 | 25,912 | 2,503 | 68.4 | 27,325 |
| 62010 | Flinders (M) | 294 | 7.2 | 24,653 | 313 | 7.9 | 25,371 |
| 62210 | George Town (M) | 2,049 | 61.4 | 29,947 | 2,096 | 64.7 | 30,887 |
| 62410 | Glamorgan/Spring Bay (M) | 1,134 | 28.1 | 24,749 | 1,159 | 29.9 | 25,797 |
| 62610 | Glenorchy (C) | 14,565 | 405.7 | 27,853 | 14,695 | 419.1 | 28,517 |
| 62810 | Hobart (C) | 18,427 | 630.2 | 34,200 | 18,563 | 653.5 | 35,202 |
| 63010 | Huon Valley (M) | 4,238 | 106.6 | 25,144 | 4,319 | 112.4 | 26,016 |
| 63210 | Kentish (M) | 1,424 | 37.8 | 26,513 | 1,413 | 37.6 | 26,631 |
| 63410 | King Island (M) | 653 | 16.3 | 24,969 | 673 | 18.1 | 26,832 |
| 63610 | Kingborough (M) | 10,946 | 344.0 | 31,423 | 11,177 | 364.8 | 32,637 |
| 63810 | Latrobe (M) | 2,646 | 74.8 | 28,270 | 2,678 | 77.9 | 29,074 |
| 64010 | Launceston (C) | 22,353 | 647.2 | 28,955 | 22,522 | 679.3 | 30,163 |
| 64210 | Meander Valley (M) | 5,323 | 146.1 | 27,449 | 5,302 | 151.9 | 28,657 |
| 64610 | Northern Midlands (M) | 4,092 | 113.4 | 27,704 | 4,202 | 121.2 | 28,850 |
| 64810 | Sorell (M) | 3,685 | 100.8 | 27,347 | 3,764 | 106.2 | 28,220 |
| 65010 | Southern Midlands (M) | 1,437 | 36.6 | 25,492 | 1,433 | 37.8 | 26,396 |
| 65210 | Tasman (M) | 548 | 12.5 | 22,831 | 575 | 13.7 | 23,829 |
| 65410 | Waratah/Wynyard (M) | 4,404 | 126.9 | 28,819 | 4,402 | 131.0 | 29,767 |
| 65610 | West Coast (M) | 2,183 | 80.6 | 36,932 | 2,197 | 82.6 | 37,586 |
| 65810 | West Tamar (M) | 7,512 | 224.6 | 29,895 | 7,614 | 235.5 | 30,924 |
| 69999 | LGA unknown | 649 | 20.5 | 31,604 | 681 | 22.6 | 33,223 |
 | Total Tasmania | 163,623 | 4,808.0 | 29,385 | 165,065 | 5,019.7 | 30,411 |
|
Source: ATO Income Tax Data.
|
 Print Page
 Print All