|
|
VICTORIA
SUMMARY OF FINDINGS
For the financial year 2000-01, the average individual annual wage and salary income for wage and salary earners in Victoria was $34,894. This was an increase of 4.6% over the previous year ($33,347) and a 21.7% increase on the average in 1995-96 ($28,676). The annual average rate of increase over the last five years has been 4.0%.
Average earnings for employees in Victoria in 2000-01 were the fourth highest in the nation and over the period shown, 1995-96 to 2000-01, have been virtually the same as the average for all wage and salary earners across Australia. Since 1995-96, the Victorian average has generally been around $4,200 to $4,700 less than the highest state/territory average as recorded in the Australian Capital Territory.
Total wage and salary income paid to the state's wage and salary earners increased from $62.3 billion in 1999-00 to $65.7 billion in 2000-01, an increase of 5.5%. This was slightly higher than the average annual rate of increase for the five years from 1995-96 to 2000-01 (5.3%). In 1995-96 total wages and salaries paid was $50.9 billion. The number of wage and salary earners in Victoria have increased from around 1.77 million people in 1995-96 to 1.88 million people in 2000-01, an overall increase of 6.2%.
AVERAGE ANNUAL WAGE AND SALARY INCOME,
Victoria and Australia, 1995-96 to 2000-01
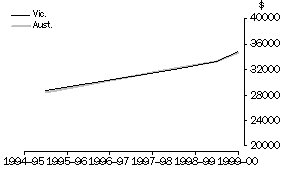 Source: ATO Income Tax Data.
METROPOLITAN AND NON-METROPOLITAN VICTORIA
In 2000-01, 78.8% of the state's wage and salary earners resided in metropolitan Victoria (i.e. Melbourne Statistical Division and Greater Geelong City Part A Statistical Subdivision). At 30 June 2001 metropolitan Victoria comprised 76.2% of the state's population aged 15 years and over.
The average wage and salary income for persons in the metropolitan area in 2000-01 was $36,260, or 21.9% more than the average for employees in non-metropolitan areas. This percentage difference has increased over the five year period since 1995-96 when it was 18.9%.
WAGE AND SALARY EARNERS, Metropolitan(a) and non-metropolitan Victoria, 1995-96 to 2000-01
 | | | | | | | % Change |
| | | | | | |
|
| 1995-96 | 1996-97 | 1997-98 | 1998-99 | 1999-00 | 2000-01 | 1999-00 to 2000-01 | 1995-96 to 2000-01(b) |
|
WAGE AND SALARY EARNERS (no.) |
|
| Metropolitan Vic. | 1,398,303 | 1,410,203 | 1,439,934 | 1,457,087 | 1,471,970 | 1,484,027 | 0.8 | 1.2 |
| Non-metropolitan Vic. | 371,063 | 372,636 | 380,224 | 386,358 | 391,297 | 395,062 | 1.0 | 1.3 |
| Total Vic.(c) | 1,773,635 | 1,787,271 | 1,824,553 | 1,848,033 | 1,867,959 | 1,883,823 | 0.8 | 1.2 |
|
WAGE AND SALARY INCOME ($m) |
|
| Metropolitan Vic. | 41,477.1 | 43,445.6 | 46,072.7 | 48,378.3 | 50,941.8 | 53,811.0 | 5.6 | 5.3 |
| Non-metropolitan Vic. | 9,256.0 | 9,669.7 | 10,208.4 | 10,717.1 | 11,185.6 | 11,754.8 | 5.1 | 4.9 |
| Total Vic.(c) | 50,860.4 | 53,250.8 | 56,428.0 | 59,250.3 | 62,290.1 | 65,734.7 | 5.5 | 5.3 |
|
AVERAGE WAGE AND SALARY INCOME ($) |
|
| Metropolitan Vic. | 29,662 | 30,808 | 31,996 | 33,202 | 34,608 | 36,260 | 4.8 | 4.1 |
| Non-metropolitan Vic. | 24,944 | 25,949 | 26,848 | 27,739 | 28,586 | 29,754 | 4.1 | 3.6 |
| Total Vic.(c) | 28,676 | 29,794 | 30,927 | 32,061 | 33,347 | 34,894 | 4.6 | 4.0 |
| | | | | | | | |
| Metropolitan/non-metropolitan difference(d) (%) | 18.9 | 18.7 | 19.2 | 19.7 | 21.1 | 21.9 | - | - |
|
(a) Metropolitan Victoria is defined as comprising the Melbourne Statistical Division and Greater Geelong City Part A Statistical Subdivision.
(b) Average annual rate of increase.
(c) Total includes data that could not be allocated to either metropolitan or non-metropolitan.
(d) Non-metropolitan Victoria used as denominator to calculate percentage difference.
Note: Indigenous persons engaged in CDEP projects may be included in the above data for the years 1995-96 to 1997-98 and excluded for 1998-99 onwards. Consequently changes between 1997-98 and 1998-99 and 1995-96 and 2000-01 in particular need to be treated with caution. For further details please refer to the Explanatory Notes.
Source: ATO Income Tax Data.
AVERAGE ANNUAL WAGE AND SALARY INCOME,
Metropolitan and non-metropolitan Victoria, 1995-96 to 2000-01
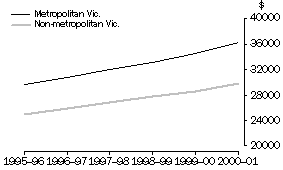 Source: ATO Income Tax Data.
LOCAL GOVERNMENT AREAS
In 2000-01, the local government area with the highest average wage and salary income in Victoria was Stonnington (C), with an annual average of $52,365. Stonnington (C) includes the suburbs of Toorak, Malvern, Kooyong, Prahan, South Yarra and Armadale as well as parts of Glen Iris and Windsor.
Seven of the top ten LGAs with the highest average wage and salary incomes in 2000-01 are located in the inner Melbourne area covering the north-eastern and bayside suburbs. In addition to Stonnington, these include Bayside ($48,872), Boroondara ($48,139), Port Phillip ($46,447), Melbourne ($41,941), Yarra ($41,129) and Glen Eira ($38,825).
Of the 79 local government areas in the state, fifteen had averages above that for both the state ($34,894) and the nation ($34,745).
LGAs WITH HIGHEST AVERAGE ANNUAL WAGE AND SALARY INCOME, Victoria, 2000-01
| LGA Code | LGA Name | $ |
|
| 26350 | Stonnington (C) | 52,365 |
| 20910 | Bayside (C) | 48,872 |
| 21110 | Boroondara (C) | 48,139 |
| 25900 | Port Phillip (C) | 46,447 |
| 24600 | Melbourne (C) | 41,941 |
|
Source: ATO Income Tax Data.
The six LGAs with the lowest annual average wage and salary incomes in 2000-01 are all located in the north-west of Victoria in the Mallee and Wimmera districts. Swan Hill (RC) had the lowest average with $25,556 followed by Buloke (S) ($25,783) and Gannawarra (S) ($25,933). Loddon, West Wimmera and Yarriambiack Shires had averages just over $26,000. It should be noted that these LGAs are predominantly agricultural districts and the wage and salary data presented here excludes persons in their own business such as farmers and other local business owners who are not wage and salary earners.
LGAs WITH LOWEST AVERAGE ANNUAL WAGE AND SALARY INCOME, Victoria, 2000-01
| LGA Code | LGA Name | $ |
|
| 26610 | Swan Hill (RC) | 25,556 |
| 21270 | Buloke (S) | 25,783 |
| 22250 | Gannawarra (S) | 25,933 |
| 23940 | Loddon (S) | 26,351 |
| 26890 | West Wimmera (S) | 26,420 |
|
Source: ATO Income Tax Data.
AVERAGE ANNUAL WAGE AND SALARY INCOME, LGAs, Victoria, 2000-01
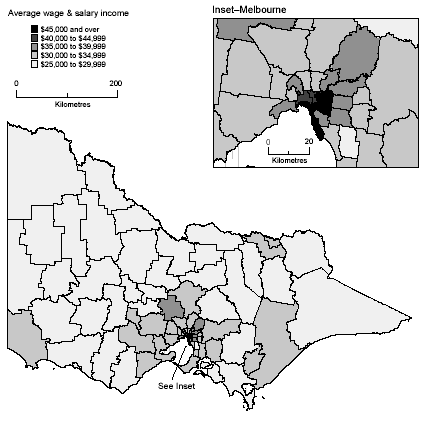 Source: ATO Income Tax Data.
WAGE AND SALARY EARNERS, LGAs, Victoria, 1999-2000 and 2000-01
| | | | 1999-2000 | | | 2000-01 |
| |
|
|
| LGA Code | LGA Name | Wage and salary earners | Wage and salary income | Average wage and salary income | Wage and salary earners | Wage and salary income | Average wage and salary income |
| | no. | $m | $ | no. | $m | $ |
|
| 20110 | Alpine (S) | 4,251 | 111.2 | 26,170 | 4,321 | 117.0 | 27,072 |
| 20260 | Ararat (RC) | 3,635 | 97.7 | 26,881 | 3,703 | 102.1 | 27,577 |
| 20570 | Ballarat (C) | 30,372 | 898.8 | 29,593 | 31,239 | 956.8 | 30,627 |
| 20660 | Banyule (C) | 50,706 | 1,779.6 | 35,095 | 50,520 | 1,850.9 | 36,638 |
| 20740 | Bass Coast (S) | 6,346 | 167.8 | 26,447 | 6,396 | 177.0 | 27,675 |
| 20830 | Baw Baw (S) | 12,650 | 366.2 | 28,947 | 12,623 | 377.7 | 29,920 |
| 20910 | Bayside (C) | 37,434 | 1,718.1 | 45,897 | 37,405 | 1,828.0 | 48,872 |
| 21110 | Boroondara (C) | 64,234 | 2,900.8 | 45,160 | 63,488 | 3,056.3 | 48,139 |
| 21180 | Brimbank (C) | 64,292 | 1,999.4 | 31,098 | 65,161 | 2,099.9 | 32,226 |
| 21270 | Buloke (S) | 2,060 | 48.9 | 23,715 | 1,951 | 50.3 | 25,783 |
| 21370 | Campaspe (S) | 12,345 | 342.1 | 27,710 | 12,418 | 360.9 | 29,064 |
| 21450 | Cardinia (S) | 17,427 | 538.4 | 30,897 | 17,918 | 574.0 | 32,036 |
| 21610 | Casey (C) | 74,466 | 2,345.2 | 31,493 | 77,839 | 2,533.5 | 32,549 |
| 21670 | Central Goldfields (S) | 3,541 | 94.9 | 26,806 | 3,611 | 98.7 | 27,341 |
| 21750 | Colac-Otway (S) | 7,070 | 189.0 | 26,733 | 7,062 | 196.2 | 27,784 |
| 21830 | Corangamite (S) | 4,749 | 122.4 | 25,775 | 4,672 | 125.5 | 26,854 |
| 21890 | Darebin (C) | 48,024 | 1,525.5 | 31,766 | 48,157 | 1,605.0 | 33,328 |
| 21950 | Delatite (S) | 6,806 | 185.0 | 27,178 | 6,814 | 190.9 | 28,018 |
| 22110 | East Gippsland (S) | 11,748 | 303.0 | 25,796 | 11,661 | 312.8 | 26,824 |
| 22170 | Frankston (C) | 44,698 | 1,383.8 | 30,959 | 44,837 | 1,439.5 | 32,104 |
| 22250 | Gannawarra (S) | 3,733 | 92.3 | 24,720 | 3,661 | 94.9 | 25,933 |
| 22310 | Glen Eira (C) | 49,851 | 1,815.9 | 36,427 | 49,937 | 1,938.8 | 38,825 |
| 22410 | Glenelg (S) | 6,606 | 200.5 | 30,349 | 6,636 | 210.5 | 31,718 |
| 22490 | Golden Plains (S) | 3,984 | 117.9 | 29,605 | 4,123 | 127.5 | 30,921 |
| 22620 | Greater Bendigo (C) | 30,591 | 853.5 | 27,900 | 31,525 | 915.0 | 29,023 |
| 22670 | Greater Dandenong (C) | 49,962 | 1,434.9 | 28,719 | 49,440 | 1,476.1 | 29,857 |
| 22750 | Greater Geelong (C) | 71,695 | 2,266.0 | 31,606 | 72,689 | 2,376.8 | 32,698 |
| 22830 | Greater Shepparton (C) | 21,610 | 599.7 | 27,753 | 21,756 | 627.4 | 28,838 |
| 22910 | Hepburn (S) | 4,214 | 116.2 | 27,571 | 4,318 | 124.3 | 28,798 |
| 22980 | Hindmarsh (S) | 1,860 | 47.6 | 25,617 | 1,725 | 47.3 | 27,395 |
| 23110 | Hobsons Bay (C) | 33,447 | 1,163.9 | 34,799 | 33,970 | 1,232.1 | 36,270 |
| 23190 | Horsham (RC) | 6,724 | 181.3 | 26,965 | 6,792 | 190.7 | 28,080 |
| 23270 | Hume (C) | 50,858 | 1,617.2 | 31,798 | 52,425 | 1,722.3 | 32,852 |
| 23350 | Indigo (S) | 4,746 | 144.1 | 30,365 | 4,828 | 151.6 | 31,410 |
| 23430 | Kingston (C) | 53,294 | 1,759.9 | 33,023 | 53,146 | 1,832.9 | 34,488 |
| 23670 | Knox (C) | 64,916 | 2,139.8 | 32,963 | 65,720 | 2,251.5 | 34,259 |
| 23810 | Latrobe (C) | 24,564 | 796.1 | 32,407 | 24,665 | 828.8 | 33,603 |
| 23940 | Loddon (S) | 2,257 | 55.6 | 24,616 | 2,180 | 57.4 | 26,351 |
| 24130 | Macedon Ranges (S) | 14,194 | 487.3 | 34,334 | 14,365 | 516.3 | 35,942 |
| 24210 | Manningham (C) | 47,809 | 1,765.8 | 36,934 | 46,875 | 1,839.2 | 39,236 |
| 24330 | Maribyrnong (C) | 22,079 | 711.2 | 32,210 | 21,425 | 725.0 | 33,840 |
| 24410 | Maroondah (C) | 44,341 | 1,462.8 | 32,991 | 44,415 | 1,527.8 | 34,397 |
| 24600 | Melbourne (C) | 20,347 | 820.1 | 40,303 | 22,032 | 924.1 | 41,941 |
| 24650 | Melton (S) | 21,486 | 673.2 | 31,330 | 23,229 | 758.1 | 32,636 |
| 24780 | Mildura (RC) | 17,062 | 446.7 | 26,183 | 17,050 | 468.4 | 27,469 |
| 24850 | Mitchell (S) | 10,254 | 315.6 | 30,775 | 10,497 | 333.2 | 31,747 |
| 24900 | Moira (S) | 8,601 | 227.7 | 26,468 | 8,545 | 239.5 | 28,033 |
| 24970 | Monash (C) | 68,799 | 2,372.7 | 34,488 | 67,769 | 2,444.1 | 36,066 |
| 25060 | Moonee Valley (C) | 48,043 | 1,710.9 | 35,611 | 47,990 | 1,800.0 | 37,508 |
| 25150 | Moorabool (S) | 9,146 | 290.5 | 31,763 | 9,418 | 312.4 | 33,173 |
| 25250 | Moreland (C) | 50,790 | 1,630.3 | 32,098 | 51,008 | 1,709.9 | 33,522 |
| 25340 | Mornington Peninsula (S) | 44,448 | 1,409.2 | 31,704 | 45,956 | 1,510.1 | 32,860 |
| 25430 | Mount Alexander (S) | 5,126 | 142.9 | 27,881 | 5,241 | 150.5 | 28,725 |
| 25490 | Moyne (S) | 4,893 | 129.7 | 26,509 | 4,929 | 135.2 | 27,438 |
| 25620 | Murrindindi (S) | 4,162 | 115.9 | 27,854 | 4,245 | 120.7 | 28,439 |
| 25710 | Nillumbik (S) | 27,978 | 1,017.5 | 36,367 | 27,992 | 1,067.4 | 38,132 |
| 25810 | Northern Grampians (S) | 4,427 | 120.0 | 27,102 | 4,344 | 123.6 | 28,460 |
| 25900 | Port Phillip (C) | 37,276 | 1,618.2 | 43,411 | 37,768 | 1,754.2 | 46,447 |
| 25990 | Pyrenees (S) | 1,908 | 50.1 | 26,262 | 1,875 | 51.6 | 27,534 |
| 26080 | Queenscliffe (B) | 1,058 | 34.7 | 32,763 | 1,023 | 34.1 | 33,317 |
| 26170 | South Gippsland (S) | 7,821 | 217.6 | 27,828 | 7,930 | 226.1 | 28,513 |
| 26260 | Southern Grampians (S) | 5,542 | 145.2 | 26,200 | 5,491 | 149.4 | 27,200 |
| 26350 | Stonnington (C) | 39,460 | 1,888.6 | 47,862 | 39,042 | 2,044.5 | 52,365 |
| 26430 | Strathbogie (S) | 3,024 | 79.1 | 26,157 | 2,977 | 80.9 | 27,192 |
| 26490 | Surf Coast (S) | 6,911 | 213.4 | 30,878 | 7,111 | 229.1 | 32,218 |
| 26610 | Swan Hill (RC) | 7,094 | 171.3 | 24,152 | 7,048 | 180.1 | 25,556 |
| 26670 | Towong (S) | 1,660 | 44.1 | 26,555 | 1,692 | 47.8 | 28,222 |
| 26700 | Wangaratta (RC) | 9,798 | 272.7 | 27,835 | 9,939 | 285.5 | 28,721 |
| 26730 | Warrnambool (C) | 10,435 | 291.4 | 27,922 | 10,519 | 302.5 | 28,757 |
| 26810 | Wellington (S) | 13,463 | 412.2 | 30,621 | 13,481 | 432.2 | 32,060 |
| 26890 | West Wimmera (S) | 1,235 | 29.9 | 24,209 | 1,170 | 30.9 | 26,420 |
| 26980 | Whitehorse (C) | 60,404 | 2,151.6 | 35,620 | 59,607 | 2,231.7 | 37,440 |
| 27070 | Whittlesea (C) | 46,723 | 1,402.4 | 30,014 | 47,707 | 1,488.9 | 31,210 |
| 27170 | Wodonga (RC) | 13,621 | 411.4 | 30,201 | 13,822 | 434.3 | 31,421 |
| 27260 | Wyndham (C) | 36,560 | 1,206.8 | 33,008 | 38,035 | 1,302.0 | 34,232 |
| 27350 | Yarra (C) | 31,231 | 1,210.0 | 38,742 | 31,561 | 1,298.1 | 41,129 |
| 27450 | Yarra Ranges (S) | 60,131 | 1,852.8 | 30,813 | 60,507 | 1,940.8 | 32,075 |
| 27630 | Yarriambiack (S) | 2,137 | 53.2 | 24,887 | 2,102 | 55.7 | 26,519 |
| 29399 | Unincorporated Vic | 24 | 0.6 | 26,783 | 25 | 0.7 | 29,672 |
| 29999 | LGA Unknown | 4,692 | 162.6 | 34,664 | 4,734 | 168.9 | 35,683 |
| Total Victoria | 1,867,959 | 62,290.1 | 33,347 | 1,883,823 | 65,734.7 | 34,894 |
|
Source: ATO Income Tax Data.
|
 Print Page
 Print All