|
|
ADJUSTED MEASURES OF GOVERNMENT REVENUE
The taxation revenue statistics presented in this release are in accordance with the Australian System of Government Finance Statistics (GFS). This system is outlined in the Australian System of Government Finance Statistics: Concepts, Sources and Methods (cat. no. 5514.0) which is consistent with the International Monetary Fund's Government Finance Statistics Manual 2001 (IMF GFSM 2001).
The GFS framework reflects taxation revenue collected by each level of government. The purpose of this section is to consider an alternative presentation of revenue which takes into account the level of government at which revenue is used rather than simply collected. The analysis considers the flows, by way of current grants, that occur between the levels of government in Australia, and the impact that this has on revenue at each of these levels. Also considered is the effect of direct and indirect transfers to households on total revenue. To aid in the understanding of these flows, the following analytical measures of revenue have been derived. Users should note that these measures are not themselves part of the GFS framework.
ADJUSTED TAXATION REVENUE
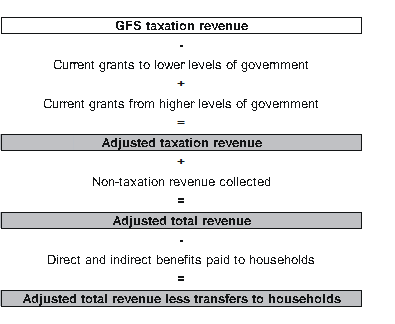
Adjusted taxation revenue is equal to GFS taxation revenue collected by each level of government, plus current grants received from higher levels of government, less current grants paid to lower levels of government. This measure is designed to give a clearer indication of the levels of government at which taxation revenue is actually used or spent. The source for a significant amount of the current grants distributed between levels of government is taxation revenue, such as the GST. However, some of the revenue distributed may have come from a source other than taxation. Further, it should be noted that some of the current grants transferred from Commonwealth Government to the state and local governments are Specific Purpose Payments (SPPs). Unlike the GST-related grants, these payments are 'tied' to specific policy areas as agreed between the two levels of government. Similar arrangements exist between state and local government. SPPs for current purposes are included with other current grants in deriving adjusted taxation revenue.
ADJUSTED TOTAL REVENUE
Adjusted total revenue is equal to adjusted taxation revenue plus all other non-taxation sources of revenue. Non-taxation revenue includes revenue from sales of goods and services, property income (interest, dividends, income tax equivalents, land rents and royalties), fines, capital transfers, and current transfers other than grants. Current grants are excluded from non-taxation revenue because these have already been taken into account in deriving adjusted taxation revenue.
ADJUSTED TOTAL REVENUE LESS TRANSFERS TO HOUSEHOLDS
An important role of government is the redistribution of income, by way of direct and indirect 'benefits', to individual households. These transfers can be deducted from adjusted total revenue to derive adjusted total revenue less transfers to households. Direct benefits are regular cash payments made to households by government without any requirement to provide goods and services in return (e.g. welfare payments). Indirect benefits are non-cash benefits and services provided by government to individual households (e.g. concessions for transport and utilities, medical and pharmaceutical benefits and natural disaster relief).
The three derived measures explained above are illustrated in the following diagram:

Table 1 shows the derivation of adjusted taxation revenue, for all three levels of government in Australia.
TABLE 1. ADJUSTED TAXATION REVENUE, by level of government, and as % of GDP(a) |
|
 | 2006–07 | 2007–08 | 2008–09 | 2009–10 | 2010–11 | 2011–12 |
 | $m | $m | $m | $m | $m | $m |
COMMONWEALTH |
|
| 1. Taxation revenue collected(b) | 262 101 | 285 954 | 278 363 | 267 556 | 289 124 | 317 888 |
| As % of GDP | 24.2 | 24.3 | 22.2 | 20.7 | 20.6 | 21.6 |
| As % of total tax revenue | 81.9 | 82.0 | 82.0 | 80.3 | 80.5 | 81.5 |
| 2. Current grants to state government(c) | 63 873 | 69 480 | 73 087 | 75 682 | 79 978 | 84 064 |
| 3. Current grants to local government | 56 | 89 | 46 | 12 | 14 | 35 |
| 4. Current grants to multi–jurisdictional sector(d) | 5 589 | 7 347 | 6 691 | 8 808 | 8 250 | 8 617 |
| 5. Adjusted taxation revenue =1–2–3–4(e) | 192 583 | 209 038 | 198 539 | 183 055 | 200 881 | 225 173 |
| As % of GDP | 17.8 | 17.8 | 15.8 | 14.2 | 14.3 | 15.3 |
| As % of total tax revenue | 60.2 | 60.0 | 58.5 | 55.0 | 56.0 | 57.7 |
STATE |
|
| 1. Taxation revenue collected(b) | 48 874 | 53 134 | 50 631 | 54 536 | 58 121 | 59 686 |
| As % of GDP | 4.5 | 4.5 | 4.0 | 4.2 | 4.1 | 4.0 |
| As % of total tax revenue | 15.3 | 15.2 | 14.9 | 16.4 | 16.2 | 15.3 |
| 2. Current grants from Commonwealth government | 63 873 | 69 480 | 73 087 | 75 682 | 79 978 | 84 064 |
| 3. Current grants to local government | 2 102 | 2 220 | 3 284 | 2 857 | 3 333 | 4 217 |
| 4. Current grants to multi–jurisdictional sector(d) | 287 | 330 | 462 | 499 | 569 | 499 |
| 5. Adjusted taxation revenue =1+2–3–4(e) | 110 358 | 120 065 | 119 972 | 126 862 | 134 198 | 139 034 |
| As % of GDP | 10.2 | 10.2 | 9.6 | 9.8 | 9.6 | 9.4 |
| As % of total tax revenue | 34.5 | 34.4 | 35.4 | 38.1 | 37.4 | 35.6 |
LOCAL |
|
| 1. Taxation revenue collected(b) | 9 405 | 10 139 | 10 896 | 11 607 | 12 449 | 13 209 |
| As % of GDP | 0.9 | 0.9 | 0.9 | 0.9 | 0.9 | 0.9 |
| As % of total tax revenue | 2.9 | 2.9 | 3.2 | 3.5 | 3.5 | 3.4 |
| 2. Current grants from Commonwealth government | 56 | 89 | 46 | 12 | 14 | 35 |
| 3. Current grants from state government | 2 102 | 2 220 | 3 284 | 2 857 | 3 333 | 4 217 |
| 4. Adjusted taxation revenue = 1+2+3(e) | 11 563 | 12 447 | 14 227 | 14 476 | 15 797 | 17 460 |
| As % of GDP | 1.1 | 1.1 | 1.1 | 1.1 | 1.1 | 1.2 |
| As % of total tax revenue | 3.6 | 3.6 | 4.2 | 4.3 | 4.4 | 4.5 |
TOTAL |
|
| Gross Domestic Product | 1 083 303 | 1 175 321 | 1 254 293 | 1 292 315 | 1 403 888 | 1 474 686 |
| Total taxation revenue collected | 319 872 | 348 629 | 339 266 | 333 035 | 359 006 | 390 067 |
| As % of GDP | 29.5 | 29.7 | 27.0 | 25.8 | 25.6 | 26.5 |
|
| (a) As published in Australian National Accounts, December Quarter 2012 (Cat. no. 5206.0), Table 32 Expenditure on GDP, Current Prices: Annual. |
| (b) According to GFSM2001. |
| (c) Part of the Commonwealth Government grants paid to State Goverments are onpassed to Local Governments. |
| (d) The multi–jurisdictional sector contains units where jurisdiction is shared between two or more governments, or where classification of a unit to a jurisdiction is otherwise unclear. The main type of units currently falling into this category are the public universities. |
| (e) The sum of taxation revenue for all levels of government does not equal the sum of adjusted taxation revenue for all levels of government owing to grants paid to the multi–jurisdictional sector. |
ADJUSTED TOTAL REVENUE, AND ADJUSTED TOTAL REVENUE LESS TRANSFERS TO HOUSEHOLDS
Table 2 below shows adjusted total revenue, and adjusted total revenue less transfers to households for all three levels of government.
TABLE 2. ADJUSTED TOTAL REVENUE, less transfers to households, and as % of GDP(a) |
|
 | 2006–07 | 2007–08 | 2008–09 | 2009–10 | 2010–11 | 2011–12 |
 | $m | $m | $m | $m | $m | $m |
COMMONWEALTH |
|
| 1. Adjusted taxation revenue(b) | 192 583 | 209 038 | 198 539 | 183 055 | 200 881 | 225 173 |
| 2. Non–taxation revenue(c) | 15 990 | 17 619 | 20 281 | 24 843 | 20 858 | 21 562 |
| 3. Adjusted total revenue =1+2 | 208 573 | 226 657 | 218 819 | 207 897 | 221 739 | 246 736 |
| As % of GDP | 19.3 | 19.3 | 17.4 | 16.1 | 15.8 | 16.7 |
| 4. Direct benefits to households(d) | 81 138 | 86 078 | 111 548 | 98 490 | 105 559 | 112 907 |
| 5. Indirect benefits to households(e) | 25 090 | 27 606 | 30 767 | 33 548 | 36 315 | 39 400 |
| 6. Adjusted total revenue, less transfers to households =3–4–5 | 102 346 | 112 972 | 76 505 | 75 859 | 79 864 | 94 428 |
| As % of GDP | 9.4 | 9.6 | 6.1 | 5.9 | 5.7 | 6.4 |
STATE |
|
| 1. Adjusted taxation revenue(b) | 110 358 | 120 065 | 119 972 | 126 862 | 134 198 | 139 034 |
| 2. Non–taxation revenue, excluding current grants from Commonwealth government(c) | 40 922 | 38 550 | 50 156 | 64 333 | 62 196 | 66 359 |
| 3. Adjusted total revenue =1+2 | 151 280 | 158 615 | 170 128 | 191 195 | 196 394 | 205 393 |
| As % of GDP | 14.0 | 13.5 | 13.6 | 14.8 | 14.0 | 13.9 |
| 4. Direct benefits to households(d) | 1 046 | 1 350 | 1 687 | 1 948 | 1 854 | 1 339 |
| 5. Indirect benefits to households(e) | 2 441 | 2 516 | 2 751 | 3 111 | 3 566 | 3 882 |
| 6. Adjusted total revenue, less transfers to households = 3–4–5 | 147 794 | 154 749 | 165 691 | 186 136 | 190 974 | 200 172 |
| As % of GDP | 13.6 | 13.2 | 13.2 | 14.4 | 13.6 | 13.6 |
LOCAL |
|
| 1. Adjusted taxation revenue(b) | 11 563 | 12 447 | 14 227 | 14 476 | 15 797 | 17 460 |
| 2. Non–taxation revenue, excluding current grants from Commonwealth and state governments(c) | 14 579 | 15 368 | 17 049 | 17 828 | 18 224 | 19 414 |
| 3. Adjusted total revenue =1+2 | 26 142 | 27 815 | 31 275 | 32 304 | 34 021 | 36 874 |
| As % of GDP | 2.4 | 2.4 | 2.5 | 2.5 | 2.4 | 2.5 |
| 4. Direct and indirect benefits to households(f) | . . | . . | . . | . . | . . | . . |
| 5. Adjusted total revenue, less transfers to households = 3–4 | 26 142 | 27 815 | 31 275 | 32 304 | 34 021 | 36 874 |
| As % of GDP | 2.4 | 2.4 | 2.5 | 2.5 | 2.4 | 2.5 |
|
. . not applicable
(a) As published in Australian National Accounts, December Quarter 2012 (cat no 5206.0).
(b) Derived in Table 1.
(c) Non–taxation revenue includes revenue from sales of goods and services, interest income, other property income (such as dividends, income tax equivalents, land rents and royalties), fines, capital revenue, and all current revenue other than grants.
(d) Direct benefits to households are monetary transfers.
(e) Indirect benefits to households are transfers 'in–kind' via goods and services.
(f) Local government does not make transfers of this kind to households.
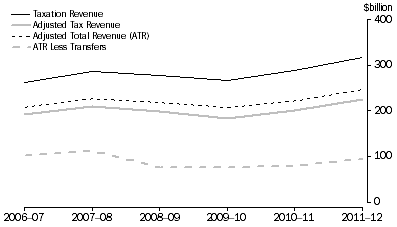
All four measures of Commonwealth government taxation revenues increased in 2011–12:
- Commonwealth taxation revenue was $317,888m, an increase of $28,764m (10%)
- Commonwealth adjusted taxation revenue was $225,173m, an increase of $24,292m (12%)
- Commonwealth adjusted total revenue was $246,736m, an increase of $24,997m (11%)
- Commonwealth adjusted total revenue less transfers to households was $94,428m, an increase of $14,564m (18%)
- Commonwealth adjusted total revenue less transfers to households as a proportion of GDP, increased from 5.7% to 6.4% from 2010–11 to 2011–12.
Graph 1 : Commonwealth Taxation Revenues

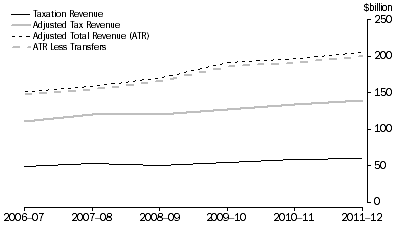
As shown below in Graph 2, state government taxation revenues increased for all four measures in 2011–12:
- State taxation revenue was $59,686m, an increase of $1,565m (3%)
- State adjusted taxation revenue was $139,034m, an increase of $4,836m (4%)
- State adjusted total revenue was $205,393m, an increase of $8,999m (5%)
- State adjusted total revenue less transfers to households was $200,172m, an increase of $9,198m (5%)
- State adjusted total revenue less transfers to households as a proportion of GDP, remained constant at 13.6% from 2010–11 to 2011–12.
Graph 2: State Taxation Revenues

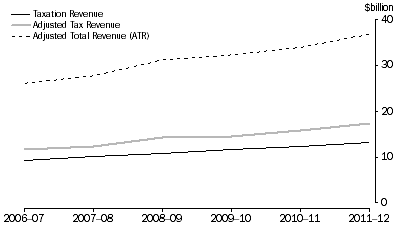
In Graph 3, local taxation revenue increased for all three measures in 2011–12:
- Local taxation revenue was $13,209m, an increase of $760m (6%)
- Local adjusted taxation revenue was $17,460m, an increase of $1,663m (11%)
- Local total revenue less transfers to households was $36,874m, an increase of $2,853m (8%)
- Local adjusted total revenue less transfers to households as a proportion of GDP, increased from 2.4% to 2.5% from 2010–11 to 2011–12.
Graph 3 : Local Taxation Revenues

|
|
 Print Page
 Print All
 Quality Declaration