TOTAL TAXATION REVENUE
SUMMARY
A feature of the Australian federal system is that the Commonwealth Government levies and collects all income tax, from individuals as well as from enterprises. It also collects a portion of other taxes, including taxes on the provision of goods and services. The revenue base of state governments consists of taxes on property, on employers' payroll, and on the provision and use of goods and services. The sole source of taxation revenue for local governments is taxes on property.
Taxes on income increased $26,310m (13%) while taxes on property increased $286m (1%) and taxes on provisions of goods and services increased $2,172m (2%). Taxes on income represented 59% of total taxation revenue for all levels of government and taxes on provision of goods and services, including the goods and services tax (GST) represented 24%.
TOTAL TAXATION REVENUE |
|
 | 2006–07 | 2007–08 | 2008–09 | 2009–10 | 2010–11 | 2011–12 |
 | $m | $m | $m | $m | $m | $m |
COMMONWEALTH GOVERNMENT |
|
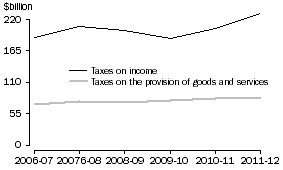
| Taxes on income | 189 066 | 208 233 | 200 997 | 186 660 | 204 546 | 230 871 |
| Employers' payroll taxes | 350 | 381 | 377 | 507 | 505 | 528 |
| Taxes on property | 15 | 15 | 16 | 12 | 13 | 13 |
| Taxes on provision of goods and services | 71 452 | 75 863 | 75 141 | 78 865 | 81 788 | 83 377 |
| Taxes on use of goods and performance of activities | 1 218 | 1 462 | 1 831 | 1 513 | 2 272 | 3 099 |
| Total taxation revenue | 262 101 | 285 954 | 278 363 | 267 556 | 289 124 | 317 888 |
STATE GOVERNMENTS |
|
| Taxes on income | – | – | – | – | – | – |
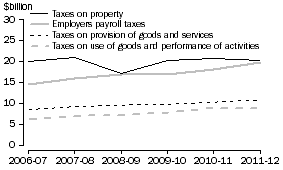
| Employers' payroll taxes | 14 366 | 16 026 | 16 926 | 16 796 | 18 186 | 19 778 |
| Taxes on property | 19 862 | 20 967 | 16 986 | 20 249 | 20 805 | 20 335 |
| Taxes on provision of goods and services | 8 517 | 9 162 | 9 602 | 9 721 | 10 251 | 10 834 |
| Taxes on use of goods and performance of activities | 6 129 | 6 980 | 7 117 | 7 771 | 8 879 | 8 740 |
| Total taxation revenue | 48 874 | 53 134 | 50 631 | 54 536 | 58 121 | 59 686 |
LOCAL GOVERNMENTS |
|
| Taxes on income | – | – | – | – | – | – |
| Employers' payroll taxes | – | – | – | – | – | – |
| Taxes on property | 9 405 | 10 139 | 10 896 | 11 607 | 12 449 | 13 209 |
| Taxes on provision of goods and services | – | – | – | – | – | – |
| Taxes on use of goods and performance of activities | – | – | – | – | – | – |
| Total taxation revenue | 9 405 | 10 139 | 10 896 | 11 607 | 12 449 | 13 209 |
ALL LEVELS OF GOVERNMENT |
|
| Taxes on income | 189 057 | 208 220 | 200 994 | 186 650 | 204 537 | 230 847 |
| Employers' payroll taxes | 14 260 | 15 912 | 16 784 | 16 749 | 18 112 | 19 704 |
| Taxes on property | 29 272 | 31 085 | 27 856 | 31 833 | 33 231 | 33 517 |
| Taxes on provision of goods and services | 79 969 | 85 025 | 84 743 | 88 586 | 92 039 | 94 211 |
| Taxes on use of goods and performance of activities | 7 312 | 8 387 | 8 889 | 9 217 | 11 087 | 11 788 |
| Total taxation revenue | 319 872 | 348 629 | 339 266 | 333 035 | 359 006 | 390 067 |
|
| – nil or rounded to zero (including null cells) |
COMMONWEALTH GOVERNMENT TAXATION REVENUE
Commonwealth Government taxation revenue (including taxes received from other levels of government and public corporations) increased $28,764m (10%) from $289,124m in 2010–11 to $317,888m in 2011–12. In 2011–12, Commonwealth taxation revenue represented 81% of taxation revenue for all levels of government. The following graph shows the level of taxation revenue for the two main sources of taxation revenue for the Commonwealth Government.
COMMONWEALTH GOVERNMENT TAXATION REVENUE

STATE GOVERNMENT TAXATION REVENUE
State government taxation revenue (including taxes from other levels of government and public corporations) increased $1,565m (3%) from $58,121m in 2010–11 to $59,686m in 2011–12. This was driven by a $1,592m (9%) increase in Employers payroll taxes and a $583m (6%) increase in taxes on provision of goods and services, and offset by a $470m (2%) decrease in property taxes. Taxes on property was the largest source of taxation revenue (34%) for state governments in 2011–12, followed by employers' payroll taxes (33%). The following graph shows the levels of the sources of taxation revenue for the state governments.
STATE GOVERNMENT TAXATION REVENUE

LOCAL GOVERNMENT TAXATION REVENUE
Local government taxation revenue increased $760m (6%) from $12,449m in 2010–11 to $13,209m in 2011–12. Taxes on property are the sole source of taxation revenue for local governments.
 Print Page
 Print All
 Quality Declaration