KEY FIGURES
SOIL ENHANCER USE, Australia, year ended 30 June 2016
|
 | 2015-16 | Movement since |
 |  | 2014-15 (a) |
 | ha | % |
|
| Compost | 220 145 | -12.0% |
| Green manure | 71 403 | 76.8% |
| Mulch | 23 966 | 108.4% |
| Lime (including lime sand and stone) | 2 224 349 | -0.1% |
| Dolomite | 139 320 | 20.5% |
| Gypsum | 1 014 920 | 4.7% |
| Biochar | 8 673 | 20.5% |
| Poultry manure | 281 272 | 14.3% |
| Other soil enhancers | 667 041 | 28.2% |
| All soil enhancers | 4 651 088 | 6.0% |
|
| (a) Percentage movement based on revised 2014-15 estimates using the new scope of $40,000 or greater |
KEY POINTS
- Of all agricultural businesses in Australia, 27% (or 22,800) applied soil enhancers on 4.7 million hectares of land in 2015-16. A 6.6% increase in the number of agricultural businesses applying soil enhancers and a 6.0% increase in the area on which soil enhancers were applied when compared to 2014-15.
- Western Australia continues to have the largest areas to which soil enhancers were applied with 1.8 million hectares. New South Wales (incl. ACT) reported the next largest area of soil enhancers applied with 1.2 million hectares.
- Lime (including lime sand and stone) continues to be the dominant soil enhancer used by both area of application and number of businesses applying it. The area on which lime was applied (2.2 million hectares) accounted for 48% of the total area on which all soil enhancers were applied in 2015-16 and was applied by 12,000 businesses, or 53% of all businesses applying soil enhancers.
- Agricultural businesses in Western Australia continue to be the largest users of lime, applying it to 1.3 million hectares of land in 2015-16.
- New South Wales (incl. ACT) has replaced Victoria in 2015-16 with the largest number of businesses applying soil enhancers when compared to 2014-15. New South Wales (incl. ACT) reported a 15% increase in the number of businesses applying soil enhancers, increasing to 6,600 businesses.
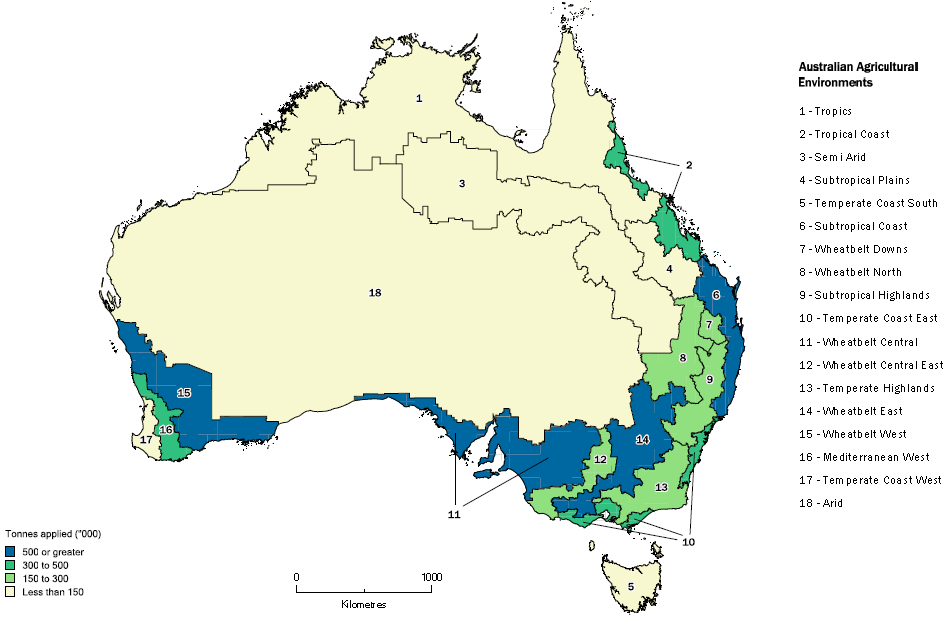
All soil enhancers applied, tonnes ('000), 2015-16
by Australian Agricultural Environment Regions

CHANGE IN COLLECTION SCOPE
- The scope for the 2015-16 Agricultural Census and Land Management Practices Survey was all agricultural businesses with an Estimated Value of Agricultural Operations (EVAO) of $40,000 or greater. This is a change from previous ABS rural environment and agricultural collections, where a scope of EVAO of $5,000 or greater was used. This change was foreshadowed in February 2016 in Agricultural Census: Nature and Content, 2015-16 (cat. no 7100.1).
- The 2014-15 estimates presented in this publication have been revised to use the new scope of $40,000 or greater.
- For more information about EVAO and the change in scope, refer to the Explanatory Notes within this release.
 Quality Declaration
  Print Page
 Print All