COMMENTARY ON IN-SCHOOL STAFF, 2015
From 2014 to 2015 the number of staff in Australia’s schools increased by 12,252 (2.7%), to a total of 466,867 persons. When measured in full-time equivalent terms (FTE), the in-school staff total for 2015 was 382,687 FTE, an increase of 9,387 FTE (2.5%) over the 2014 figure. In comparison, the national student count (in FTE terms) rose by 1.5% in the same period.
Looking at the categories of in-school staff (FTE) by their major function:
· Teaching staff increased by 1.9%
· Specialist support staff increased by 2.7%
· Administrative and clerical staff increased 4.3%, and
· Building operations, general maintenance and other staff by 2.0%.
As a proportion of all in-school staff:
· Teaching staff made up 70.3%
· Specialist support staff 2.6%
· Administrative and clerical staff 24.0%, and
· Building operations, general maintenance and other staff 3.1%.
Across the states and territories, proportional increases for in-school staff (FTE) in the government sector were highest in Queensland (4.3%), followed by Western Australia (2.8%). Similarly in the non-government sector, Queensland had the largest increase (5.0%), followed by Western Australia (4.1%). Both of these states completed the transition of Year 7 from a primary to secondary setting in 2015.
In the Northern Territory, the number of in-school staff (FTE) in the government sector continued to decline, recording a 13.8% fall since 2012. The Tasmanian government sector is the only other jurisdiction and sector to record a decline in in-school staff (FTE) over the last three years.
Nationally, between 2014 and 2015, female in-school staff (FTE) increased by 2.8%, while the corresponding increase for males was 1.6%. In 2015 almost three-quarters (73.7%) of all in-school staff (FTE) were female.
1 NUMBER OF IN-SCHOOL STAFF (FTE), by major function and sex, Australia, 2015

TEACHING STAFF
Between 2014 and 2015, teaching staff (FTE) in non-government schools rose by 2.7%, compared with 1.5% in the government sector. Over the same time frame, there was a corresponding increase in student (FTE) of 1.4% and 1.6% respectively.
As in previous years, there were considerably more female teaching staff than male. This was more so the case at the primary level, where females comprised 83.2% of teaching staff (FTE) in Catholic schools, 81.8% in government schools, and 77.6% in Independent schools. The highest proportion of male teaching staff was at the secondary level in Independent schools (43.5%).
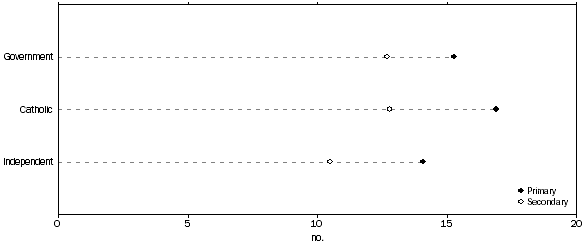
At the Australia level, the overall student (FTE) to teaching staff (FTE) ratio remained unchanged from the 2014 figure of 13.9. At the affiliation level, the ratio was 11.9 for Independent schools, 14.2 for government schools, and 14.7 for Catholic schools. Nationally, the ratio for secondary schools was 12.3 and for primary schools 15.4.
2 STUDENT (FTE) TO TEACHING STAFF (FTE) RATIO, by school level by affiliation, Australia, 2015

 Print Page
 Print All
 Quality Declaration