1367.0 - State and Territory Statistical Indicators, 2012  
ARCHIVED ISSUE Released at 11:30 AM (CANBERRA TIME) 06/03/2012  Final
   Page tools: Print Print Page Print all pages in this productPrint All


LIVESTOCK SLAUGHTERING


Graph Image for Cattle and calves slaughtered, NSW


Graph Image for Sheep and lambs slaughtered, NSW


In NSW in January 2012, in trend terms, there were:

  • 132,900 cattle slaughtered, little changed from the January 2011 figure
  • 16,600 calves slaughtered, a decrease of 8.4% on the January 2011 figure
  • 103,500 sheep slaughtered, the seventh consecutive monthly increase but still 60.7% below the recent high recorded in May 2009
  • 353,300 lambs slaughtered, which was 0.6% below the January 2011 figure.


Useful Links

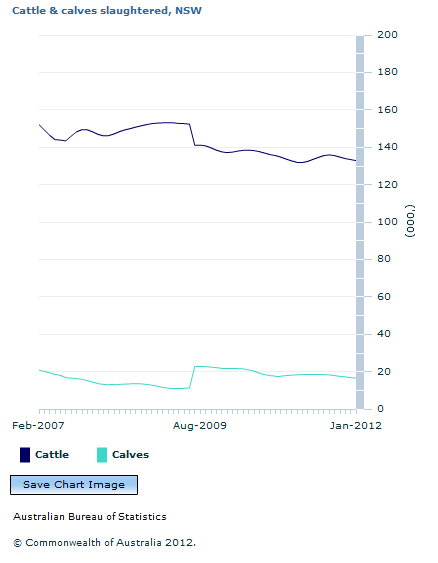
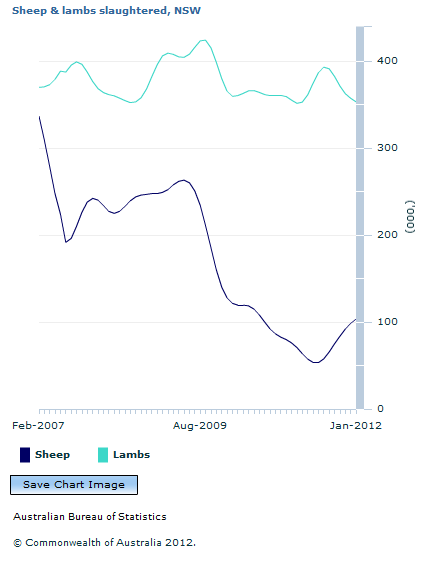
Do you know how many livestock have been slaughtered in your state or territory?

Livestock slaughtering statistics are based on a monthly collection from abattoirs and other major slaughtering establishments. They include estimates of animals slaughtered by country butchers and other small slaughtering establishments.