Households
The slight increase in household electricity consumption can be partially attributed to the colder autumn temperatures Melbourne experienced in 2020. To understand whether COVID-19 also contributed to the observed higher electricity consumption, we analysed daily household electricity consumption patterns.
Electricity consumption volumes on any given day vary greatly based on a variety of factors such dwelling size, lifestyle patterns and weather. We used cluster analysis to group similar electricity consumption patterns, looking at the time of day that electricity is being consumed rather than the daily total. Our cluster analysis of standardised dwelling electricity consumption data for March 2019 revealed that on any given weekday there are generally three types of electricity consumption patterns:
- consistent use throughout the day which can be associated with days where residents spend most of their time at home during the day;
- electricity usage peaks in the morning and late afternoon which can be associated with days where residents are out during the day, and return early;
- electricity peaks in the morning and in the evening which can be associated with days where residents are out during the day, and return late.
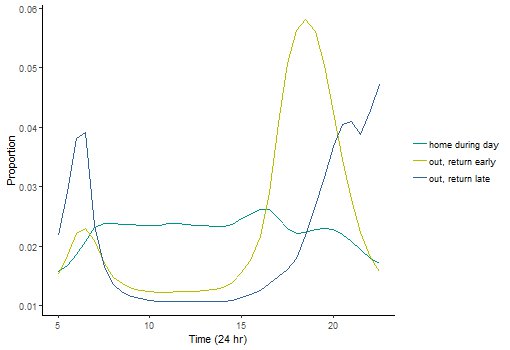 Figure 2
: Weekday household electricity consumption patterns (5 a.m. to 11 p.m.) in March 2019. These load profiles were obtained using a machine learning algorithm, ‘k-means clustering’.
In any given week, a household may have some days where residents stayed at home, and some days where residents were not at home. The concept of ‘dwelling days’ is useful, as it represents the total number of dwellings in an area multiplied by the number of days in the applicable period. We can then use a clustering algorithm to classify each dwelling day to a consumption pattern, and examine behaviour trends in aggregate. We found it more informative to only look at weekdays, not weekends, and the period 5 a.m. to 11 p.m.

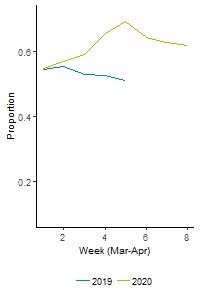
Proportion of dwelling days with 'home during the day' pattern |
|
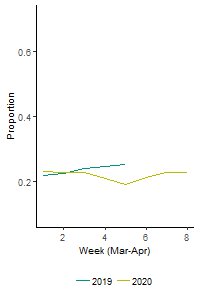
Proportion of dwelling days with 'out, return early' pattern |
|
Proportion of dwelling days with 'out, return late' pattern |
 |
|
 |
|
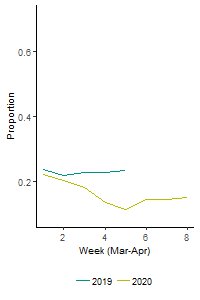 |
Figure 3: Percentage of dwelling days across the three electricity use patterns in inner city Melbourne area for 2019 vs 2020.
In Figure 3, the proportion of days in the ‘home during the day’ pattern did not change much across 5 distinct weeks in March–April 2019 i.e. household electricity consumption tended to be quite stable over time.
In comparison, the proportion of days in the ‘home during the day’ pattern steadily increased across 8 distinct weeks in March–April 2020, rising up to 15 percentage points higher than the same time in the previous year. The timing coincides with government restrictions taking effect requiring residents to spend more time at home due to the spread of COVID-19, such as working from home and home schooling.
The proportion of days in the ‘home during the day’ pattern starts to decline from early April but does not return to the same pattern from early March. This coincides with the decline in the number of new COVID-19 cases in the Melbourne area at that time.
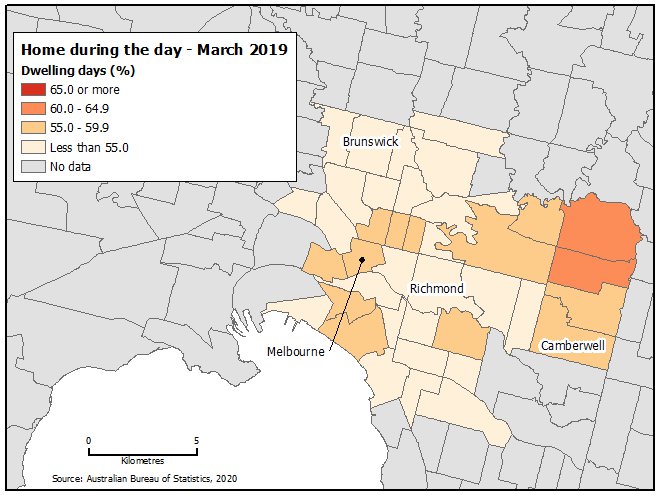
Map 1: Percentage of dwelling days in the ‘home during the day’ electricity consumption pattern for March 2019 for inner Melbourne, by SA2. Darker shading indicates a greater proportion of dwelling days in the ‘home during the day’ pattern.
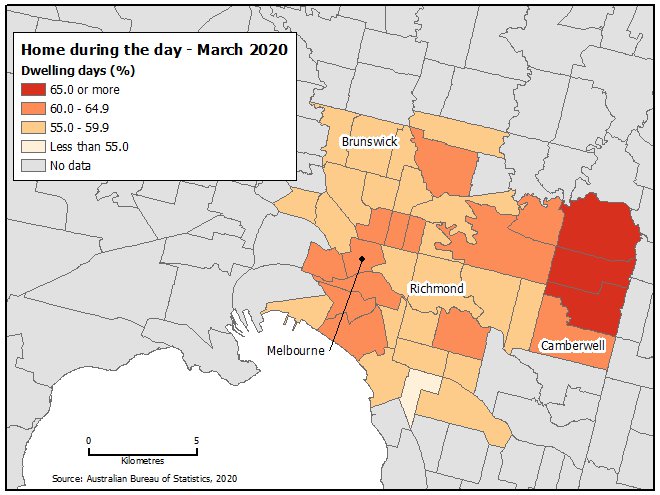
Map 2: Percentage of dwelling days in the ‘home during the day’ electricity consumption pattern for March 2020 for inner Melbourne, by SA2.
Analysing geospatial trends, we found that some SA2s had a noticeably higher proportion of dwelling days in the ‘home during the day’ pattern in 2020 relative to 2019.
| Proportion of dwelling days with 'home during the day' pattern | | Proportion of dwelling days with 'out, return early' pattern | | Proportion of dwelling days with 'out, return late' pattern |
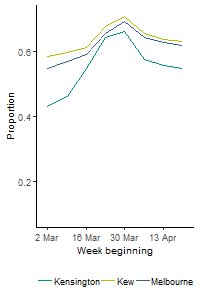 | | 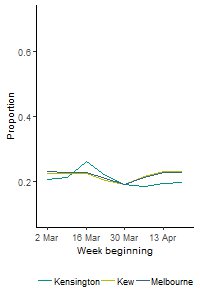 | | 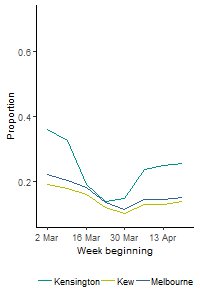 |
Figure 4: Percentage of dwelling days across the three electricity consumption patterns for March to April 2020 for whole of inner Melbourne, Kensington and Kew.
The magnitude of lifestyle shift toward spending more time at home varies across different areas of inner Melbourne. To demonstrate this, two SA2s with different and contrasting initial electricity consumption patterns were selected for comparison to all of inner Melbourne over March and April 2020: Kensington and Kew. The analysis shows that over March/April 2020 there has been a significant increase in the proportion of days that inner Melbourne residents are using electricity consistently throughout the day. Whilst Kew has a larger overall proportion of days spent in the ‘home during the day’ pattern, Kensington residents appear to have experienced a larger lifestyle shift toward spending more time at home on weekdays over the period. For Kensington, we observe up to a 25% increase in the proportion of weekdays spent in the ‘home during the day’ pattern, and a corresponding decrease in the proportion of weekdays spent in ‘out during the day and return late’.
Given the timing and comparison to 2019 results, it is likely changes in lifestyle patterns are attributable to COVID-19. Analysis also suggests that COVID-19 is likely to be a strong contributing factor to the increase in household electricity consumption and fall in the business electricity consumption in the Melbourne CBD.
 Print Page
 Print All