CHAPTER 5 HOW TO USE SEIFA
INTRODUCTION
This chapter brings together some of the major issues surrounding the use of SEIFA that were discussed in previous chapters. This chapter is intended to briefly provide more detail about the use of SEIFA, but is not intended to replace a proper technical understanding of analysis.
- HOW TO USE SEIFA
- EXAMPLES OF USE OF SEIFA
HOW TO USE SEIFA
It is important to have a good understanding of SEIFA before using it in an analysis.
SEIFA as a general tool
The concept of relative socio-economic disadvantage is neither simple nor well-defined. No single measure is able to completely capture this concept. As discussed previously, SEIFA uses the commonality between a wide range of information to represent relative socio-economic disadvantage. Therefore, the concept and the selection of information used to make the indexes are broad. This means that SEIFA is a general measure, which will therefore impact how SEIFA should be used in analysis.
First, because SEIFA is only a broad measure of relative socio-economic disadvantage, a given analysis is likely to require additional information that is specific to the topic. For example, a study analysing the relationship between smoking and disadvantage may consider also including other information, such as the availability of doctors in the area, or the number of smokers in the household. Neither of these measures are included in SEIFA, but may be important to the particular analysis.
Second, two areas may have a similar score, but for very different reasons. For example, a low score in one area may be due to a high proportion of low income households, while a low score in a different area may instead be due to a high proportion of low-rent households.(footnote 1) Although both areas have a similar SEIFA score, only one of these variables may be important to the topic you are analysing. For example, you may wish to distinguish between two areas based on low income, but not necessarily on low-rent. It is therefore important to note that SEIFA is a general tool that is not specifically designed for any particular analysis.
Impact of PCA on SEIFA
The method used to construct the SEIFA indexes is called Principal Components Analysis. As discussed in Chapter 3, this method will impact on how SEIFA should be used in your analysis.
First, the index scores can be used to rank areas in terms of disadvantage, however other arithmetic relationships may not be meaningful. For example, an area with a score of 500 is not half as advantaged as an area with a score of 1000. Similarly, it is incorrect to use the size of the gap between the scores to compare levels of disadvantage. For example, the difference in disadvantage between two areas with scores of 500 and 600, is not the same as the difference between two areas with scores of 800 and 900.(footnote 2)
Second, PCA creates indexes by combining information (variables) related to relative disadvantage. PCA uses the relationships between the variables themselves to determine the importance (weight) of each variable to the index. This means that every variable has a different level of importance in the SEIFA indexes, and this may be different to how important the variable is to your particular analysis.
Third, it is important to be aware of the variables used to construct the SEIFA indexes. Because the SEIFA indexes are summary measures of a wide range of variables, SEIFA itself will, by definition, be related to each of the variables separately. This means that your analysis is likely to find a relationship between SEIFA and any one of these variables. It will be difficult to tell how much of this relationship is due simply to the inclusion of the variable in the construction of SEIFA. Although, SEIFA does only capture a part of the information contained in the variables. Nevertheless, the use of any of these variables alongside SEIFA in your analysis must be done with caution. The Appendix and the Technical Paper include a list of the variables used in each of the indexes.
Comparing SEIFA over time
As discussed in Chapter 2, comparing SEIFA scores over time is not recommended for a number of reasons.
- SEIFA is only a relative measure, not an absolute measure of socio-economic disadvantage. For example, all of the areas could have become less disadvantaged since the last release, however this would not be evident in SEIFA. An area may have a lower score than it did previously, however this could be due to changes in the other areas, rather than any change to that area.
- SEIFA is a snapshot of an area, with a five year gap between each release (every Census). Because the world changes between releases, the relationships between the variables will change. As these relationships are used to create SEIFA, the indexes will therefore change with each release.
- While consistency across SEIFA releases is very important, changes are made where necessary or important. In effect, this means that different releases of SEIFA capture a slightly different aspect of relative socio-economic disadvantage. For example, previous SEIFA indexes did not measure broadband internet access because this technology was not widely available. This information is now collected in the Census and is included in the Index of Relative Advantage and Disadvantage.
- Boundaries of geographic areas change between Censuses. There are good reasons for these changes and some changes can be significant.
For these reasons, we do not recommend comparing SEIFA over time. If you must do so, compare the extreme scores (such as the top and bottom deciles) rather than the mid-range scores. This is because, as shown by the index distributions in
Chapter 4, the mid-range scores are similar, so any comparison over time for areas with these scores should be done with caution. Be aware how the above issues affect your analysis.
SEIFA is an area level measure
As discussed in Chapter 2, an area can have a diverse range of people. SEIFA scores represent an
average for all people in an area. This affects the interpretation of SEIFA in your analysis. For example, it would be appropriate for an analysis of the relationship between SEIFA and people's health to refer to the association between a person's health status and the general level of relative socio-economic disadvantage of the people in their area. It would not be correct to discuss the relative disadvantage of the person, only of the general level of relative disadvantage of people and households in the area.
EXAMPLES OF USE OF SEIFA
Examples
For most analysis, we recommend the use of the SEIFA deciles because the SEIFA scores require a certain amount of technical knowledge for proper use. The actual SEIFA scores should only be used for more technical analysis. As shown below, SEIFA can be used in many ways, however each method has limitations.
Distributions for State, SD and SSD geographic areas
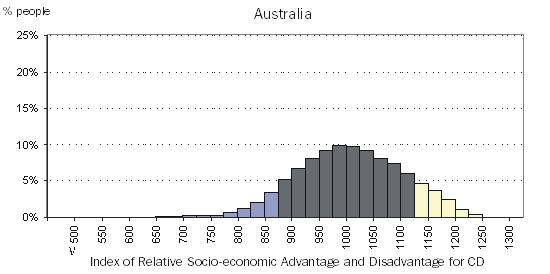
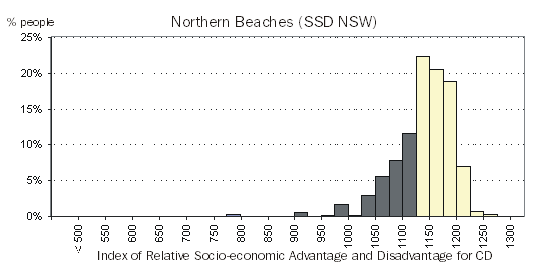
In 2006, SEIFA indexes have not been created for State, Statistical Division (SD) and Statistical Subdivision (SSD) geographic areas. However, for 2006 SEIFA, a spreadsheet tool is available that shows the distribution of SEIFA scores within these areas. This spreadsheet shows the distribution of people who are usual residents on Census Night, rather than the distribution of CDs.(footnote 3) For each index, a particular geographic area can be selected, and the tool will show the population distribution by CD-level scores for this area. This distribution can be compared to the distribution for Australia. The table output shows the number and proportion of usual residents within the CDs. The graph output shows the proportion of people in the area, by the score of the CD in which they usually resided on Census Night. The colours used on the graph output roughly approximate the top and bottom CD deciles.
This spreadsheet tool is available on the ABS website with the SEIFA indexes under cat. no. 2033.0.55.001 Census of Population and Housing: Socio-Economic Indexes for Areas (SEIFA), Australia - Data only, 2006.
Figures 5.1 and 5.2 show the distribution of people by the score of the CD in which they usually resided on Census Night, for the Index of Relative Advantage and Disadvantage, within Australia and within Sydney Northern Beaches SSD respectively. Note that figure 5.2 shows the distribution of people living in a CD with a certain score, as a proportion of all the people usually residing in the Sydney Northern Beaches SSD on Census Night.(footnote 4) This means that we can directly compare this population distribution with that of Australia. Figure 5.2 shows that most of the usual residents of Sydney Northern Beaches SSD resided in CDs with high IRSAD scores, compared to the Australian distribution.
Figure 5.1 Population Distribution, by IRSAD CD scores, Australia
 Figure 5.2 Population Distribution, by IRSAD CD scores, Sydney Northern Beaches

Descriptive analysis
This section provides a descriptive analysis of the association between SEIFA Index of Relative Socio-economic Disadvantage and health. A person's lifestyle choices, including diet, exercise and smoking habits can be related to the area where they live. For example, diet may be affected by the cost and availability of fruit and vegetables in local shops, or the location of fast-food outlets. Exercise may be affected by the availability of sports and recreation facilities in the area, or by safety concerns. There has been substantial research into the effects of neighbourhood disadvantage on the health of individual people. As measures of neighbourhood socio-economic status, the SEIFA indexes can be used to look at the relationship between neighbourhood disadvantage and health.
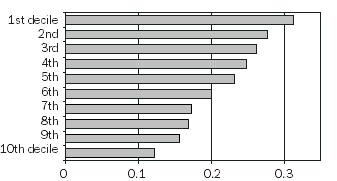
Figure 5.3 shows the proportion of adults who are daily smokers (using National Health Survey 2004-5, unpublished data), by SEIFA IRSD deciles. This figure indicates a relationship between smoking and SEIFA.
Figure 5.3 Proportion of adults who smoke daily, by IRSD deciles

There are a number of ways this figure can be interpreted, including:
- Compared to other areas, the proportion of adults who smoke daily is greater in areas with relatively more socio-economic disadvantage.
- On average, adults are more likely to report they smoke daily if they live in an area that generally has greater relative socio-economic disadvantage.
- The proportion of adults in the lowest decile (greatest disadvantage) who smoke daily is almost three times the proportion of adults in the highest decile (least disadvantaged) who smoke daily. Around 32% of adults who lived in areas with the lowest IRSD decile smoked daily, compared with around 12% of adults who lived in areas with the highest IRSD decile.
Figure 5.4 shows self-assessed general health (using National Health Survey 2004-5, unpublished data), by IRSD deciles.
Figure 5.4 Proportion of adults with self-assessed health, by IRSD deciles |
|  |
 | Self-assessed Health |  |
 | Fair or Poor | Good to Excellent |  |
| IRSD deciles | % | % |  |
|  |
| Deciles 1 and 2 | 23 | 77 |  |
| Deciles 3 and 4 | 20 | 80 |  |
| Deciles 5 and 6 | 15 | 85 |  |
| Deciles 7 and 8 | 13 | 87 |  |
| Deciles 9 and 10 | 11 | 89 |  |
| Total | 16 | 84 |  |
|  |
This figure indicates a relationship between self-assessed health and SEIFA, which can be interpreted as:
- Compared to other areas, there are higher rates of self-assessed 'fair to poor' health (or lower rates of self-assessed 'good to excellent' health) in areas with generally more socio-economic disadvantage.
- On average, adults are more likely to report 'fair to poor' health (self-assessed) if they live in an area that generally has greater relative socio-economic disadvantage.
- The proportion of adults in the lowest deciles with 'fair to poor' health is twice the proportion of adults in the highest deciles. Around 11% of adults living in areas that generally lack relative socio-economic disadvantage self-assessed their health to be 'fair or poor', compared with 23% of adults living in areas with a generally high level of relative socio-economic disadvantage.
Regression analysis and SEIFA: For more technical use
This section is not intended to describe regression analysis, but to highlight some issues when using SEIFA in regression analysis. There are alternative ways that SEIFA deciles can be used in regression analysis. For example, dummy variables can be created for each SEIFA decile, or just for the extreme deciles.
If using SEIFA in linear regression analysis, particular care must be taken, as such analysis is based on a certain set of statistical assumptions. These assumptions include the linearity assumption, for example, which assumes constant relationships between the analysed variables.
(footnote 5) As an example, if SEIFA were used to analyse people's health, then the results of a regression analysis would be based on the assumption that a unit increase in SEIFA is related to a fixed amount of change in people's health. That is, the relationship between a change in health and a change in SEIFA remains the same, whatever the SEIFA score. However, the difference in disadvantage between SEIFA scores of 500 and 600 is not equal to the difference between scores of 900 and 1000. Therefore, this assumption will not hold and care should be used when applying SEIFA to regression analysis. Users should be aware of the distribution of index scores before using SEIFA in regression analysis.
Hints when using SEIFA to analyse survey data
As discussed in Chapter 2, there are a few issues to consider when using SEIFA to analyse survey data.
- SEIFA refers to the general population of an area. Therefore, the individual households or people in the survey data must be able to be linked to an area. If each person-level record on the survey file has a Collection District number (CD), then the person's information (e.g. health) can be matched to the SEIFA score (or rank, or decile) using this CD number.
- It is important to select the SEIFA index that matches the geographic areas used in the survey. For example, if the survey refers to Australia Post postcodes, then use the SEIFA indexes for Postal Areas.(footnote 6)
- Because these geography standards change over time, it is important to use the SEIFA release that most closely corresponds to that used in the survey. Different releases of geography standards are able to be matched using the concordances available on the ABS website (refer to Further Information below). For example, if the survey was conducted in 2003, then it may have used a previous geography standard. This means that it may be best to use the 2001 release of SEIFA, so that the survey data and SEIFA will be referring to the same areas. Note that it is possible to use the 2006 release of SEIFA, as long as you analyse only those CDs that have not changed since the geographic standard used by the survey. However, it should be noted that using only part of the survey will impact the survey weights.(footnote 7)
- Surveys sample only a proportion of the population and may miss the people or households that are important to your particular analysis. For example, surveys are often able to sample relatively few people and households from very remote areas. In addition, not everyone will respond to survey questionnaires. This means that some information on the survey could be biased if certain groups of people tended not to respond. Similarly, while the Census aims to capture information about the entire population of Australia, not every person responds to every Census question. Some information from the Census could be biased if certain groups of people are less likely to be measured. For example, household income is not able to be calculated for households with an adult who was elsewhere on Census Night. This group of households may be important to your particular analysis.
FURTHER INFORMATION
References
Refer to the following papers for other examples of using SEIFA.
1 This example is overly simplistic. In reality scores are determined by a combination of information.
<back
2 This issue also impacts on the assumptions of regression analysis. If you are conducting regression analysis, ensure you are aware of the distribution of the scores (Chapter 4).
<back
3 The distribution of people is different to the distribution of CDs because there is a different number of people living in each CD.
<back
4 Excluded CDs were not given a score. However, people in excluded CDs were counted in the denominator
when calculating the proportions.
<back
5 This assumption also applies to transformed variables.
<back
6 Refer to the geography discussion in Chapter 4.
<back
7 For every survey, weights are created so that each person in the survey represents multiple people in the actual population. If only part of the sample is used in an analysis, these weights may no longer accurately represent the population.
<back
 Print Page
 Print All