|
|
Salinity is one of the major land degradation issues presently being faced in Australia.
Land and water are essential for agricultural production. Since European settlement of Australia around 100 million hectares (ha) of forest and woodland have been cleared, mostly for agricultural production (NFI 1998). Today, around 456 million ha, or 59% of land in Australia, are used for agriculture, making it the dominant form of land use. However, agricultural production has led to the degradation of soil and water quality in many regions. This degradation has taken many forms, including increasing levels of soil salinity, sodicity and acidity.
In recent years salinity has gained prominence as a national environmental issue (MDBC 1999; Commonwealth of Australia 2000; NLWRA 2001). While salinity, or the build-up of salts in the soil is a naturally occurring condition of the Australian landscape, it has been exacerbated by agricultural activities. There are two main forms of salinity, dryland and irrigated salinity. Dryland salinity is far more widespread. Salinity is caused by rising water tables brought about by the removal of vegetation and the excessive application of irrigation water.
The annual cost of salinity to agricultural industries through lost production in 2000 was estimated to be approximately $187m. While this cost is low compared to other land degradation issues, the impact of salinity is expected to increase in extent and severity in the coming years (NLWRA 2002a).
The impacts of salinity also extend beyond the agriculture sector. Roads, houses and water supply infrastructure are all degraded by it. In four states (New South Wales, Victoria, South Australia and Western Australia) the roads, buildings and/or water supply infrastructure of almost 70 towns are at risk of damage from salinity. Salinisation of freshwater rivers used for drinking water is increasingly an issue. It has been predicted that without effective salinity management, by 2020 the quality of Adelaide's drinking water will exceed heath standards for salt around 40% of the time (MDBC 1999). Biodiversity is also at risk through the loss and degradation of native vegetation. Across Australia around 630,000 ha of native vegetation and 80 wetlands, including wetlands of international importance, are at risk (NLWRA 2001).
2002 Land Management and Salinity Survey
In May 2002, the Australian Bureau of Statistics (ABS) conducted the Land Management and Salinity Survey as a supplement to the 2001 Agricultural Census. This survey was the largest of its type conducted in Australia. It collected information from farmers on the extent of land showing signs of salinity, the strategies used by farmers to manage and prevent salinity and some of the reasons and barriers to land management change.
The survey found almost 20,000 farms and 2 million ha of agricultural land were showing signs of salinity, with approximately 820,000 ha of land unable to be used for production (table 24.16). Western Australia had the highest number of farms (6,900 farms) and the greatest area of land (1.2 million ha) showing signs of salinity.
24.16 FARMS WITH LAND SHOWING SIGNS OF SALINITY - May 2002
|
 | Farms with
land showing
signs of
salinity | Proportion
of total
farms(a) | Land
showing
signs of
salinity | Proportion
of total
farm
area(b) | Salinised land unable to be
used for production | Proportion
of land showing
signs of salinity(c) | Proportion
of total
farm
area(d) |
| no. | % | ha | % | ha | % | % |
|
| New South Wales/ Australian Capital Territory | 3,108 | 7.4 | 124,110 | 0.2 | 44,204 | 35.6 | 0.1 |
| Victoria | 4,834 | 13.7 | 138,540 | 1.1 | 60,222 | 43.5 | 0.5 |
| Queensland | 993 | 3.4 | 106,644 | 0.1 | 39,927 | 37.4 | - |
| South Australia | 3,328 | 21.6 | *350,140 | 0.6 | 105,351 | 30.1 | 0.2 |
| Western Australia | 6,918 | 51.3 | 1,240,643 | 1.1 | 567,376 | 45.7 | 0.5 |
| Tasmania | 390 | 9.1 | 6,213 | 0.3 | 1,688 | 27.2 | 0.1 |
| Northern Territory | 8 | 2.0 | 2,316 | - | 2,253 | 97.3 | - |
| Australia | 19,579 | 13.9 | 1,968,606 | 0.4 | 821,022 | 41.7 | 0.2 |
|
(a) Farms with land showing signs of salinity as a proportion of total farms in the state/territory/Australia. Source for the denominator is data from the ABS 2001 Agricultural Census.
(b) Land showing signs of salinity as a proportion of total farm land in the state/territory/Australia. Source for the denominator is data from the ABS 2001 Agricultural Census.
(c) Salinised land unable to be used for production as a proportion of land showing signs of salinity.
(d) Salinised land unable to be used for production as a proportion of total farm land in the state/territory/Australia. Source for the denominator is data from the ABS 2001 Agricultural Census. |
| | | | | | | |
| Source: Salinity on Australian Farms, 2002 (4615.0). |
Farms primarily involved with the production of beef cattle, sheep and grains accounted for 16,000 farms (or 82%) showing signs of salinity, and 1.9 million ha or 97% of the agricultural land showing signs of salinity (table 24.17). Non-irrigated farms accounted for 1.8 million ha or 93% of the agricultural land showing signs of salinity.
24.17 LAND SHOWING SIGNS OF SALINITY, By industry - May 2002
|
| | Farms with
land showing signs of
salinity | Proportion
of total
farms in industry(a) | Land
showing
signs of
salinity | Proportion
of total farm
area in
industry(b) | Salinised land
unable to be
used for
production | Proportion of
land showing signs of
salinity(c) | Proportion of total farm
area in
industry(d) |
| | no. | % | ha | % | ha | % | % |
|
| Irrigated farms | | | | | | | |
| Nurseries and flowers | *35 | 1.6 | *543 | 0.5 | *118 | 21.8 | 0.1 |
| Vegetables | *349 | 8.3 | 2,685 | 0.3 | 1,165 | 43.4 | 0.1 |
| Grapevines | *504 | 8.3 | 2,766 | 0.6 | *1,133 | 41.0 | 0.2 |
| Fruit | 217 | 3.6 | 1,697 | 0.2 | 662 | 39.0 | 0.1 |
| Grain | 411 | 17.9 | 18,393 | 0.6 | *10,585 | 57.6 | 0.3 |
| Mixed grain and beef/sheep | 364 | 23.8 | 24,897 | 0.8 | 8,001 | 32.1 | 0.3 |
| Beef and/or sheep | 698 | 11.7 | 58,360 | 0.6 | 13,697 | 23.5 | 0.2 |
| Dairy | 1,005 | 15.8 | 19,895 | 1.3 | 7,361 | 37.0 | 0.5 |
| Other livestock | *47 | 7.2 | *1,150 | 0.4 | *852 | 74.1 | 0.3 |
| Cotton | 81 | 10.4 | n.a. | 0.1 | n.a. | n.a. | 0.2 |
| Other crops | 287 | 9.0 | 4,314 | 0.6 | 1,560 | 36.2 | 0.2 |
| Other industries | 51 | 7.7 | *1,318 | 0.7 | *451 | 34.2 | 0.2 |
| Total irrigated farms | 4,049 | 10.2 | 137,539 | 0.6 | 50,369 | 36.6 | 0.2 |
| Non-irrigated farms | | | | | | | |
| Nurseries and flowers | *57 | 4.3 | 487 | 0.4 | **240 | 49.2 | 0.2 |
| Vegetables | *13 | 1.5 | *89 | 0.1 | *32 | 35.9 | 0.0 |
| Grapevines | **84 | 11.0 | **2,851 | 5.1 | **2,780 | 97.5 | 4.9 |
| Fruit | **18 | 0.7 | *263 | 0.2 | **260 | 98.9 | 0.2 |
| Grain | 4,692 | 33.5 | 627,616 | 2.5 | 398,657 | 63.5 | 1.6 |
| Mixed grain and beef/sheep | 4,578 | 31.8 | 375,145 | 1.6 | 179,981 | 48.0 | 0.7 |
| Beef and/or sheep | 5,396 | 10.5 | 809,124 | 0.2 | 180,964 | 22.4 | 0.1 |
| Dairy | 300 | 4.6 | 4,927 | 0.2 | 1,488 | 30.2 | 0.1 |
| Other livestock | 125 | 4.1 | 4,654 | 0.1 | *3,275 | 70.4 | 0.1 |
| Cotton | **33 | 15.4 | *960 | 0.4 | *24 | 2.5 | 0.0 |
| Other crops | 173 | 4.9 | 1,827 | 0.2 | *842 | 46.1 | 0.1 |
| Other industries | 63 | 1.7 | 3,124 | 0.2 | *2,111 | 67.6 | 0.1 |
| Total non-irrigated farms | 15,530 | 15.4 | 1,831,067 | 0.4 | 770,653 | 42.1 | 0.2 |
| Total agriculture | 19,579 | 13.9 | 1,968,606 | 0.4 | 821,022 | 41.7 | 0.2 |
|
(a) Farms with land showing signs of salinity as a proportion of total farms in the industry. Source for the denominator is data from the ABS 2001 Agricultural Census. The denominator is either total irrigated farms or total non-irrigated farms, as per irrigated/non-irrigated farm split in table.
(b) Land showing signs of salinity as a proportion of total farm land in the industry. Source for the denominator is data from the ABS 2001 Agricultural Census. The denominator is either total irrigated farms or total non-irrigated farms, as per irrigated/non-irrigated farm split in table.
(c) Salinised land unable to be used for production as a proportion of land showing signs of salinity.
(d) Salinised land unable to be used for production as a proportion of total farm land in the industry. Source for the denominator is data from the ABS 2001 Agricultural Census. The denominator is either total irrigated farms or total non-irrigated farms, as per irrigated/non-irrigated farm split in table. |
| | | | | | | | |
| Source: Salinity on Australian Farms, 2002 (4615.0). |
Salinity management practices have been implemented on nearly 30,000 farms, including on just over 7,000 irrigated farms that changed irrigation practices for salinity management purposes. Various activities are being used by farmers to manage or prevent salinity with the type of management adopted dependent on the nature of the farm. For example, cattle farmers adopt practices different from those used by orchardists. The main salinity management strategies used by farmers to manage or prevent salinity were: planting crops, pastures and fodder plants (e.g. lucerne, deep rooted perennials and saltbush); fencing off saline areas; planting trees; and building earthworks such as drains (table 24.18).
24.18 SALINITY MANAGEMENT STRATEGIES(a) - May 2002
|
| Crops, pastures and
fodder plants | Trees | Land fenced
from grazing | Earthworks |
| ha | ha | ha | km |
|
New South Wales/
Australian Capital Territory | 1,095,711 | 91,424 | 17,227 | 42,557 |
| Victoria | *679,820 | 39,696 | 40,147 | 37,469 |
| Queensland | 331,204 | 125,862 | *26,612 | 14,635 |
| South Australia | 452,028 | 14,443 | 28,788 | *12,633 |
| Western Australia | 633,398 | 499,670 | 352,018 | 97,900 |
| Tasmania | *7,264 | 4,562 | 1,370 | *2,700 |
| Northern Territory | *5,973 | 303 | 10 | *65 |
| Australia | 3,205,398 | 775,960 | 466,174 | 207,959 |
|
| (a) Any land management practice undertaken wholly or partly for the management or prevention of salinity. |
| | | | |
| Source: Salinity on Australian Farms, 2002 (4615.0). |
The main motivations for implementing salinity management practices were for farm sustainability (66% of farmers implementing change indicated this was of high importance), environmental protection (56%), and to increase or maintain agricultural production (54%) (table 24.19).
24.19 REASONS FOR CHANGING LAND MANAGEMENT PRACTICES(a) - May 2002
|
| Not a reason | Low importance | Medium importance | High importance | Total |
| Reason | % | % | % | % | % |
|
| Increased productivity | 18.6 | 6.7 | 20.5 | 54.2 | 100.0 |
| Increased land value | 28.8 | 15.4 | 27.7 | 28.1 | 100.0 |
| Improved risk management | 33.2 | 12.1 | 25.8 | 28.9 | 100.0 |
| Farm sustainability | 13.5 | *3.9 | 16.3 | 66.3 | 100.0 |
| Improved environment protection | 12.6 | 5.1 | 26.8 | 55.6 | 100.0 |
| Other | - | *0.7 | **22.5 | 76.9 | 100.0 |
|
| (a) Farms managing for salinity and/or with land showing signs of salinity that have changed land management practices because of salinity or to prevent salinity. |
| | | | | |
| Source: Salinity of Australian Farms, 2002 (4615.0). |
The main barriers to changing land management practices were lack of financial resources and lack of time (35% and 21% of farmers, respectively, reporting these as very limiting). Lack of information or doubts about likely success were not considered by the majority of farmers to be barriers to change (only 6% and 7% of farmers respectively reported these as very limiting) (table 24.20).
24.20 BARRIERS TO CHANGING LAND MANAGEMENT PRACTICES(a) - May 2002
|
| Not a factor | Not very limiting | Limiting | Very limiting | Total |
| Barrier | % | % | % | % | % |
|
| Lack of financial resources | 23.8 | 7.9 | 32.8 | 35.5 | 100.0 |
| Lack of time | 29.7 | 13.4 | 36.1 | 20.8 | 100.0 |
| Insufficient or inadequate information | 52.1 | 24.8 | 17.4 | 5.8 | 100.0 |
| Doubts about likely success | 51.8 | 23.1 | 18.3 | 6.8 | 100.0 |
| Age or poor health | 70.6 | 12.5 | 10.3 | 6.6 | 100.0 |
| Other | - | 7.8 | 20.1 | 72.1 | 100.0 |
|
| (a) Farms managing for salinity and/or with land showing signs of salinity. |
| | | | | |
| Source: Salinity on Australian Farms, 2002 (4615.0). |
The Australian, and state and territory governments have adopted the National Action Plan for Salinity and Water Quality (NAP). The NAP has identified 21 high priority regions throughout Australia (map 24.21). Farms within the NAP regions account for 17,000 farms or 87% of total farms showing signs of salinity and 1.3 million ha or 66% of the total area showing signs of salinity. The proportion of salinity affected farms within each region varies, with the most affected regions in southern Western Australia and in the lower reaches of the Murray-Darling basin (map 24.21).
24.21 NAP REGIONS, Proportion of farms affected by salinity - 2002
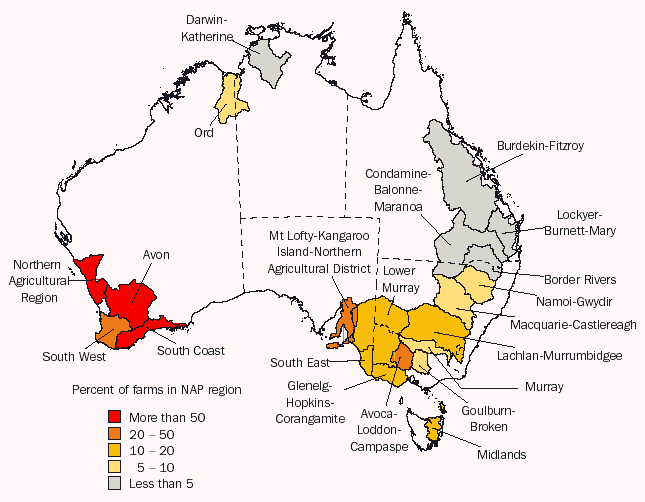 Source: ABS data available on request, Land Management and Salinity Survey, 2002.
The 2002 Land Management and Salinity Survey produced estimates for both irrigated and non-irrigated farms at the NAP region level. Tables 24.22 and 24.23 show the extent of land showing signs of salinity on irrigated and non-irrigated farms, by NAP region. Overall, the NAP region most affected by salinity was Avon (Western Australia) with 2,279 farms and 450,000 ha showing signs of salinity.
Almost 80% of farms and 90% of the farm area showing signs of salinity within the NAP regions is non-irrigated, which is expected given the NAP was established to address dryland salinity. However, the amount of salinity covered by the NAP regions varies between irrigated and non-irrigated farms. While 94.8% of all irrigated land with salinity is within the NAP regions, only 64% of non-irrigated land with salinity is within these regions.
24.22 IRRIGATED FARMS WITH LAND SHOWING SIGNS OF SALINITY, By NAP region - May 2002
|
| Non-irrigated
farms with
land showing
signs of
salinity | Proportion
of total
non-irrigated
farms in NAP
region(a) | Land
showing
signs of
salinity | Proportion
of total
non-irrigated
farm area
in NAP
region(b) | Salinised
land unable
to be
used for
production | Proportion
of land
showing
signs of
salinity(c) | Proportion
of total
irrigated
farm area
in NAP
region(d) |
| no. | % | ha | % | ha | % | % |
|
| Avoca-Loddon-Campaspe | 777 | 39.1 | 30,217 | 4.3 | 9,813 | 32.5 | 1.4 |
| Avon | 18 | 73.6 | *808 | 8.9 | *693 | 85.8 | 7.6 |
| Border Rivers | *13 | 1.7 | n.a. | - | n.a. | n.a. | 0.3 |
| Burdekin-Fitzroy | *56 | 4.0 | *1,110 | 0.1 | *835 | 75.2 | 0.1 |
| Condamine-Balonne-Maranoa | *31 | 2.8 | *531 | 0.0 | *48 | 9.0 | - |
| Darwin-Katherine | - | - | - | - | - | - | - |
| Glenelg-Hopkins-Corangamite | 60 | 8.7 | 1,283 | 0.8 | *379 | 29.5 | 0.2 |
| Goulburn-Broken | 283 | 9.3 | 3,237 | 0.6 | 879 | 27.2 | 0.2 |
| Lachlan-Murrumbidgee | 353 | 14.6 | *17,140 | 0.6 | 1,983 | 11.6 | 0.1 |
| Lockyer-Burnett-Mary | 87 | 3.3 | 693 | 0.1 | *266 | 38.4 | - |
| Lower Murray | 539 | 11.1 | 36,001 | 1.8 | 18,973 | 52.7 | 0.9 |
| Macquarie-Castlereagh | *62 | 9.6 | *2,006 | 0.3 | **1,022 | 51.0 | 0.1 |
| Midlands | 130 | 15.1 | 2,256 | 0.4 | 449 | 19.9 | 0.1 |
| Mt. Lofty-Kangaroo Island-Northern Agricultural District | *550 | 24.2 | 7,979 | 2.8 | *2,533 | 31.8 | 0.9 |
| Murray | 202 | 12.2 | 8,361 | 0.4 | 1,685 | 20.2 | 0.1 |
| Namoi-Gwydir | *51 | 8.1 | *1,933 | 0.3 | *50 | 2.6 | - |
| Northern Agricultural District | *10 | 7.8 | **1,089 | 1.8 | **1,045 | 96.0 | 1.8 |
| Ord | *9 | 12.2 | *88 | 0.4 | **20 | 22.7 | 0.1 |
| South Coast | 74 | 40.3 | 1,341 | 1.5 | 642 | 47.9 | 0.7 |
| South East | *57 | 5.4 | *10,770 | 1.6 | 1,109 | 10.3 | 0.2 |
| South West | 112 | 8.9 | 3,422 | 1.4 | 774 | 22.6 | 0.3 |
| Total NAP | 3,473 | 12.5 | 130,361 | 0.7 | 47,408 | 36.4 | 0.3 |
| Total non-NAP | 576 | 4.8 | 7,178 | 0.2 | 2,961 | 41.3 | 0.1 |
| Australia | 4,049 | 10.2 | 137,539 | 0.6 | 50,369 | 36.6 | 0.2 |
|
(a) Irrigated farms with land showing signs of salinity as a proportion of total irrigated farms in the NAP region/Australia. Source for the denominator is data from the ABS 2001 Agricultural Census.
(b) Land showing signs of salinity as a proportion of total irrigated farm area in the NAP region/Australia. Source for the denominator is data from the ABS 2001 Agricultural Census.
(c) Salinised land unable to be used for production as a proportion of land showing signs of salinity.
(d) Salinised land unable to be used for production as a proportion of total irrigated farm area in the NAP region/Australia. Source for the denominator is data from the ABS 2001 Agricultural Census. |
| | | | | | | |
| Source: Salinity on Australian Farms, 2002 (4615.0). |
24.23 NON-IRRIGATED FARMS WITH LAND SHOWING SIGNS OF SALINITY, By NAP region - May 2002
|
| Non-irrigated
farms with
land showing
signs of
salinity | Proportion
of total
non-irrigated
farms
in NAP
region(a) | Land
showing
signs of
salinity | Proportion
of total
non-irrigated
farm area
in NAP
region(b) | Salinised
land unable
to be
used for
production | Proportion
of land
showing
signs of
salinity(c) | Proportion
of total
irrigated
farm area
in NAP
region(d) |
| no. | % | ha | % | ha | % | % |
|
| Avoca-Loddon-Campaspe | *477 | 19.0 | 8,351 | 0.6 | 3,122 | 37.4 | 0.2 |
| Avon | 2,279 | 79.9 | 450,236 | 5.8 | 284,371 | 63.2 | 3.6 |
| Border Rivers | *137 | 5.0 | n.a. | 0.2 | n.a. | n.a. | 0.3 |
| Burdekin-Fitzroy | *96 | 3.0 | **35,244 | 0.2 | **19,656 | 55.8 | 0.1 |
| Condamine-Balonne-Maranoa | *132 | 2.6 | **27,713 | 0.2 | **2,133 | 7.7 | - |
| Darwin-Katherine | 1 | 0.9 | 2,023 | - | 2,023 | 100.0 | - |
| Glenelg-Hopkins-Corangamite | 1,378 | 19.7 | 30,047 | 1.2 | 9,967 | 33.2 | 0.4 |
| Goulburn-Broken | 229 | 9.2 | 4,195 | 0.5 | 845 | 20.1 | 0.1 |
| Lachlan-Murrumbidgee | 1,124 | 14.8 | *29,620 | 0.4 | 3,508 | 11.8 | 0.1 |
| Lockyer-Burnett-Mary | 168 | 3.8 | *1,196 | - | *650 | 54.4 | - |
| Lower Murray | 1,119 | 18.9 | 74,734 | 0.4 | 36,752 | 49.2 | 0.2 |
| Macquarie-Castlereagh | 435 | 8.4 | 6,988 | 0.1 | *2,519 | 36.1 | - |
| Midlands | *188 | 16.0 | *2,583 | 0.4 | **885 | 34.3 | 0.1 |
| Mt. Lofty-Kangaroo Island-Northern Agricultural District | 1,451 | 28.4 | *51,469 | 1.2 | **22,751 | 44.2 | 0.5 |
| Murray | 104 | 5.8 | *3,244 | 0.2 | 468 | 14.4 | - |
| Namoi-Gwydir | 226 | 6.9 | *4,901 | 0.2 | *652 | 13.3 | - |
| Northern Agricultural District | 868 | 59.2 | 151,944 | 2.8 | 91,391 | 60.2 | 1.7 |
| Ord | - | - | - | - | - | - | - |
| South Coast | 1,354 | 63.6 | 73,618 | 2.4 | 42,242 | 57.4 | 1.4 |
| South East | 209 | 13.8 | 50,631 | 4.9 | *9,250 | 18.3 | 0.9 |
| South West | 1,681 | 50.0 | 153,150 | 5.3 | 78,522 | 51.3 | 2.7 |
| Total NAP | 13,658 | 19.8 | 1,171,475 | 0.9 | 623,708 | 53.2 | 0.5 |
| Total non-NAP | 1,873 | 5.9 | 659,592 | 0.2 | 146,945 | 22.3 | 0.1 |
| Australia | 15,530 | 15.4 | 1,831,067 | 0.4 | 770,653 | 42.1 | 0.2 |
|
(a) Non-irrigated farms with land showing signs of salinity as a proportion of total non-irrigated farms in the NAP region/Australia. Source for the denominator is data from the ABS 2001 Agricultural Census.
(b) Land showing signs of salinity as a proportion of total non-irrigated farm area in the NAP region/Australia. Source for the denominator is data from the ABS 2001 Agricultural Census.
(c) Salinised land unable to be used for production as a proportion of land showing signs of salinity.
(d) Salinised land unable to be used for production as a proportion of total non-irrigated farm area in the NAP region/Australia. Source for the denominator is data from the ABS 2001 Agricultural Census. |
| | | | | | | |
| Source: Salinity on Australian Farms, 2002 (4615.0). |
Comparisons with other data
Farmer assessments of the extent of salinity may differ from assessments made by scientific means, but are an indication of the level of salinity occurring on farms that can be provided rapidly and cost-effectively. The results from the 2002 Land Management and Salinity Survey show a lower level of saline land than other sources (table 24.24). Factors most likely to be contributing to differences are the different concepts, assessment methods and coverage used in each study. While farmers’ perceptions of the area will differ from scientific assessments, they are more or less consistent with the other studies, in terms of the relative area affected by salinity in each state and territory. In all studies, Western Australia is the state most affected by salinity and Northern Territory, Australian Capital Territory and Tasmania are the least affected.
It is important to note that the 2002 Land Management and Salinity Survey provides information for agricultural land only. Agricultural land occupies approximately 456 million ha, representing 59% of land use in Australia, but salinity and salinity management also occur on non-agricultural land. Non-agricultural land was out of scope for the 2002 Land Management and Salinity Survey.
24.24 AREA AFFECTED BY SALINITY, Comparison of ABS results with other estimates
|
| PMSEIC 1999 | | NLWRA 2001 | | ABS 2002 |
|
| |
| |
|
| Area of salinity affected land(a) | | Area at risk of
salinity(b) | | Area showing signs of salinity(c) |
| '000 ha | | '000 ha | | '000 ha |
|
| New South Wales/Australian Capital Territory | 120 | | 181 | | 124 |
| Victoria | 120 | | 670 | | 138 |
| Queensland | 10 | | n.a. | | 106 |
| South Australia | 402 | | 390 | | *350 |
| Western Australia | 1,802 | | 4,363 | | 1,241 |
| Tasmania | 20 | | 54 | | 6 |
| Northern Territory | - | | - | | 2 |
| Australia | 2,476 | | 5,658 | | 1,969 |
|
(a) As determined by experts.
(b) As estimated from water table heights.
(c) As reported by farmers. |
| | | | | |
| Source: Salinity on Australian Farms, 2002 (4615.0). |
|
 Print Page