Analysis
Australian economy grew by 0.4%
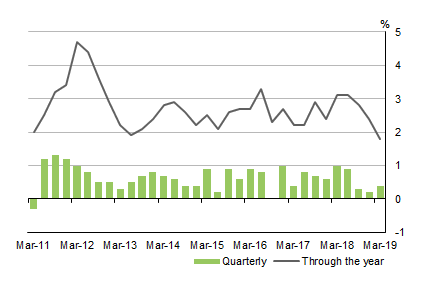
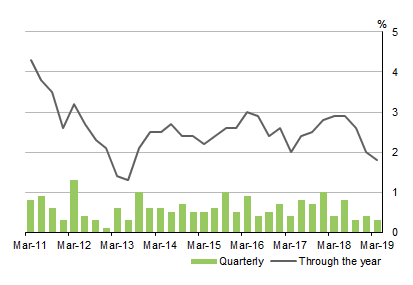
Australia's gross domestic product (GDP) grew by 0.4% in the March quarter 2019, following a 0.2% rise in the December quarter. The Australian economy grew 1.8% through the year.
Gross domestic product, Volume measures: Seasonally adjusted
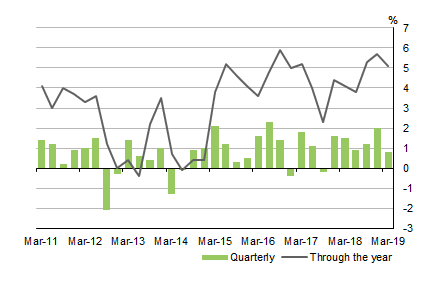
Continued strength in government expenditure
Government final consumption expenditure rose 0.8% in the quarter and remains strong through the year at 5.1%. National non-defence (2.4%) was the main contributor to growth, due to increases in social benefits to households from continued government spending on disability and health services. State and local government expenditure increased 0.4% driven by rises in employee expenses.
Government final consumption expenditure, Volume measures: Seasonally adjusted
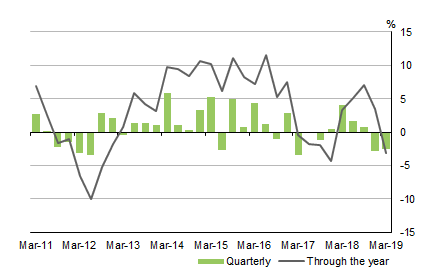
Investment in dwellings continues to fall
Dwelling investment fell 2.5% in the quarter, falling 3.1% through the year. This fall follows significant falls in dwelling approvals. Prior to this, dwelling investment reached record levels in September quarter 2018.
Dwelling investment, Volume measures: Seasonally Adjusted
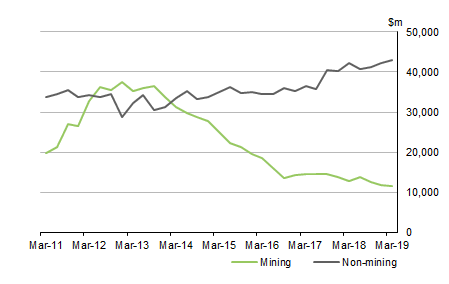
Steady growth in non-mining investment
Non-mining investment grew 2.0%, driven by broad based investment in new buildings, particularly offices and accommodation buildings. Mining investment continued to decline, falling 1.8% in the quarter.
Mining and non-mining investment, Volume measures: Seasonally adjusted
Household consumption slows
Household final consumption expenditure increased 0.3%, with through the year growth moderating to 1.8%. Households reduced discretionary spending, in particular on recreation and culture, hospitality and furnishings and household equipment.
Household final consumption expenditure, Volume measures: Seasonally adjusted
Household saving ratio increased
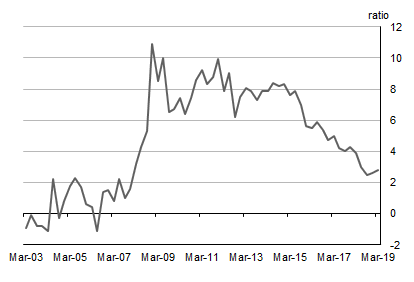
The household saving ratio rose to 2.8 with growth in household disposable income outpacing subdued growth in household spending. The growth in gross disposable income was primarily driven by continued growth in compensation of employees. Non-life insurance claims continued to contribute to household income following a significant rise in the December quarter. These insurance claims are related to recent natural disaster events, namely the Sydney hail storms in December quarter and Queensland floods in the March quarter.
Household saving ratio, Current prices: Seasonally adjusted
 Print Page
 Print All
 Quality Declaration