MAIN FEATURES INCOME AT CURRENT PRICES
 | | | Trend | | Seasonally adjusted |
| | |
| |
|
| | | % Change | % Change | % points contribution to | | % Change | % Change | % points contribution to |
| | | Dec 18 to | Mar 18 to | growth in GDP | | Dec 18 to | Mar 18 to | growth in GDP |
| | | Mar 19 | Mar 19 | Dec 18 to Mar 19 | | Mar 19 | Mar 19 | Dec 18 to Mar 19 |
|
| Compensation of employees | 1.1 | 4.3 | 0.5 | | 1.2 | 4.3 | 0.6 |
 Gross operating surplus Gross operating surplus | | | | | | | |
| Private non-financial corporations | 3.2 | 11.5 | 0.6 | | 3.9 | 11.0 | 0.7 |
| Other(a) | 0.8 | 3.8 | 0.1 | | 0.8 | 3.7 | 0.1 |
| Gross mixed income | -1.2 | -1.9 | -0.1 | | -0.8 | -1.5 | -0.1 |
| Taxes less subsidies on production and imports | -0.2 | 0.5 | - | | 1.0 | 1.0 | 0.1 |
| Statistical discrepancy (I) | na | na | 0.1 | | na | na | - |
| Gross domestic product | 1.2 | 5.0 | 1.2 | | 1.4 | 4.9 | 1.4 |
|
- nil or rounded to zero (including null cells)
na not available |
| (a) Includes Public non-financial corporations Financial corporations General government and Dwellings owned by persons. |
MARCH QUARTER
Summary Comments
Gross operating surplus (GOS)
- Total GOS grew 2.5% increasing for all sectors except public non-financial corporations. Private non-financial corporations were the main contributor to growth, increasing 3.9%, which is consistent with the rise in the terms of trade (3.1%).
- Through the year GOS increased 7.5%. Mining was the main contributor to this growth, driven by higher commodity prices and increased production volumes.
Compensation of employees (COE)
- COE increased 1.2% and average compensation per employee rose 0.4%.
- Private COE grew 1.4%, while public COE increased 0.7%.
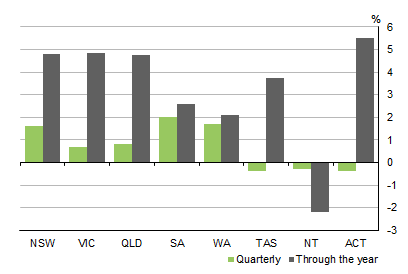
- The five largest states recorded growth with New South Wales (1.6%) the main contributor. All states recorded growth in COE through the year with the exception of Northern Territory.
State compensation of employees, Current prices
: Seasonally adjusted
 Quality Declaration
  Print Page
 Print All