KEY FIGURES
LAND USE, Australia, year ended 30 June 2017
|
 | Aust.
'000 ha | NSW
'000 ha | Vic.
'000 ha | Qld
'000 ha | SA
'000 ha | WA
'000 ha | Tas.
'000 ha | NT
'000 ha | ACT
'000 ha | |
|
| Area of farms | 393 797 | 55 414 | 10 852 | 137 955 | 49 720 | 83 770 | 1 480 | 54 580 | 25 | |
| Area of crops (a) | 28 130 | 7 580 | 4 435 | 2 605 | 4 462 | 8 894 | 134 | 21 | 0 | |
| Area of non-agricultural land | 375 405 | 24 650 | 11 890 | 35 110 | 48 628 | 169 218 | 5 360 | 80 333 | 211 | |
| Total land area (b) | 769 202 | 80 064 | 22 742 | 173 065 | 98 348 | 252 988 | 6 840 | 134 913 | 236 | |
|
(a) Includes broadacre crops, hay and silage and horticulture
(b) Total land area supplied by Geoscience Australia
KEY LAND USE POINTS
- At 30 June 2017 there were 394 million hectares of agricultural land in Australia, a 6% increase compared with the previous year. Coinciding with this increase in agricultural land, there were 2,400 more agricultural businesses, representing a 3% increase since 2015-16.
- Of all the states and territories, Queensland had the highest proportion of agricultural land, accounting for 35% of total area of holding in Australia, an increase of 1.6% since 2015-16.
FARM MANAGEMENT, Australia, year ended 30 June 2017
|
| Aust. | NSW | Vic. | Qld | SA | WA | Tas. | NT | ACT | |
|
| Average age of provider (yrs) | 57 | 58 | 58 | 57 | 55 | 56 | 56 | 52 | 57 | |
| Average time provider involved in farming (yrs) | 37 | 37 | 36 | 38 | 35 | 36 | 35 | 26 | 30 | |
| Male providers (%) | 79 | 79 | 80 | 74 | 83 | 82 | 81 | 66 | 74 | |
| Female providers (%) | 21 | 21 | 20 | 26 | 17 | 18 | 19 | 33 | 26 | |
|
|
|
SOURCES OF FARM INCOME (%) |
|
| Agricultural production on holding | 85 | 84 | 83 | 85 | 87 | 86 | 82 | 83 | 76 | |
| Off-farm employment/business activities | 12 | 12 | 12 | 13 | 9 | 10 | 14 | 11 | 18 | |
| Grants, government transfers and relief funding | 1 | 1 | 1 | 1 | 0 | 0 | 1 | np | np | |
| Other sources | 4 | 4 | 4 | 4 | 3 | 4 | 3 | np | np | |
|
| | | | | | | | | | |
np not available for publication
KEY FARM MANAGEMENT POINTS
In 2016-17, key attributes of Australian farm management were:
- The average number of years respondents were involved in farming was 37. Queensland had the highest average at 38 years and the Northern Territory the lowest at 26 years.
- The majority of business income for agricultural producers in 2016-17 was from agricultural production (85%), up from 84% in 2015-16.
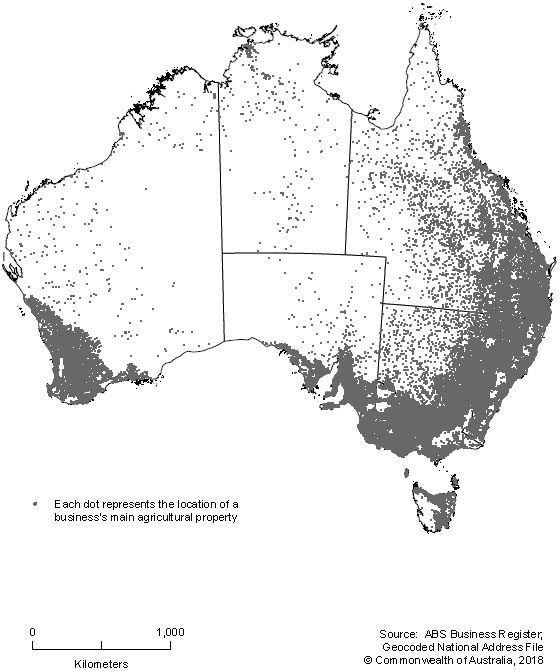
- Figure 1 shows the location of agricultural businesses in Australia:
 Quality Declaration
  Print Page
 Print All