Archived content. This page is no longer actively maintained and may not function as intended. For the latest information and statistics visit the ABS Website.
GROSS VALUE OF IRRIGATED AGRICULTURAL PRODUCTION (GVIAP)
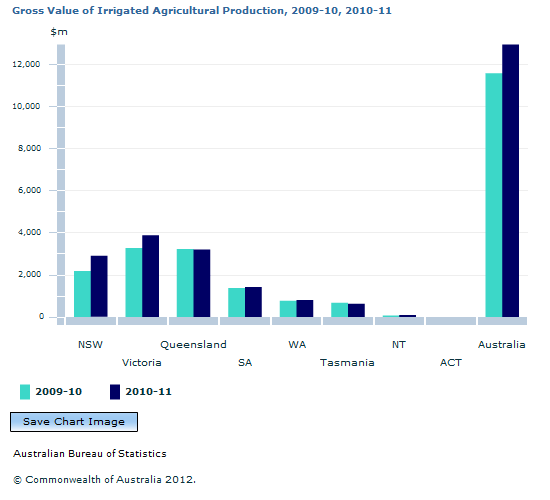
In 2010-11, Australian GVIAP recorded an increase of $1.4 billion (or 12%) on 2009-10 to $12.9 billion. With the exception of Tasmania (-7%) and Queensland (-1%), all states and territories recorded increases in their GVIAP. New South Wales recorded the highest increase of $720.3 million (up 33% to $2.9 billion), followed by Victoria with an increase of $607.2 million (up 19% to $3.9 billion) and South Australia with an increase of $52.0 million (up 4% to $1.4 billion) in their GVIAP.
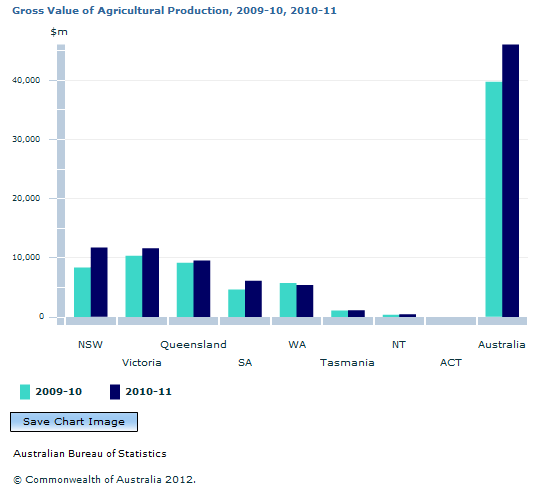
In 2010-11, the Australian GVAP stood at $46.0 billion, an increase of $6.3 billion or 16% on 2009-10. With the exception of WA (-6%), all other states and territories recorded increases in their GVAP. New South Wales recorded the highest increase of $3.4 billion (or 40% to $11.7 billion), followed by South Australia, up $1.5 billion (or 32% to $6.1 billion) and Victoria, up $1.3 billion (or 12% to $11.6 billion) in 2010-11.
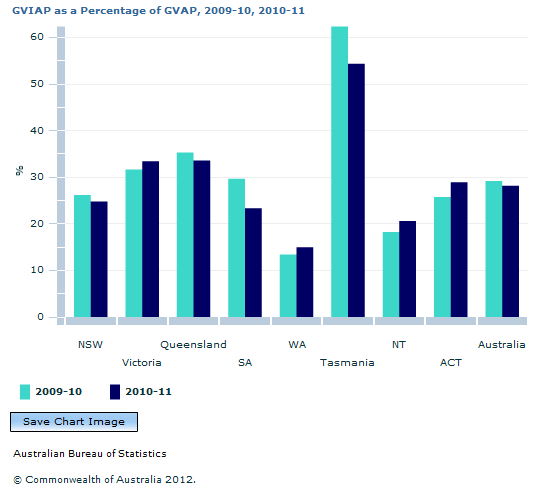
In 2010-11, Australian GVIAP was 28% of GVAP, which was 1% less than the previous year. Of all states and Territories in 2010-11, Tasmania’s GVIAP was the highest proportion of GVAP, at 54% (down from 62%). Conversely, Western Australia had the lowest GVIAP to GVAP ratio, at 15%, which was a slight increase from the previous year.
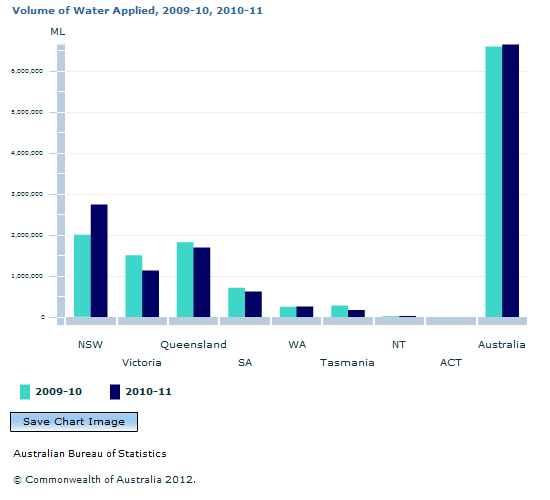
In 2010-11, the total volume of water applied for irrigation in Australia was 6.6 million ML. In the states and territories NSW was the largest user of water for irrigation at 2.7 million ML , which is a 37% increase on the previous year. Queensland was the second largest user of water for irrigation with 1.7 million ML, followed by Victoria with 1.1 million ML, however, both of these states used less water for irrigation in 2010-11 than in the previous year.
 Quality Declaration
  Print Page
 Print All