Part C - The structure of the GFS framework
4.10.
The GFS framework combines elements from the GFS balance sheet, statement of operations, the statement of sources and uses of cash, and statement of stocks and flows to describe and record economic events that occur during an accounting period. This can be shown through the maintenance of opening stock figures, details of the transactions and other economic flows that occur during the accounting period, and closing stock figures. The relationships between stocks and flows can be analysed to explain the effects of government policy and the fiscal effects of government operations.
4.11.
The GFS analytical framework in diagram 4.1 presents the accrual component of the broader GFS framework and the relationships between the elements within it. In the broadest sense, the GFS analytical framework illustrates that during the accounting period, the closing stock position equals the opening stock position plus transactions and other economic flows.
Diagram 4.1 - The GFS analytical framework
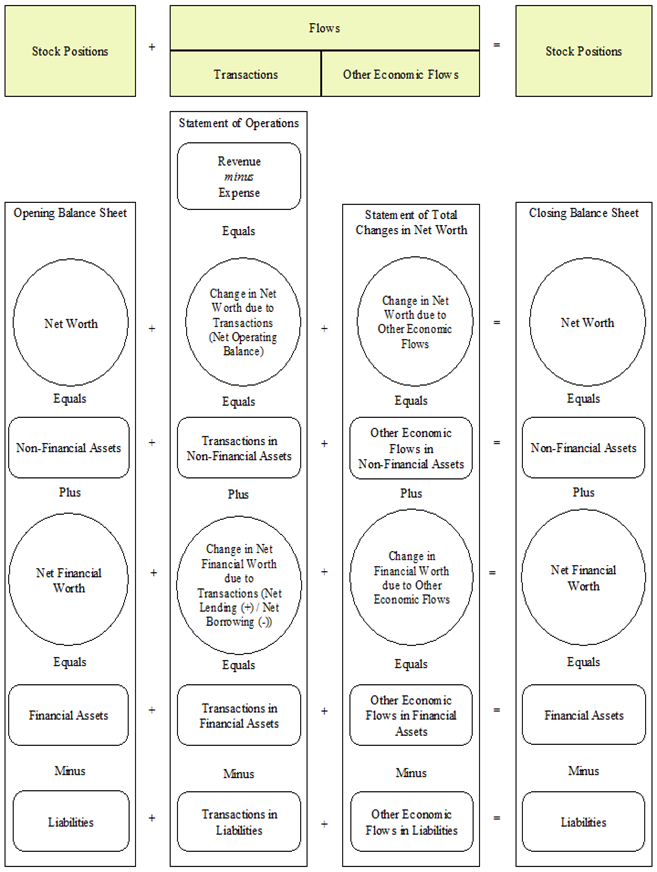
Source: International Monetary Fund Government Finance Statistics Manual, 2014.
4.12.
The key analytical aggregates are shown in circles in the broad GFS analytical framework in Diagram 4.1. They are:
- Net worth with both opening and closing balances represented;
- Change in net worth due to transactions which is equal to the net operating balance;
- Change in net worth due to other economic flows;
- Net financial worth with both opening and closing balances represented;
- Change in net financial worth due to transactions which is equal to net lending (+) / net borrowing (-); and
- Change in net financial worth due to other economic flows
4.13.
Please note that the cash surplus (+) / cash deficit (-) is also a key analytical aggregate in the broader GFS framework, although this does not appear in the analytical framework diagram. The GFS cash surplus (+) / cash deficit (-) is represented by cash flows from operating activities plus cash flows from investments in non-financial assets.
4.14.
The second analytical aggregate in the statement of operations is the GFS net lending(+) / net borrowing(- ). This is derived as the net operating balance less net acquisition of non-financial assets. GFS net lending(+) / net borrowing(-) is also equal to the net acquisition of all financial assets arising from transactions minus the net incurrence of all liabilities arising from transactions. This can be demonstrated arithmetically as follows in Table 4.1:
| (1) | Net Lending (+) / Net Borrowing (-) | = | Net Operating Balance | - | Net Change in Non-Financial Assets due to Transactions | ||
|---|---|---|---|---|---|---|---|
| (2) | Net Operating Balance | = | Change in Net Worth due to Transactions | ||||
| (3) | Change in Net Worth due to Transactions | = | Net Change in Non-Financial Assets due to Transactions | + | Net Change in Financial Assets / Liabilities due to Transactions* | ||
| Therefore: | |||||||
| (4) | Net Operating Balance | = | Net Change in Non-Financial Assets due to Transactions | + | Net Change in Financial Assets / Liabilities due to Transactions* | ||
| And substituting in (1) | |||||||
| (5) | Net Lending (+) / Net Borrowing (-) | = | Net Change in NonFinancial Assets due to Transactions | + | Net Change in Financial Assets / Liabilities due to Transactions | - | Net Change in Non-Financial Assets due to Transactions |
| Therefore: | |||||||
| (6) | Net Lending (+) / Net Borrowing (-) | = | Net Change in Financial Assets / Liabilities due to Transactions | ||||
Note: Also known as the Change in Net Financial Worth or GFS Net lending (+) / Net Borrowing.