Administrative data snapshot of population, methodology

Latest release
Reference period
30 June 2021
Released
15/08/2023
Next release Unknown
First release

What is the Administrative data snapshot of population and housing?

The Administrative Data Snapshot of Population and Housing (ADS) is a new, experimental release of population and housing data built from administrative data sources.

Like the Census, the ADS provides a snapshot of Australian people and houses at a point in time but has a smaller and different set of person and housing characteristics.

The ADS is made up of two parts: a population snapshot dataset and a housing snapshot dataset. These datasets were first created to support the 2021 Census and are now being released as an integrated, stand-alone product.

The ADS has a reference date of 30 June 2021, which is close to Census night (10 August 2021). This enables the best comparison with Census data and official population and housing statistics.

This article explains methodology used to create the population part of the ADS, referred to as the “population snapshot”. It shows:

  • How the population snapshot is created from administrative data sources
  • How the population snapshot compares to and differs from the Census and official Estimated Resident Population.

What is administrative data

Administrative data is information that government departments, businesses and other organisations collect. They collect information for a range of reasons such as:

  • registrations
  • sales
  • record keeping.

Some examples of administrative data:

  • personal income tax information from the Australian Taxation Office
  • information about the number of people who are registered with Medicare from the Department of Health and Aged Care.

The ABS only collects and uses administrative data for statistics and research.

Creating the population snapshot from administrative data

Data used to create the population snapshot

The population snapshot is created using integrated administrative data from the Multi-Agency Data Integration Project (MADIP). MADIP is a secure population data asset combining information on health, education, government payments, income and taxation, employment, and population demographics (including the Census) over time.

There are four distinct steps to creating the population snapshot from the integrated administrative data in MADIP:

  1. Creating an ever-resident administrative population
  2. Capturing the population at a point in time (population scoping)
  3. Locating people at a point in time
  4. Deriving information about people in the population snapshot.

Table 1 lists the specific MADIP datasets used and their involvement in each of the four steps.

Table 1. Datasets used to create the population snapshot and their involvement at each step
Dataset1. Creating an ever-resident administrative population2. Capturing the population at a point in time using activity data3. Locating people at a point in time4. Deriving information about people in the population snapshot

Medicare Consumer Directory

(Medicare registrations)

YesYesYesYes

DOMINO Centrelink Administrative Data

(Centrelink registrations)

YesYesYesYes

Personal Income Tax

(Tax registrations)

YesYesYesYes

Single Touch Payroll

 Yes Yes

Death Registrations

 Yes  

Net Overseas Migration

 Yes  

Medicare Benefits Schedule

 Yes  

Pharmaceutical Benefits Scheme

 Yes  

Australian Immunisation Register

 Yes  

Step 1 - Creating an ever-resident administrative population

MADIP aims to represent all people who were resident in Australia from 2006 onwards. This is referred to as the 'ever-resident' Australian population since 2006.

This is achieved through the creation of the Person Linkage Spine, which uses data linkage methods to combine the populations from the Medicare Consumer Directory (referred to as Medicare registrations), DOMINO Centrelink Administrative data (Centrelink registrations) and Personal Income Tax data (Tax registrations).

The ever-resident administrative population created from these data sources up to the reference point of interest (30 June 2021) included 36.6 million people.

Step 2 - Capturing the population at a point in time (scoping)

The next step to creating the population snapshot is to determine which people in the ever-resident population are still residing in Australia at the reference point of interest (30 June 2021).

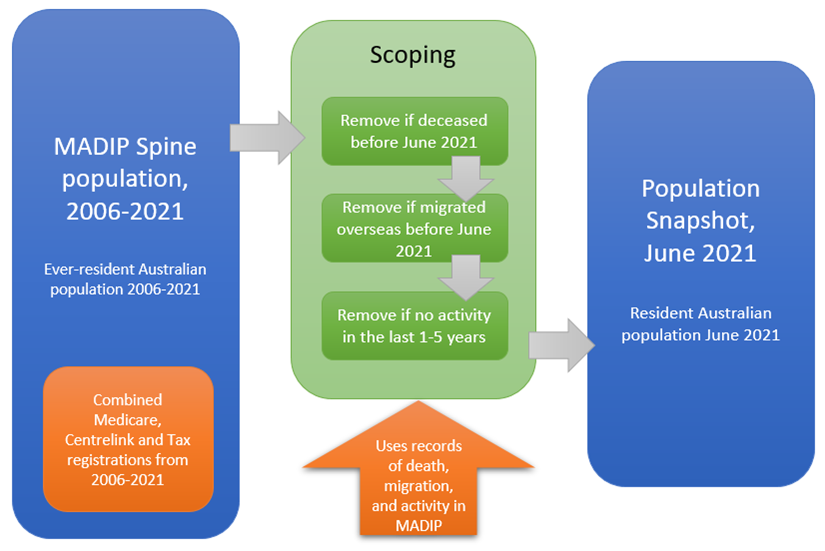
Rules are applied (listed in Table 2) to remove people who have either died or have left Australia prior to the reference date. This process is referred to as 'scoping' the administrative population. Figure 1 shows a diagram of the scoping process.

Death registrations are used to remove people who have died, and overseas migration records are used to remove people who have left the country before the reference date.

People who have no recent record of government services activity (for 1-5 years, depending on their age) are also removed. These people are assumed to have died or left the country but have no matched date of death or overseas migration record.

Finally, any people missing information for age, sex or state/territory are removed. This removes only a very small number of records.

Table 2. Rules used to scope the administrative data to people living in Australia at 30 June 2021
Scoping ruleMeasured byNumber of people removed
1. Remove people recorded as deceased prior to 30 June 2021Date of death4.7 million
2. Remove people recorded as having left the country prior to 30 June 2021

Date of arrival

Date of departure

4.6 million
3. Remove people who have not recently used a government serviceUse of a government service in the last 1-5 years(a)1.6 million
4. Remove people with missing age, sex, or state/territory 14,000 people

(a) 5 years for people under 25, 2 years for people aged 25-79, 1 year for people aged over 80 years

Figure 1. Scoping the MADIP ever-resident population to the population at a point in time

Diagram depicting the process of scoping the MADIP ever-resident population to the population at a point in time

The image is a flow diagram of how the ever-resident population is filtered to produce the population at a point in time. There are three main boxes. The first box on the left represents the ever-resident Australian population for the time period of 2006 to 2021 (the MADIP Spine population). This is created from combined Medicare, Centrelink and Tax registrations from 2006 to 2021. Data from the left hand box feed into the centre box, which represents the rules used to scope the ever-resident population. The first scoping rule is to remove persons if they died before June 2021. The next scoping rule is to remove persons if they migrated overseas before June 2021. The final scoping rule is to remove persons with no activity recorded in the last 1-5 years. These scoping rules use records of death, migration and activity in MADIP. The third box on the right represents the population snapshot at 30 June 2021. It contains records for the resident Australian population as determined by the scoping rules.

Step 3 - Locating people at a point in time

Rules are applied to assign people in the snapshot to the most appropriate geographic location at the reference date.

People can report different addresses over time as they interact with government through Medicare, Centrelink and the Australian Tax Office. The ABS codes these addresses to geographical areas in the Australian Statistical Geography Standard (ASGS) and also to a unique, anonymised address identifier where possible.

Once the set of possible locations is coded, there are a number of passes to define the most appropriate location for a person at the reference date. These passes start with the most precise location information available (anonymised address) and proceed to broader area locations where a more precise location is not available. Residential address locations are prioritised over postal address locations.

At each pass, the most recently updated location will be chosen if there is more than one candidate.

Chart 1 shows the level of location assigned to people on the snapshot within each state and territory. For all states and territories, the majority could be assigned to the most precise levels; either an address or a Mesh Block. For the Northern Territory around 10% of people could only be assigned a location at the SA1 level or higher. This reflects the more remote geography of the Northern Territory, where there is more difficulty in coding administrative address information with precision.

Step 4 – Deriving information about people in the population snapshot

Like the Census, the population snapshot has a set of population characteristics for the people within it. These are more limited than what is available in the Census but include some information that is not available in the Census such as a person’s address 2, 3 and 4 years ago.

This information is derived using the administrative data sources listed in Table 1 and includes:

  • Age and sex
  • Previous locations (1, 2, 3, 4, and 5 years ago)
  • Average weekly income (2020–21 financial year)
  • Main source of income
  • Main type of government benefit payment
  • How recently a person was active within MADIP datasets
  • Number of MADIP spine datasets the person is recorded in.
     

Comparing the population snapshot with Census and official population estimates

The population snapshot is an experimental product that uses integrated administrative data to provide a snapshot of Australia’s population at a point in time. It does not replace Australia’s official population estimate, the Estimated Resident Population (ERP), nor does it provide the substantial level of detail published in the Census of Population and Housing.

Scope

Conceptually, the population snapshot aims to achieve the same scope as ERP – all people who usually live in Australia, including those who are overseas in the short-term. This differs from the Census which aims to capture all people in Australia on Census night, including overseas visitors. The Census does not include usual residents who are out of the country on Census night.

Coverage

Coverage refers to the extent to which the population has been accurately measured according to the defined scope.

Inevitably the Census will miss some people or count some people more than once. Similarly, the ERP and population snapshot will over- or undercount the population in different areas. This is known as the coverage error.

While there is no formal method for measuring coverage error in the population snapshot, there are known areas of undercoverage in the administrative data which will affect the population counts from it. These include:

  • 0-1-year-olds
  • Temporary migrants
  • International students
  • People in remote areas.

The undercoverage for 0-1-year-olds is due to delays in births being registered with Medicare. The undercoverage for temporary migrants and international students reflects that some people in these groups may never (or take some years to) interact with Medicare or Centrelink, or complete a tax return. Undercoverage in remote areas reflects the difficulty in accurately coding people to these areas with the address information provided in administrative data.

The Post Enumeration Survey (PES) is used to officially measure under- and overcount in the Census. The headline measure from the PES is known as the Census net undercount and is used in combination with Census counts and administrative births, deaths and migration data to derive the estimated resident population (ERP) for 30 June of the Census year.

Timeliness

Updates to administrative records continue to occur over time, and hence the quality and completeness of a population snapshot improves as the time between the reference date and the derivation of the snapshot increases.

To support the 2021 Census, a population snapshot for 30 June 2021 was first created around December 2021, approximately six months after the reference date. While this earlier snapshot was suitable for supporting the Census, information used for this publication’s snapshot was extracted 12-18 months after the Census, so its quality and completeness is greater.

There are similar trade-offs between timeliness and completeness with Census data outputs and ERP. The earliest results from the Census are released nine months after the reference date, and more enriched data is released 15 months after the Census.

ERP is released six months after the reference date and updated each quarter, using administrative births, deaths and migration data. These updates are revised over time as the administrative data becomes more complete. More detailed regional estimates are released annually from nine months after the reference date.

Statistical comparisons

1. Comparing aggregate population counts

The national count of usual residents from the population snapshot, Census, and ERP is listed in Table 3.
 

Table 3. Number of persons in population datasets
Data sourceNumber of Persons

Population snapshot (30 June 2021)

25,744,797

Census (10 August 2021)

25,422,778

Estimated resident population (30 June 2021)

25,685,412


The usual resident count for the Census is lower than both the count from the population snapshot and ERP. This is because the Census does not capture usual residents who are living overseas at Census time.

Since the population snapshot is conceptually closer to ERP than Census, comparisons from here on are made to ERP as the most appropriate indication of quality.

ERP is subject to a degree of sampling error introduced by using the PES undercount, so differences between population snapshot counts and ERP could be due to this error.

To remove this consideration from the comparison, the margin of error (MoE) on the PES undercount (1.96 times the PES standard error) is used to calculate an upper and lower bound for the difference. If the difference exceeds these bounds, there is 95% confidence that the difference is significant and not due to sampling error.

For example, at the national level, the snapshot counted around 60,000 people, or 0.2%, more than ERP. However, the upper MoE bound for ERP at a national level is 0.34% or around 90,000 people. This indicates that the snapshot count is not significantly different to ERP at a national level.

National, state/territory and regional counts

Chart 2 shows that differences at the state and territory level are generally not significant with the exception of Queensland (1.0% more than ERP) and Western Australia (1.6% less than ERP).

Differences are similarly small when comparing counts for capital cities and regional areas in states and territories (Chart 3). A notable exception is the Northern Territory, where the regional count is 7.3% lower than ERP. The count for regional Queensland is also significantly different, around 1.8% higher than ERP.

Counts for capital cities are not statistically different to ERP with the exception of Greater Perth which has around 1.5% fewer people on the snapshot than in ERP.

Chart 4. Comparing counts across regions

Loading map...

This interactive map shows the percentage difference in the number of persons in the population snapshot compared to ERP, by SA4 which is based on the boundaries released in the ASGS.

Counts by age and sex

Chart 5 shows the alignment between the national age profile of the population snapshot and ERP, comparing the two by single years of age.

The standout difference is for 0-year-olds, where the snapshot is 12% lower than ERP. This reflects under-coverage in the administrative data due to a delay in births being registered with Medicare.

Chart 6 shows differences between ERP and the population snapshot for males and females in five-year age groups. While there is alignment in most age groups, particularly for females, there are marginally higher counts in the snapshot for males in the 25-59 age range.

Counts for local areas (SA2s)

SA2 population counts in the snapshot generally align well with ERP (Chart 8). About 86% of SA2s have differences within 5% of ERP, and about 96% within 10%.

While the population snapshot has more people overall than ERP, there are more areas with counts lower than ERP than those with higher counts. More areas have significant undercoverage than significant overcoverage: only two areas have counts more than 20% over ERP, while 39 areas have counts more than 20% under ERP.

(a) Excludes SA2s with ERP smaller than 1,000 people.

2. Comparing location and other information with Census

While ERP is the most appropriate for comparing aggregate counts, Census data is useful for assessing personal characteristics such as a person’s location, their age, their previous locations, and their income.

Location

The Census provides the usual residence of Australians at Census time. Table 4 shows how often a person’s location on the snapshot matched the Census location at the state or territory, SA2 and street address levels.

Table 4. Proportion of the population with the same location in the Population Snapshot and the Census, 2021
Location levelPercentage of persons
State or territory98.6%
Local area (SA2)88.6%
Address86.5%


Age and Sex

Comparing a person’s age in the snapshot with their age in the Census, people had the same year of age 93.6% of the time. People had their age recorded to within one year of the Census 99.7% of the time. For example, if a person’s age on the Census was 70, then their age in the population snapshot was between 69 and 71. People had the same sex recorded in the population snapshot and the Census 99.8% of the time.

Previous location

Comparing a person’s previous location in the population snapshot with the Census at an aggregate level, results are comparable. There is a similar proportion of people with the same address one year ago – 84.6% in the snapshot compared with 84.7% in the Census. There are fewer people with the same address five years ago – 55.5% in the snapshot compared with 60.0% in the Census.
 

Income

The population snapshot includes three income variables: Average weekly income, Main source of income and Main type of government benefit payment.  These were recently added to the 2021 Census dataset using data linking techniques, with a detailed analysis of how administrative income compares to Census income in the linked Census dataset.

While much of this analysis is relevant, the linked 2021 Census dataset only included people from administrative data that could be linked to the Census.  The analysis showed that income information from administrative data was available for slightly fewer records in the linked dataset compared with reported Census income, especially for areas where it was more difficult to link administrative data to the Census.

Chart 10 shows the proportion of records with a positive income in the population snapshot compared to the linked 2021 Census dataset.  Records with nil, negative or non-stated income values have been removed from the comparison as these records are defined differently in each dataset.

The population snapshot captures positive income data for around 90.7% of the population aged over 15 compared with 82.3% from reported Census income and 79.7% from administrative income linked to the Census.

(a) Persons aged 15 years and over.

(b) Excludes Negative income, Nil income, and income Not stated/Not available.

(c) Denominator for proportions is ERP as at 30 June 2021.

Chart 11 shows the distribution of personal average weekly income from the population snapshot compared with the distributions on the linked 2021 dataset.  The population snapshot captures noticeably more people with income in the $1-$149, $400-$499 and $2,000-$2,999 income ranges.

(a) Persons aged 15 years and over.

(b) Excludes Negative income, Nil income, and income Not stated/Not available.

Glossary

Show all

Ever-resident population

Persons who are captured in administrative data as previous or current residents of Australia.

Location

Where a person is deemed to usually reside. This is determined from their reported address information in administrative data. Addresses are coded to geographical areas in the Australian Statistical Geography Standard (ASGS) and also to a unique, anonymised address identifier where possible, which is the most precise level of location.

Main source of income

The main source of income that a person received based on all income recorded in administrative data for the 2020-21 financial year.

Main type of government benefit

The main type of government benefit payment that a person received based on all government benefits, pensions, and allowances recorded in administrative data for the 2020-21 financial year.

Personal income

The total income that a person received for the 2020-21 financial year as reported in administrative data. For comparability with other collections, personal income is reported in a weekly amount ((annual income / 365) * 52).

Scoping

The process of identifying a subset of relevant records from a larger collection of data. In the context of the Admin data snapshot, scoping refers to selecting records that are believed to be part of the Australian usual resident population at a given point in time.

 
Back to top of the page