Story 8: Monitoring operations during the Census
Introduction
In 2016, the ABS adapted to a new Census collection model that helped pave the way for further operational innovations in 2021. Adapting similar methods used for the United Kingdom and Canadian censuses, the ABS changed to an address list basis in the 2016 Census. Previously we gave field staff a map with their area marked and they had to visit every dwelling they found. This was a far less efficient method before 2016.
The new model allowed us, for the first time, to see real-time response rates across all areas and population types. It allowed us to see potential issues and make decisions to deal with them, while we still had a large field workforce and time to engage the public. Before 2016, some data issues were only found after the forms came back a few months after Census day and were thus very difficult to fix.
It was clear we could do more and better in 2021. A key recommendation from the 2016 Census was to consolidate the operational and management data into a single, unified channel. This initiated the Operations Insights project, in which data from all sources was ingested and transformed into a single, cloud-based data lake.
The Operations Insights tool
The aim of the Operations Insights project was that all Census staff could monitor 2021 Census operations with near real-time data and make informed decisions quickly. Some specific aims for the Operations Insights tool were:
- having a single source of truth
- ensuring data transformations (converting the data from one format to another) are traceable – so it was easy to understand where the final values in the reports came from
- having a secure platform with centralised access controls – so that access could be easily granted and removed.
We achieved these aims developing the tool in partnership with Amazon Web Services, Shine Solutions, and ARQ Group.
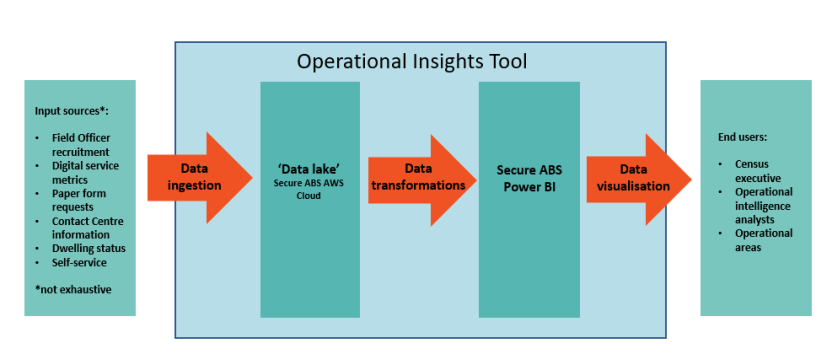
Our tool had three processes that are typical of a data lake:
- The ingestion of the raw operational data (most of which was not designed for reporting).
- Transform (or derive) the data it into a format that can be easily understood for reporting.
- Visualise and report the data. We used the Microsoft Power BI tool for end users to view these reports themselves.
Image
Description
Throughout the 2021 Census we had more than 100 Power BI reports servicing a wide range of users. The reports were in the form of tables, graphs and maps, and used interactive features such as filters and views. Reports were generally designed to meet one of three reporting needs:
- Strategic reporting – providing a high-level view of Census operations. These reports informed decisions at a macro level for the Census Program.
- Tactical reporting – providing short-term analysis that allowed a deep-dive into data for areas and population groups. This provided a detailed understanding of operational metrics and it informed decision making.
- Operational reporting – enabling operational areas to monitor day-to-day progress at a granular level. This informed decisions about the allocation of resources and helped determine how effective processes were.
The data in most reports refreshed at least once an hour with some refreshing every five minutes. This streamlined approach was a large improvement from the spreadsheets used for monitoring in the 2016 Census, which were circulated once a day and included only a fraction of the breadth and depth of metrics in the 2021 reports.
The new Operations Insights tool for 2021 significantly improved the capability for operations staff to make decisions. It provided them with near real-time data, tailored reports and visualisations.
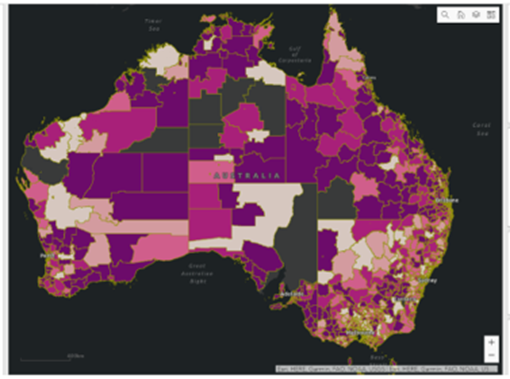
An example heat map showing response rates across the country.
Adaptive variations and responsive treatments
As explained in About the Census, there are standard processes for the mail-out, drop-off and remote areas strategies. For some areas, though, we need to vary these processes to mitigate potential risks to response rates.
The ABS first introduced these new strategies in 2016 and built on them in 2021. Without them, it is likely some parts of the country would have had a poorer response. We classify these strategies as ‘adaptive variations’ and ‘responsive treatments’.
Adaptive variations
Adaptive variations are pre-emptive strategies used for areas where it is historically difficult to obtain a high response or that have characteristics such as low internet uptake. For the 2021 Census, these areas were chosen using 2016 response data.
The adaptive variations for 2021 included:
- Paper form on approach – this involved mailing a paper form to respondents instead of the Census Introduction Letter. It was used in areas likely to have lower online uptake. Almost one million dwellings received a paper form on approach.
- Early start to visit – in areas with typically lower compliance and self-response, field staff were employed to commence door knocking visits earlier than in other areas. This typically involves commencing visits a few days after Census day instead of the standard ten days. It meant more visits to dwellings in these areas. In areas with a predicted high volume of empty dwellings, such as holiday areas, it also helped identify occupancy where there was no response. We selected 1.05 million dwellings for early start to visit.
Responsive treatments
Responsive treatments are interventions that can be applied during the Collection period in response to local issues and when there are risks to response rates and other data quality outcomes.
The responsive treatments for 2021 included:
- Targeted communication – this involved quick and targeted communication to specific areas using a variety of channels, particularly radio and social media adverts. Targeted communication was also used for raising property owners’ awareness that they could self-report vacant dwellings.
- Extended follow-up – some field visits were extended beyond the planned timeframes. This method was used in Sydney and Melbourne due to lockdowns. Regional areas, particularly parts of the Northern Territory also had extended follow up due to the time needed to cover large distances and to counter lower response rates.
- Deploy flying squads – groups of ABS office staff, also known as ‘flying squads’, were despatched to door knock when other options were exhausted. They were deployed throughout the collection period, particularly in areas with field staff recruitment shortages. COVID-19 travel restrictions impacted our ability to readily use flying squads, particularly crossing state borders. This treatment was effective in improving response and other quality outcomes.
- Unaddressed mail service – in a selection of postcodes with staff shortages, and an unreliable address list, we used Australia Post’s unaddressed mail service. Dwellings in these areas received a letter with details on how to complete the Census online well before their paper form was delivered by a Census field staff member.