This release corrects the projected proportion of the population aged 65 years and over in 2051 (Series C) as shown in the Population Ageing section of the Main Features and reissues the publication. The correct number is 28% but was incorrectly published as 38%.
Please note that other components of this Product have not been reissued.
NOTES
ABOUT THIS ISSUE
This publication contains projections of Australia's population by age and sex for the period 2004–2101, and projections of the states, territories and capital cities/balances of state for the period 2004–2051. The 30 June 2004 figures are revised estimated resident population.
Three main series of projections have been presented in this publication. Detailed information for these series can be obtained free of charge from this site. For further information on additional statistics available see paragraphs 18–20 of the Explanatory Notes.
DATA NOTES
The projections are not intended as predictions or forecasts, but are illustrations of growth and change in the population that would occur if assumptions made about future demographic trends were to prevail over the projection period.
While the assumptions are formulated on the basis of an assessment of past demographic trends, both in Australia and overseas, there is no certainty that any of the assumptions will be realised. In addition, no assessment has been made of changes in non–demographic conditions.
ROUNDING
Population estimates and projections in this publication have been rounded to the nearest hundred. Calculations of percentage and numeric change and proportions are based on unrounded data.
INQUIRIES
For further information about these and related statistics, contact the National Information and Referral Service on 1300 135 070 or Matthew Montgomery on Canberra (02) 6252 6487.
SUMMARY COMMENTARY
INTRODUCTION
The population projections presented in this publication cover the period June 2004 to June 2101 for Australia and June 2004 to June 2051 for the states, territories, capital cities and balances of state.
The projections are not predictions or forecasts, but are simply illustrations of the growth and change in population which would occur if certain assumptions about future levels of fertility, mortality, internal migration and net overseas migration (NOM) were to prevail over the projection period.
This chapter discusses the projection results, in terms of population size and growth, and the changing age structure and distribution of the population. Three main series of projections, Series A, B and C, have been selected from a possible 72 individual combinations of the various assumptions.
MAIN PROJECTION SERIES, Australia |
|  |
| Assumptions | Projected population
at 30 June | |
| | | Life expectancy at birth(a) | | | |
| Total fertility
rate(b) | Net overseas
migration(c) | Males | Females | 2051 | 2101 | |
| babies per woman | persons per
year | years | years | million | million | |
| |
| Series A | 1.9 | 140 000 | 92.7 | 95.1 | 33.4 | 43.5 | |
| Series B | 1.7 | 110 000 | 84.9 | 88.0 | 28.2 | 30.6 | |
| Series C | 1.5 | 80 000 | 84.9 | 88.0 | 24.9 | 22.4 | |
| |
| (a) From 2050–51. |
| (b) From 2018. |
| (c) From 2007–08 in Series A and C. From 2004–05 in Series B. |
POPULATION SIZE AND GROWTH
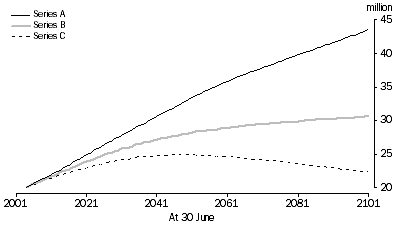
Australia's estimated resident population (ERP) at June 2004 of 20.1 million people is projected to increase to between 24.9 and 33.4 million in 2051, and to between 22.4 and 43.5 million in 2101. Series A projects the highest growth, while in Series C Australia's population reaches a peak of 24.9 million in 2048, then declines.
PROJECTED POPULATION, Australia
Since the early 1990s Australia's population has grown by around 1.2% and 1.3% per year, with just over half of this growth resulting from natural increase (the excess of births over deaths) and just under half from net overseas migration (NOM). In 2003–04 there were 252,100 births in Australia and 133,200 deaths, resulting in natural increase of 118,900 people, while NOM contributed a further 100,000 people to Australia's population.
In two of the three main series (Series B and C) a state of natural decrease, in which deaths outnumber births, is reached during the projection period (by 2044 and 2034 respectively). In Series B net overseas migration more than compensates for losses due to natural decrease, and Australia's population continues to increase throughout the projection period. In Series C however, gains due to overseas migration fail to compensate for natural decrease, and as a result Australia's population declines from 2049 onwards.
POPULATION AGEING
The ageing of Australia's population, already evident in the current age structure, will continue. This is the result of sustained low levels of fertility combined with increasing life expectancy at birth. The median age of Australia's population, 36.4 years at June 2004, is projected to increase to between 39.9 years and 41.7 years in 2021 (Series A and C respectively) and to between 44.6 years and 48.2 years in 2051 (Series A and C).
The age composition of Australia's population is projected to change considerably as a result of population ageing. By 2051 there will be a much greater proportion of people aged 65 years and over than in 2004, and a lower proportion of people aged under 15 years. In 2004 people aged 65 years and over made up 13% of Australia's population. This proportion is projected to increase to between 26% and 28% in 2051 (Series B and C respectively) and to between 27% and 31% in 2101 (Series B and C). The proportion of people aged under 15 years is projected to decrease from 20% in 2004 to between 13% and 16% in 2051 (Series C and A respectively) and to remain within the same range in 2101.
There were just under 300,000 people aged 85 years and over in Australia in 2004, making up 1.5% of the population. In all main series this group is projected to grow, to 2%–3% by 2021, to 6%–8% by 2051, and to 7%–10% by 2101.
STATES AND TERRITORIES
Series B
Series B projects continuing population growth throughout the period 2004 to 2051 for all states and territories other than South Australia and Tasmania.
By 2051 the population of New South Wales is projected to reach 8.7 million people, an increase of 2.0 million people (or 30%) since 2004, while Victoria is projected to reach 6.6 million people, an increase of 1.6 million people (or 32%).
Queensland is projected to experience the largest increase in population between 2004 and 2051, increasing by 3.0 million people (77%) to reach 6.9 million people, resulting in Queensland replacing Victoria as Australia's second most populous state in 2041.
Western Australia is projected to increase by 1.2 million people (60%) to reach a population of 3.2 million people in 2051.
South Australia's population is projected to reach 1.65 million people in 2032, and to then gradually decrease to 1.58 million people in 2051.
Tasmania's population is projected to peak at 504,500 people in 2023 or 2024, and to then decrease to 453,000 people in 2051. This is 6% fewer people than in 2004.
The Northern Territory's population is projected to increase by 150,200 people between 2004 and 2051, to 350,000 people. Although a smaller absolute increase than those projected for the larger states, this is a significant increase (75%, second only to Queensland's projected increase of 77%) relative to the Northern Territory's 2004 population of just under 200,000 people.
The population of the ACT is projected to increase by 77,500 people (24%) between 2004 and 2051, reaching 401,600 people.
Series A and C
Compared to Series B, Series A assumes higher levels of components of population change (fertility, life expectancy, and migration) while Series C assumes lower levels. As a result, Series A results in larger projected populations by 2051 and Series C results in lower populations.
Capital city growth
In Series B, all capital cities are projected to experience higher percentage growth than their respective balances, resulting in further concentration of Australia's population within the capital cities. At June 2004, 64% of Australians lived in a capital city. By 2051 this proportion is projected to increase to 66%.
Sydney and Melbourne will remain the two most populous cities in Australia, with 5.6 million and 5.0 million people respectively in 2051, while the population of Darwin is expected to exceed that of Hobart in 2048.
POPULATION SIZE, Observed and projected |
| |
| AT 30 JUNE 2004(a) | AT 30 JUNE 2021 | AT 30 JUNE 2051 | |
| Observed | Series A | Series B | Series C | Series A | Series B | Series C | |
| Capital city/balance of state | '000 | '000 | '000 | '000 | '000 | '000 | '000 | |
| |
| Sydney | 4 225.1 | 4 970.9 | 4 871.5 | 4 813.8 | 6 311.6 | 5 608.8 | 5 292.1 | |
| Total New South Wales | 6 720.8 | 7 944.6 | 7 714.4 | 7 525.4 | 10 107.9 | 8 742.7 | 7 960.4 | |
| Melbourne | 3 593.0 | 4 411.2 | 4 253.4 | 4 135.3 | 5 894.6 | 5 041.1 | 4 566.8 | |
| Total Victoria | 4 963.0 | 5 886.8 | 5 761.7 | 5 681.8 | 7 428.7 | 6 574.1 | 6 191.2 | |
| Brisbane | 1 777.7 | 2 597.4 | 2 403.6 | 2 238.3 | 4 202.0 | 3 354.7 | 2 778.1 | |
| Total Queensland | 3 888.1 | 5 526.9 | 5 149.2 | 4 816.3 | 8 584.8 | 6 899.0 | 5 744.1 | |
| Adelaide | 1 123.2 | 1 212.5 | 1 201.3 | 1 186.9 | 1 326.8 | 1 203.9 | 1 138.5 | |
| Total South Australia | 1 532.7 | 1 635.8 | 1 625.2 | 1 620.7 | 1 736.1 | 1 580.7 | 1 537.5 | |
| Perth | 1 454.6 | 1 994.2 | 1 875.3 | 1 749.4 | 2 999.2 | 2 453.6 | 2 017.6 | |
| Total Western Australia | 1 978.1 | 2 655.9 | 2 498.4 | 2 328.9 | 3 890.2 | 3 164.5 | 2 578.6 | |
| Hobart | 202.2 | 235.7 | 220.2 | 207.4 | 286.9 | 219.6 | 178.2 | |
| Total Tasmania | 482.2 | 543.7 | 504.0 | 466.8 | 620.1 | 453.0 | 335.4 | |
| Darwin | 109.4 | 164.8 | 149.7 | 127.5 | 295.5 | 232.3 | 153.0 | |
| Total Northern Territory | 199.8 | 279.2 | 250.9 | 215.3 | 470.5 | 350.0 | 224.3 | |
| Total Australian Capital Territory | 324.1 | 402.1 | 364.5 | 330.1 | 547.1 | 401.6 | 289.5 | |
| Total capital cities(b) | 12 809.3 | 15 988.8 | 15 339.4 | 14 788.7 | 21 863.7 | 18 515.7 | 16 413.8 | |
| Total balance of state | 7 279.6 | 8 886.3 | 8 528.7 | 8 196.6 | 11 521.7 | 9 650.1 | 8 447.0 | |
| Australia(c) | 20 091.5 | 24 878.4 | 23 871.4 | 22 988.4 | 33 389.8 | 28 169.7 | 24 864.5 | |
| |
| (a) Estimated resident population, base population. |
| (b) Includes the Australian Capital Territory. |
| (c) Includes Other Territories. |
 Print Page
 Print All