Education News - January, 2011
This newsletter highlights the latest curriculum related teaching resources, student activities and statistical tools that have been developed by ABS Education Services as well as other ABS resources that are useful for schools.
Contents
- CensusAtSchool News
- ISLP international poster competition
- International Data Tool
- Classroom ideas
- Interact with our data
- Conferences
- Recently released publications
- Contact details
 | Just a quick note to introduce myself – my name is Andrea MacGlashan and I'm the new editor of Education News – a position that's part of a general administrative role. I'm a relative newbie at the ABS, initially employed on a short term contract to rewrite the CensusAtSchool pages and then offered this position while Sarah Jost (the previous editor) is on maternity leave.
The theme for this edition is environment – a very pertinent subject considering the devastating floods in Queensland, New South Wales and Victoria. In Classroom ideas, we've suggested a topic for classroom discussion, and an activity about conservation measures taken by students and their families.
One of the things I'd like to do is interview a teacher about their experience of taking part in a CensusAtSchool Questionnaire. If you are interested, please contact me on 03 9615 7662 to arrange an interview. Oh, and don't hesitate to contact me if you have any suggestions for articles or activities that you would like covered in the next edition of EdNews. |
 |
1. 2011 CensusAtSchool Questionnaire is open
 | The 2011 CensusAtSchool Questionnaire is now open. We're now running the questionnaire annually, It still has questions that students will find stimulating and interactive sections such as the concentration game and reaction times test.
'Students love CensusAtSchool,' says Jean Arnott, 'because
the data is about them and their peers. It also encourages
them to ask questions of the data - an essential skill for
statistical literacy.'
Make sure your students don't miss out on being part of Australia's premier database.
If you haven't registered yet, it's simple
1. go to www.abs.gov.au/censusatschool
2. choose Teacher Account to set up your account (this takes about 2 minutes)
3. generate Student Access Numbers (another 2 minutes)
and you're ready
IMPORTANT: Due to a technical issue between Friday 26/11 and Monday 6/12/2010 some C@S teacher registrations may have been lost. If you registered, but can't log in, please re-register. If you have any problems please call us on Free Call 1800 623 273.
|
2. Big prizes for ISLP poster competition
 | This year the International Statistical Literacy Project poster competition has the general theme of 'environment'. Australian entries are being coordinated by the Education Services Unit of the Australian Bureau of Statistics. The ABS is offering substantial prizes to the Australian winning entrants: $500 to the senior winner and $300 to the junior winner to be shared equally between the students and their schools. (The ABS will only award a prize if the best entry is of a sufficient, age appropriate standard and demonstrates correct statistical usage. The judges decision will be final.)
|
| | Categories:
Teams:
Format:
Prizes: | Students born in 1995 and younger
students born in 1992 or younger
must be either 2 or 3 students and registered with ISLP by a teacher
physical - A1 (841x594)
electronic - file size maximum 2 MB
Junior - $300 ($150 to student, $150 to school)
Senior - $500 ($250 to student, $250 to school) |
| | Competition timeline
Registration
Entries close
Winners announced
International winners announced |
Now open
16 May 2011
30 May 2011
30 July 2011 |
|
Registration, guidelines and teacher's notes for the competition can be found on the ISLP website or contact Education Services if you have further questions.
Competition Resources
There's plenty of data about the environment available on the ABS website that your students could use in their posters. A good place to start is the list of Environment and Energy releases from the ABS. As well as data in Excel spreadsheets there are a number of articles on different aspects of Australia's environment that could be useful for your students' background research. For instance, there's the article Australia's Biodiversitywhich discusses our terrestrial and aquatic ecosystems, the threats to them, and how they are being protected.
Another series of articles worth considering comes under the catalogue heading of Australia's Environment: Issues and Trend. This collection has articles about: climate change; air quality; greenhouse gases; and population and economic growth trends.
Also, your students can generate data samples from CensusAtSchool that include Australian students' attitudes to environmental issues. Students can generate samples using the Australian Random Sampler or make international comparisons via the International CensusAtSchool Data Tool. |
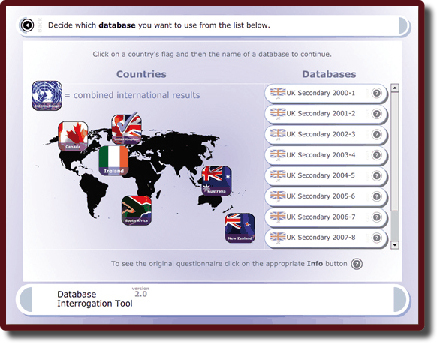
3. International Data Tool
| Australian CensusAtSchool data has been added to the International CensusAtSchool Data Tool - a resource maintained by the UK Royal Statistical Society. The Data Tool is colourful, easy to use and includes data from a number of years for the United Kingdom, New Zealand, Canada, South Africa and Australia. There are a variety of graphs and plots to choose from including 3D, dot, star, box whisker, pie and bar.
There is also an international database that includes the common questions from the United Kingdom, New Zealand, Canada and Australia for 2008 so your students can quickly compare one query's results from these countries. |
International CensusAtSchool Data Tool
| |
4. Classroom Ideas
Geography - Environmental Hazards: what a difference a few months makes
Images of flooding in Queensland, New South Wales and Victoria remind us how quickly a situation can change. For instance, the La Nina events that precipitated the horrific flooding in January were preceded by years of drought under the parching influence of El Nino. Years of drought were probably one of the reasons why water conservation was the focus when the ABS surveyed Australia's population in March 2010 and published its results in 'Environmental issues: water use and conservation' (cat # 4602.0.55.003).
'Environmental issues' covers a range of topics including household water sources, water usage, and water saving practices inside and outside the dwelling. In an instance that would be ironic if not for the tragic outcomes of the floods, the data shows a marked increase in the number of rainwater tanks in use in households in Queensland and Victoria. A key factor influencing the sources of water available to Australian households is the location of dwellings; however, climate and government policy also play a part.
Following the recent flood events you may like to discuss with your students: why flooding occurs; which areas of their neighbourhood are most likely to flood; how particular areas could be protected from flooding; and the role of governments before, during and after a flood event.
SOURCES OF WATER
|
| NSW | VIC | QLD | SA | WA | TAS | NT | AUST |
|
March 2010 (%) |
| Mains or town water | 94.6 | 94.2 | 91.2 | 91.2 | 93.7 | 82.4 | 91.0 | 93.2 |
| Rainwater tank | 17.6 | 29.6 | 36.5 | 49.3 | 13.9 | 22.7 | *4.7 | 26.4 |
| Purchased bottled water | 20.3 | 19.6 | 19.3 | 17.3 | 18.8 | 14.6 | 6.3 | 26.4 |
March 2007 (%) |
| Mains or town water | 95.1 | 93.9 | 90.0 | 93.6 | 94.6 | 84.0 | 91.8 | 93.4 |
| Rainwater tank | 15.8 | 16.7 | 22.1 | 45.5 | 13.6 | 21.4 | *5.5 | 19.3 |
| Purchased bottled water | 18.5 | 16.8 | 18.8 | 22.0 | 21.6 | 17.4 | 11.7 | 18.6 |
|
*indicates an estimate and should be used with caution
Mathematics - CaSQ 31 Is my class green? Comparing samples and population
This activity is based on the CensusAtSchool questionnaire section 'What actions do you take at home to conserve the environment:?' where students answered yes or no to:
- my household has installed a water tank
- my household has installed a water saving shower head
- I take shorter showers
- I turn off the tap while I brush my teeth
- I turn off appliances (eg TV, computer, gaming consoles) at the power point
- my household recycles our rubbish
There are five tasks in this activity. Students are requested to:
- survey their class using the above question and subclauses
- place the data in a table
- create a graph that compares the data about their class with a table of summarised data from students responses to the 2010 C@S Questionnaire (provided in the activity)
- write a paragraph about the differences and similarities in the two sets of data
- conceptualise how the data from their class might differ from other data obtained from the C@S Random Sampler
We would love to hear
feedback from anyone who finds this activity useful or has ideas for improving it.
Do you have a classroom idea that uses ABS data or ABS Education products? Let us know at education@abs.gov.au and we can share it with schools around Australia.
5. Interact with our data
The Interact with our data page has some great animated charts that allow you to examine indicators over time. Try clicking on one of the topics below to view its chart; clicking on the chart and then pressing the appropriate button will enable you to see it in action.

Google Motion Charts House Price Indexes
Each Australian capital city is represented by a bubble and it's colour and size is related to the median house price.
Google Motion Charts Australian Population Projections
This chart demonstrates population projections for 2006-2056.

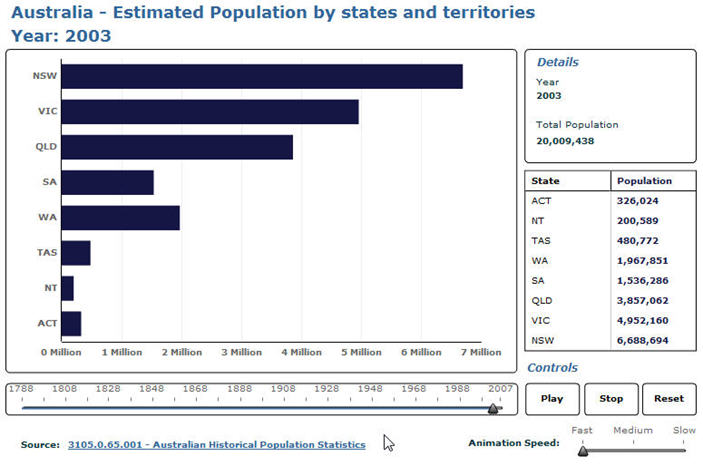
Australian Historical Population
See how Australia's population has grown between 1788-2007.
Animated Population Pyramid
The ratio of females to males is shown in a graph that includes projections to 2056.

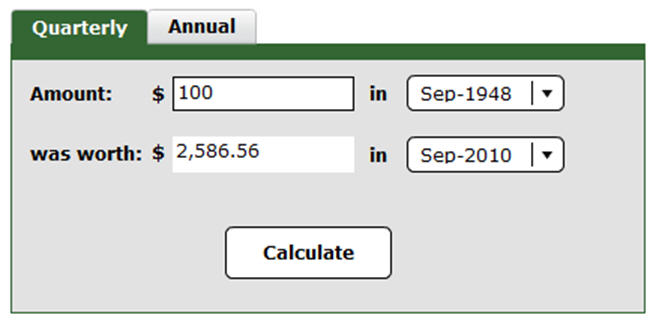
Calculator – What Can I Buy, Then and Now?
Enter two dates into this tool and see how the purchasing power of money has changed over time.
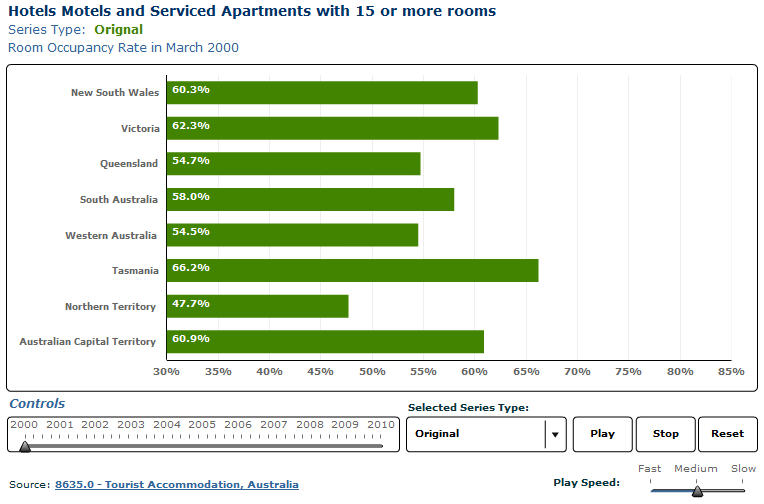
Tourist Accommodation – Room Occupancy Rate, Australia
Compare state-by-state how many people stayed in hotels, motels and serviced apartments.
6. Conferences
In January, Pat Beeson, our Geography teacher consultant and Melanie Johns from the South Australian ABS office attended the Australian Geography Teachers Association (AGTA ) conference in Adelaide. Melanie showed workshop participants just how much local area data that is available for no charge from the ABS web site and Pat demonstrated how this wealth of information can be used to engage, challenge and assist students.
Late in 2010, Mary-Anne Aram delivered workshops at the Mathematics Association Western Australia Secondary conference in Fremantle. At the Mathematics Association Victoria annual conference, Mary-Anne and Teacher Consultant Jean Arnott, presented workshops that gave participants hands-on experience with some of the great products and activities that we provide.
We'll be attending some of the major conferences in 2011, so keep an eye out for Education Services workshops or the CensusAtSchool stand and come and say hello.
7. Recently Released Publications
Australian households: the future (cat # 4102.0)
Australian households are changing. For instance, the fastest growing type of household is lone person households which are projected to increase by an average of 2.2% per year. A lone person household consists of a person of at least 15 years of age who lives in a dwelling on their own. In 2006 there were 1.9 million lone person households and it is projected that this figure will increase to 3.2 million by 2031. So who are these lone persons and why do they live by themselves? This article looks at the historical trends in living arrangements and uses household and family projections to examine a range of possible scenarios for future living arrangements for Australian households.
Participation in sport and physical recreation, Australia, 2009-10 (cat # 4177.0)
Nearly two-thirds of the Australian population aged 15 years and over have participated in sport and physical recreation at least once in the past 12 months. The three most popular sport or physical recreation activities were walking (23%); aerobics, fitness and gym activities (14%); and swimming and/or diving (7%). Just over half of the Australian population takes part in activities that are not formally organised and one quarter are involved in activities that are organised; however, more men (28%) than women (24%) participated in the latter.
Apparent consumption of alcohol: extended time series (cat # 4307.0.55.002)
How much alcohol per individual do Australians drink? Is this amount increasing or decreasing? This publication provides estimates of the apparent per capita consumption for beer, wine, spirits and pre-mixed beverages for the population aged 15 years and over. Given the historical nature of the series, the data is most useful as a guide to long-term trends in apparent alcohol consumption in Australia. However no particular emphasis can be placed on any one year, or on year-to-year changes given the historical nature of the series.
Job search experience, Australia (cat # 6222.0) This publication presents information about the experiences of unemployed people in seeking work, in terms of the steps they have taken and the difficulties they have encountered in finding work. It also presents information about employed people who started their current job in the previous 12 months. For this group, data on the steps taken to attain work and current job details are provided.
Attendance at selected cultural venues and events, Australia, 2009-10 (cat # 4114.0) This publication contains details of the frequence of visits and characteristics of people who attended a range of cultural venues and events, including libraries, archives, museums, music and performing arts performances, cinemas, botanic gardens, zoological parks and aquariums. There is separate data for Australia and each of the states and territories, males and females and various age groups.
Remember, all ABS publications are free to download from the ABS website.
You can view the full range of previously released publications from the ABS under Previous Releases.
8. Contact Details
How to contact ABS Education Services
Free Call: 1800 623 273
email: education@abs.gov.au
Mail: GPO Box 2796
Melbourne, 3001
Visit us on Facebook: http://www.facebook.com/pages/CensusAtSchool-Australia/196675585747
By clicking on the Facebook link you will be taken to a web page external to the ABS.
Subscribe
Education News is a totally free resource that aims to assist teachers use ABS data in their classroom. When you subscribe you will be notified of each new edition as it is published.
 Print Page
 Print All