In the Labour Force Survey, employed persons are regarded as either full-time or part-time, depending on the number of hours worked. Full-time workers are those who worked 35 hours or more during the reference week of the Labour Force Survey, or who usually worked 35 hours or more each week in all jobs. Part-time workers are those who usually worked less than 35 hours a week and who did so during the reference week.
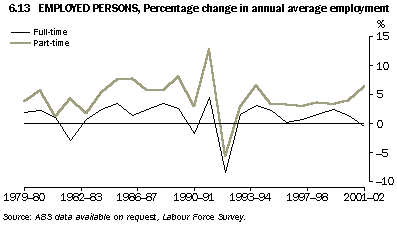
Graph 6.13 shows annual percentage increases in part-time and full-time employment since 1979-80. For most of this period part-time and full-time employment have followed much the same pattern. The major exceptions to this have been 1981-82 to 1982-83 and from 1999-2000 onwards. While the patterns of change have been similar, in every year part-time employment has increased at a greater rate than full-time employment in each year (or decreased at a lesser rate during the recession of the early 1990s).
As part-time employment has been increasing at a faster rate than full-time employment over this period, it follows that the proportion of part-time employed persons has also risen over the period. The proportion of part-time employed persons has steadily increased, from 16% in 1979-80 to 28% in 2001-02.
Following a period of strong economic growth in the late 1980s and early 1990s, and the subsequent recession of the early 1990s, employment growth fluctuated considerably. In 1991-92, both full-time employment (up 5%) and part-time employment (up 13%) recorded strong increases. In 1992-93, as the impact of the recession and its effects on the demand for labour were felt in the labour market, full-time employment and part-time employment both fell strongly, recording decreases of 8% and 6% respectively.
6.14 EMPLOYED PERSONS, Full-time and part-time workers: Annual average(a) - 2001-02
|
 | | Age group (years)
| |
|
| Units | 15-19 | 20-24 | 25-34 | 35-44 | 45-54 | 55-59 | 60-64 | 65 and over | Total |
|
MALES |
|
| Full-time workers | ’000 | 145.4 | 415.3 | 1,129.0 | 1,182.4 | 1,027.4 | 313.6 | 146.1 | 60.0 | 4,419.1 |
| Part-time workers | ’000 | 191.8 | 122.6 | 109.3 | 93.1 | 86.5 | 47.1 | 42.3 | 48.7 | 741.3 |
| Total | ’000 | 337.1 | 537.9 | 1,238.3 | 1,275.5 | 1,113.9 | 360.7 | 188.4 | 108.7 | 5,160.4 |
| Proportion of part-time workers | % | 56.9 | 22.8 | 8.8 | 7.3 | 7.8 | 13.1 | 22.4 | 44.8 | 14.4 |
|
FEMALES |
|
| Full-time workers | ’000 | 81.9 | 302.6 | 634.0 | 517.2 | 519.9 | 124.6 | 38.7 | 13.4 | 2,232.4 |
| Part-time workers | ’000 | 252.7 | 177.7 | 329.0 | 485.7 | 383.2 | 123.3 | 55.7 | 31.7 | 1,839.2 |
| Total | ’000 | 334.6 | 480.3 | 963.1 | 1,003.0 | 903.1 | 247.9 | 94.5 | 45.1 | 4,071.6 |
| Proportion of part-time workers | % | 75.5 | 37.0 | 34.2 | 48.4 | 42.4 | 49.8 | 59.0 | 70.3 | 45.2 |
|
PERSONS |
|
| Full-time workers | ’000 | 227.3 | 717.9 | 1,763.0 | 1,699.6 | 1,547.3 | 438.2 | 184.9 | 73.4 | 6,651.5 |
| Part-time workers | ’000 | 444.5 | 300.3 | 438.3 | 578.9 | 469.7 | 170.4 | 98.0 | 80.4 | 2,580.5 |
| Total | ’000 | 671.8 | 1,018.2 | 2,201.3 | 2,278.5 | 2,017.0 | 608.6 | 282.8 | 153.8 | 9,232.0 |
| Proportion of part-time workers | % | 66.2 | 29.5 | 19.9 | 25.4 | 23.3 | 28.0 | 34.6 | 52.3 | 27.9 |
|
| (a) Annual averages based on monthly data. |
Source: ABS data available on request, Labour Force Survey. |
 Print Page